
A headwind for International stocks

Key points
- World stocks have underperformed U.S. stocks for so long that some assume a turning point must be near
- World stock indexes have long demonstrated a consistent annual seasonal pattern
- History suggests that the May/June period falls into the "unfavorable" category
Data for testing purposes
We will use the MXWO Index, which represents the MSCI World Index, to highlight the longest possible test. We will use monthly closing price data starting on 1969-12-31.
We will deem the following months of the year as favorable for international indexes:
- January through April, July, November and December
We will deem the following months of the year as unfavorable for international indexes:
- May and June, August, September and October
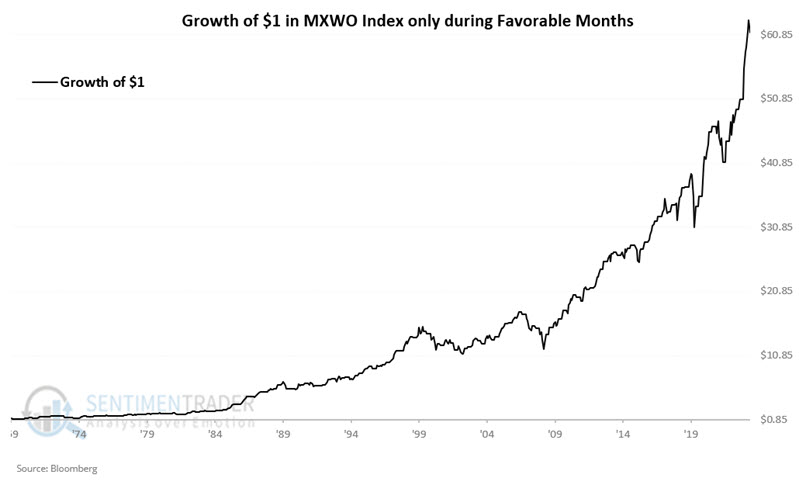
Favorable Months for World Indexes
The chart below displays the hypothetical growth of $1 invested in the MXWO Index only during the favorable months listed above, starting in 1970. The cumulative gain through 2024-04-26 is +6,022.1%.
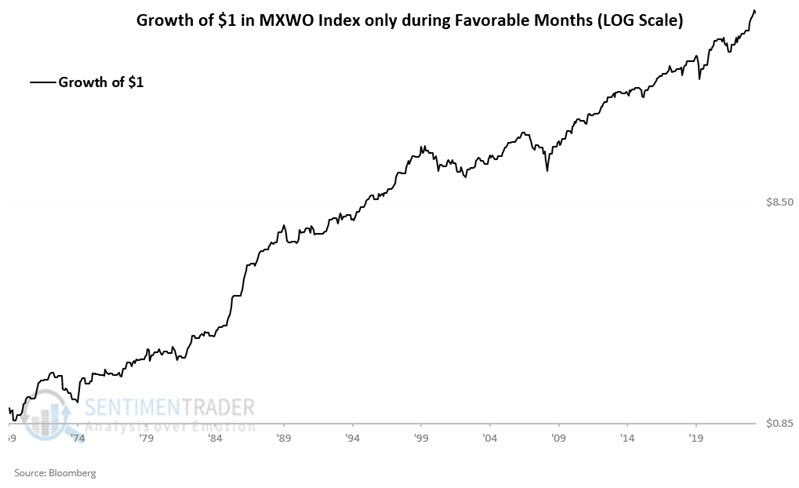
The chart below displays the same results using a logarithmic scale. The results are not without drawdown and multi-year flat periods. Still, the "lower left to upper right" trend is unmistakable.
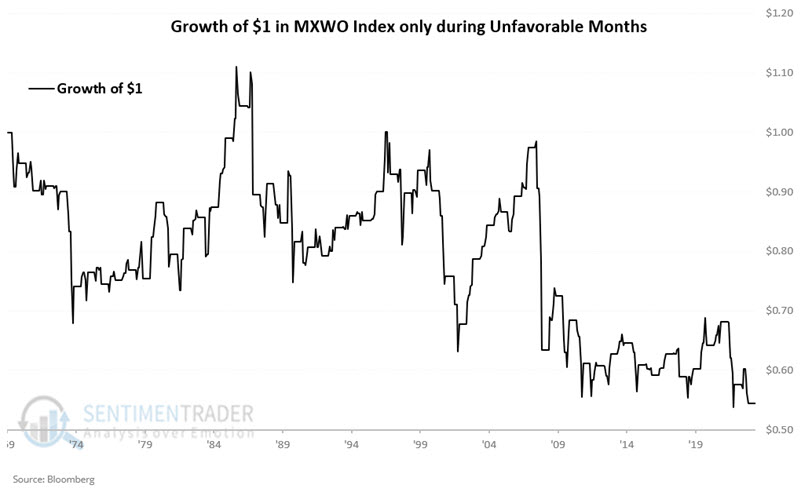
Unfavorable Months for World Indexes
Now let's look at the MXWO Index performance during unfavorable months.
The chart below displays the hypothetical growth of $1 invested in the MXWO Index only during the unfavorable months listed above, starting in 1970. The cumulative decline through 2024-04-26 is (-45.5%)
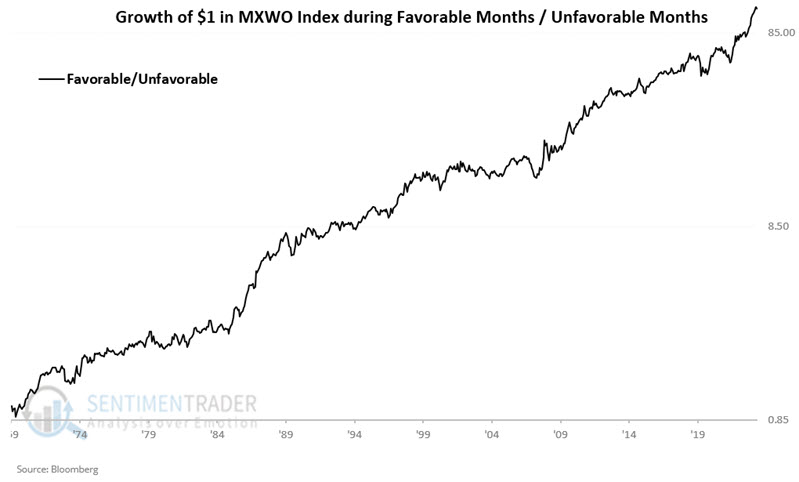
$1 invested in MXWO during favorable months grew to $61.22, while $1 invested in MCWO during unfavorable months declined to $0.54. The chart below divides these two series each month to display the relative performance for favorable versus unfavorable months. The key thing to note is the tendency for favorable months to outperform unfavorable months over time consistently. Again, the key thing to note is the long-term consistency in the outperformance of "favorable" months relative to "unfavorable" months.
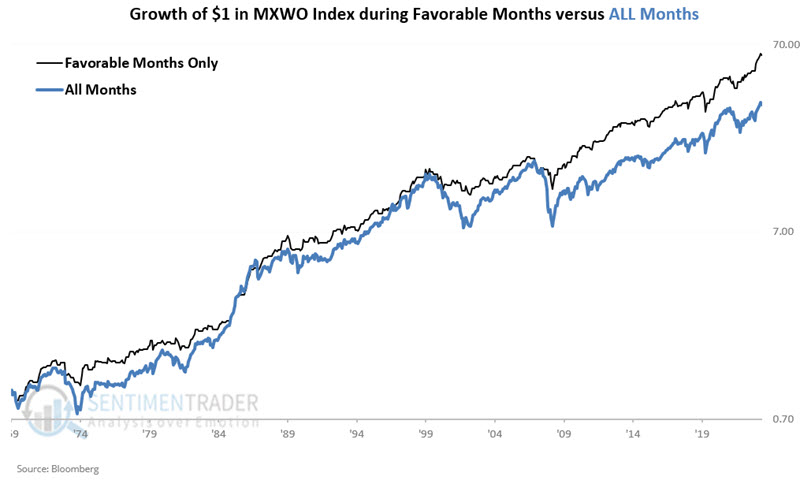
Favorable Months versus All Months
Next, the chart below displays the hypothetical cumulative growth of $1 invested in MXWO only during favorable months versus $1 invested in MXWO during all months (i.e., buy-and-hold). Note that no interest or other gains are to the cumulative total for favorable months during unfavorable months when one would technically be out of the market (which would theoretically increase the value of the black line).
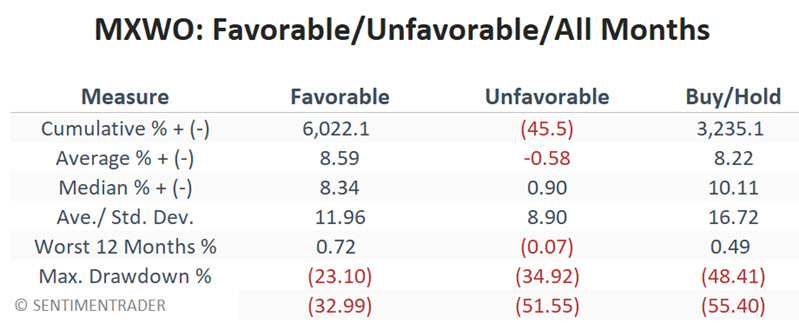
Lastly, the table below displays the relevant performance results for Favorable Months, Unfavorable Months, and All Months.
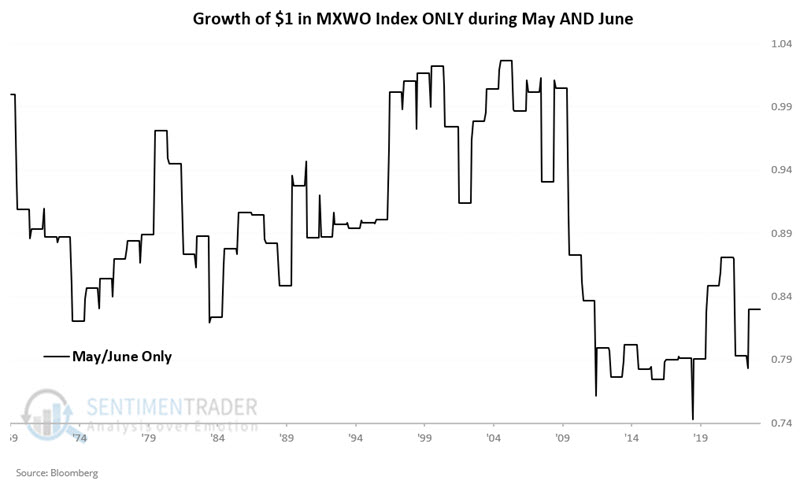
A closer look at May and June
The abovementioned model suggests staying out of the MXWO Index during May and June. Yet, there are no guarantees on a year-to-year basis. The chart below displays the hypothetical growth of $1 invested in MXWO only during May and June every year since 1970. The cumulative return is -17.0%.
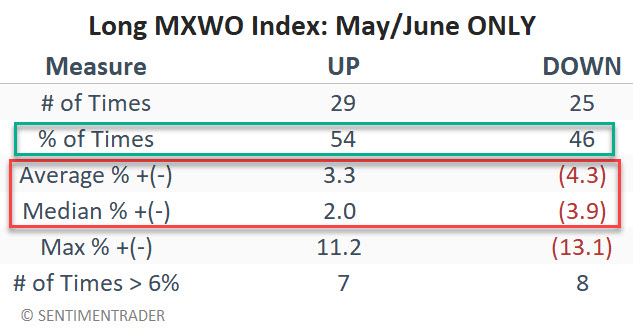
However, if we look at the statistics in the table below, we find that the combined May/June period showed a gain 54% of the time. The catch is that the average and median declines outstripped the average and median gains.
An ETF Alternative
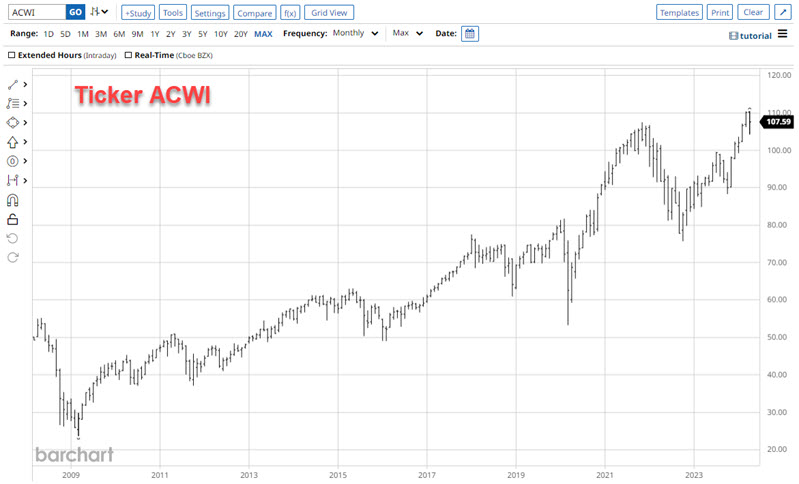
The iShares MSCI ACWI ETF (ticker ACWI) has a 0.9986 correlation coefficient with the MXWO Index, making it an ideal trading candidate for traders or investors looking to take advantage of the information highlighted above (chart below courtesy of www.BarChart.com).
For the remainder of 2024, a trader would:
- Sell ACWI at the end of April
- Buy ACWI at the end of June
- Sell ACWI at the end of July
- Buy ACWI at the end of October (and hold through April 2025)
What the research tells us…
May and June are technically designated as "unfavorable" months for international stocks in general and the MXWO Index specifically. Does this mean world stock indexes will perform poorly in the months ahead? Not at all. Over any year or group of years, there is no guarantee that world stock indexes will perform better during the months designated earlier as "favorable" months than during unfavorable or all months.
With that caveat in mind, the 50+ year record shows the index with a larger cumulative gain, a lower monthly standard deviation, and significantly lower drawdowns than during unfavorable months or via a buy-and-hold approach.