
A great year to buy the dip

Key points:
- The Nasdaq 100 and S&P 500 have had historic rebounds after down days
- Years with exceptional buy-the-dip sentiment among traders tended to see further gains
- There were some nasty exceptions, but a generally positive buy-the-dip mentality was better for the Nasdaq 100
Taking advantage of better prices
I grew up poor.
I can still taste the waxy paste of government cheese, my tongue scraping the backs of my teeth to root out sticky remnants. In high school, I was too embarrassed to use the free meal vouchers, so I'd skip lunch and spend 25 cents on a box of Jujubes sold by the school band. Again, my tongue worked the backs of my teeth afterward.
Even now, anything sticky brings me right back to those days. My parents were exceptionally hard-working but financially naive. I had to scratch and claw for every dollar.
That's why, when I read something in the financial press, my first instinct is caution. For 25 years, I've been semi-obsessive about claims of irrational exuberance, watching for bubbles, searching for what could go wrong. I'm not a pessimist, but I have raw memories of what it feels like to have nothing.
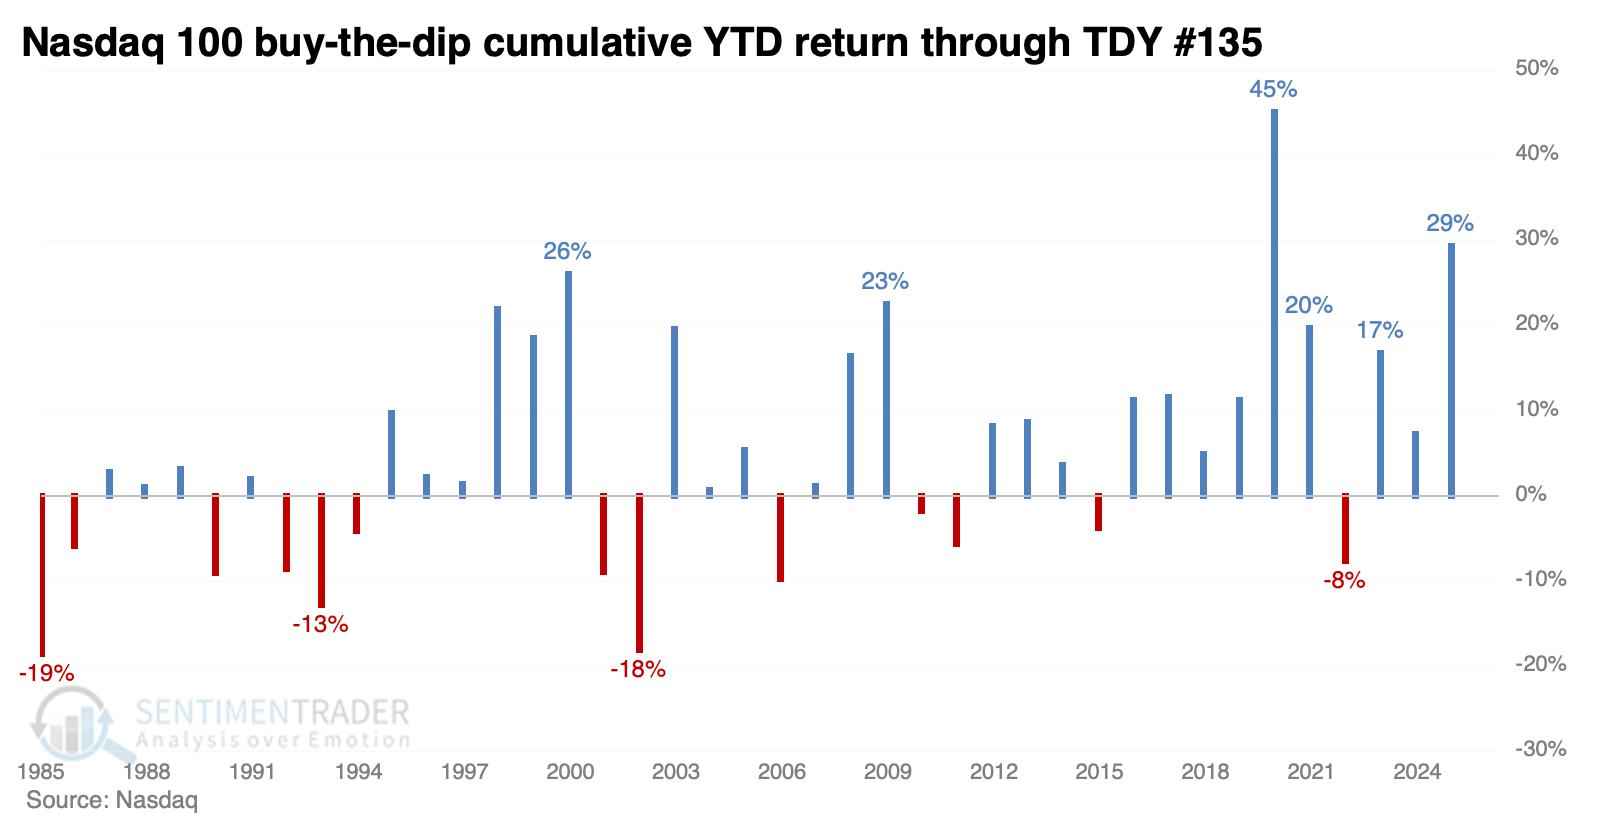
My antennae tingled when the Financial Times noted that retail investors have been reaping bargains by buying tech stocks on days they decline. By doing so and simply holding for the next session, their theoretical cumulative return in 2025 is among the best ever. That smacks of dangerous levels of confidence because "the market always bounces back."
So far this year, the cumulative gain by buying a down day in the Nasdaq 100 (NDX) and holding it only for the next session is +29%. That's second only to 2020 and ahead of the year 2000.
The key question for practitioners is always, "So what?" Let's try to answer that.
Just keep buying
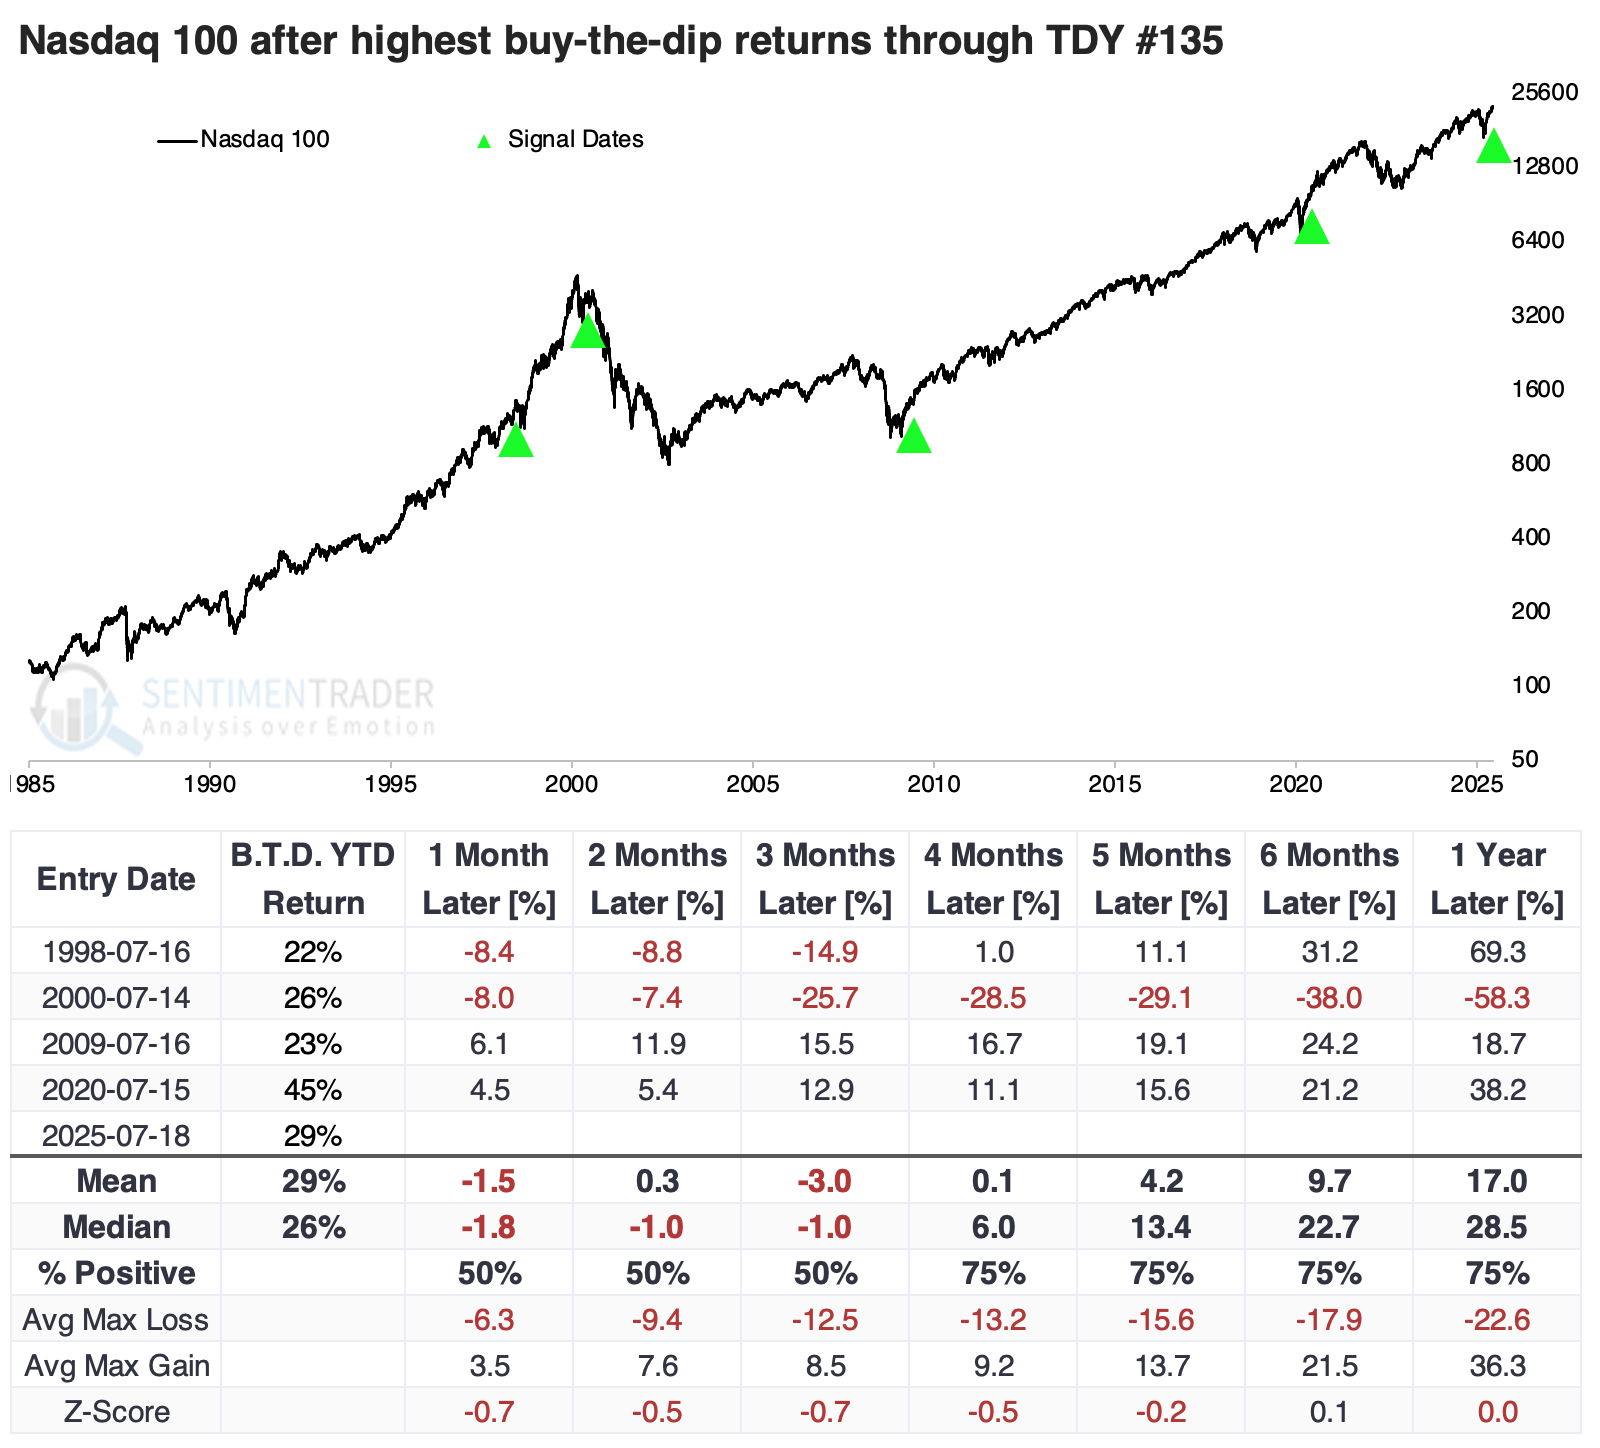
The table below shows returns in the NDX after years with the best cumulative year-to-date (YTD) return through Trading Day of the Year (TDY) #135 - basically, mid-July. There were only four other years with a YTD buy-the-dip return greater than +20%, and while the instance in 2000 pretty much marked the bull market peak, and there was a big dip in 1998, three of the four preceded gains from 4-12 months later.
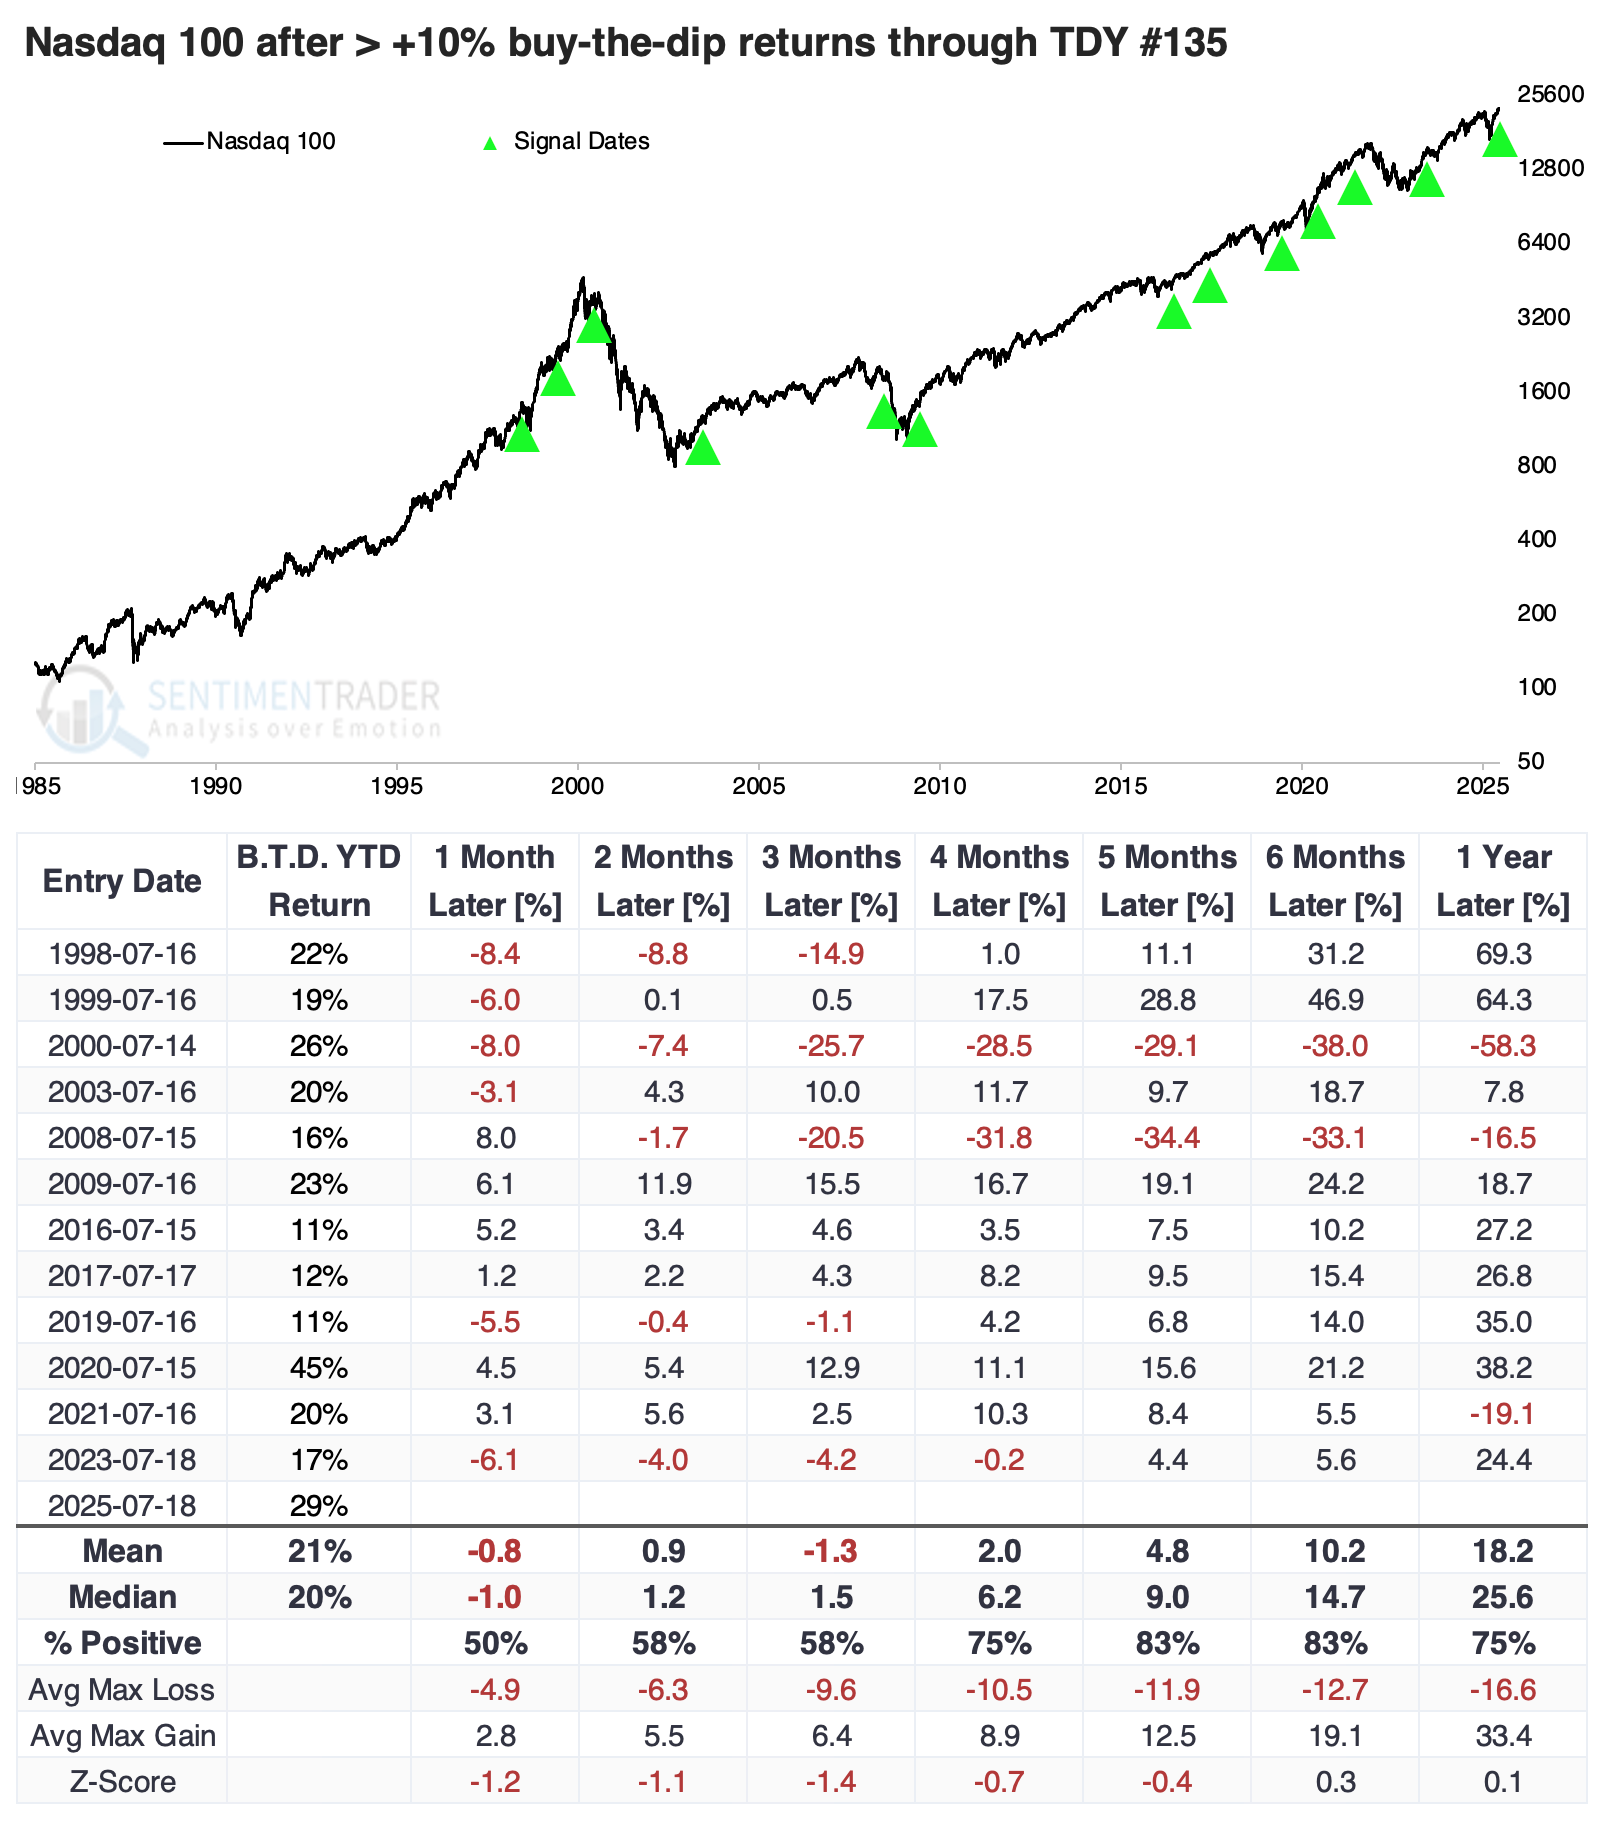
Since relying on a sample size of four is tough, the following table shows all years with a YTD buy-the-dip gain of +10% or more. The following five to six months were positive all but two times, so that's the good news. The bad news is that the two exceptions were horrible losses, and the median returns and risk/reward ratios weren't all that impressive.
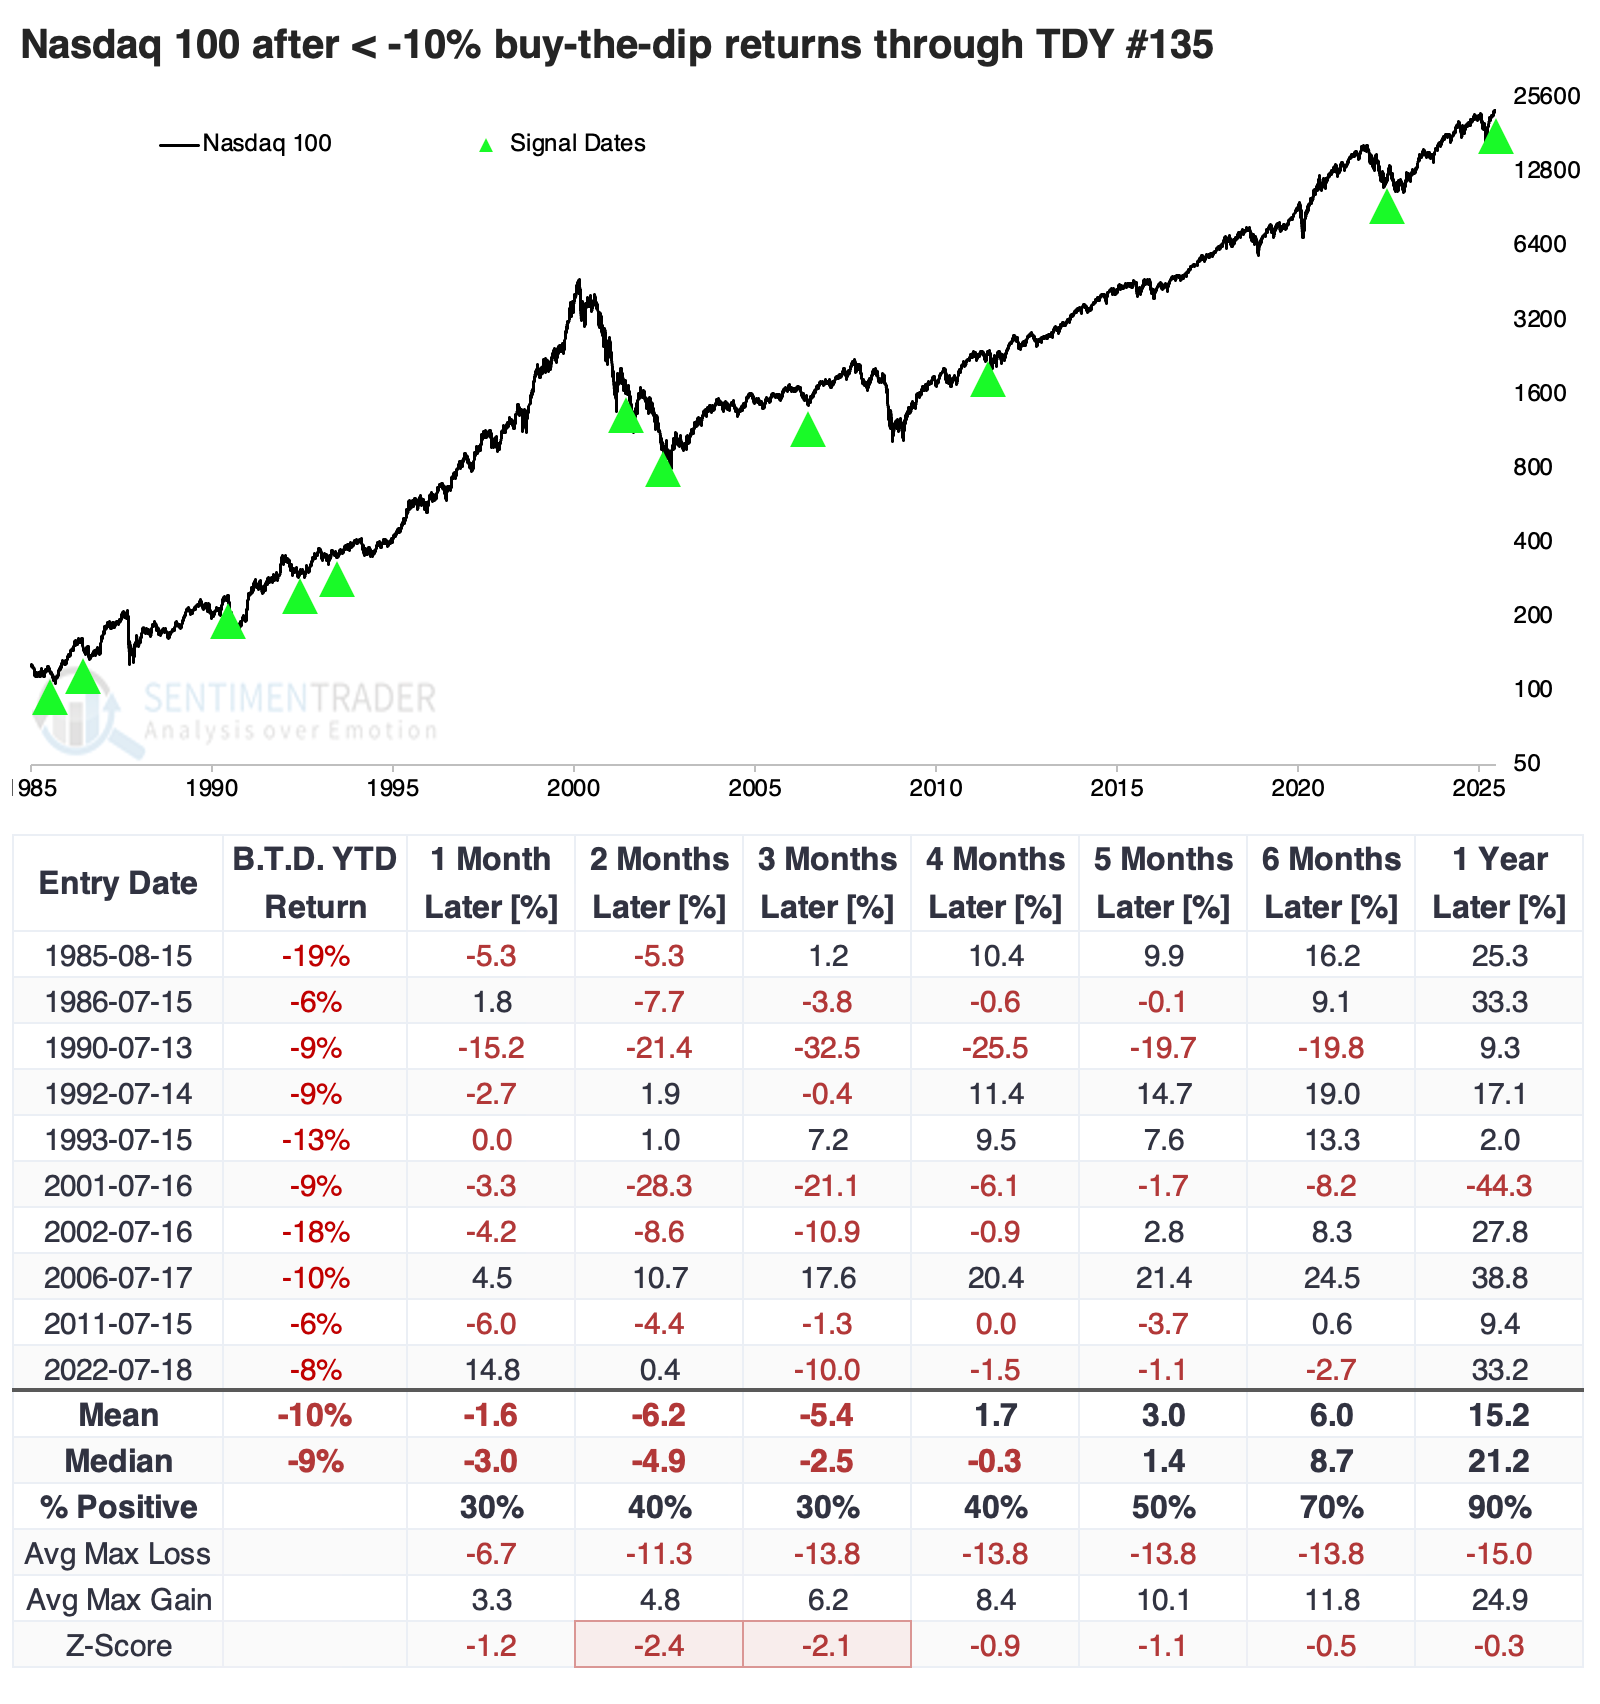
We like to look at counterexamples, so the table below shows the opposite condition. These are years when the NDX buy-the-dip strategy yielded a cumulative YTD return of -10% or worse through TDY #135.
This was not a good sign for tech stocks. When traders were less inclined to step in on weakness, it tended to precede even more weakness in the month(s) ahead. The Nasdaq 100 rallied only 30% of the time over the following three months.
Buying the broader dip
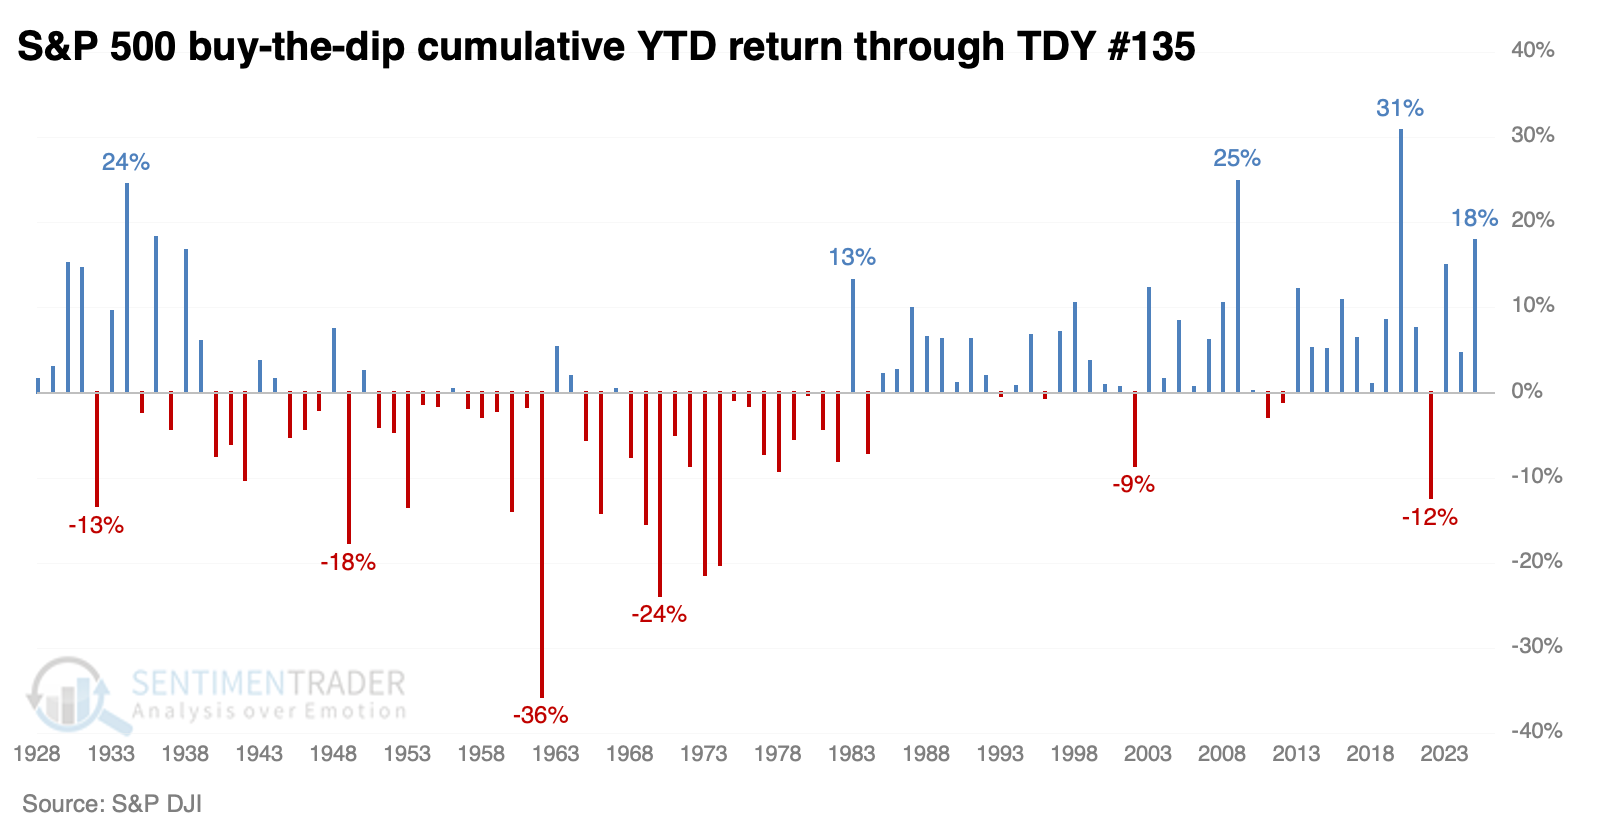
The S&P 500 has a much longer history, but 2025 still stands out for buy-the-dip sentiment. The S&P's cumulative +18% return this year is tied for the 4th-highest since 1928.
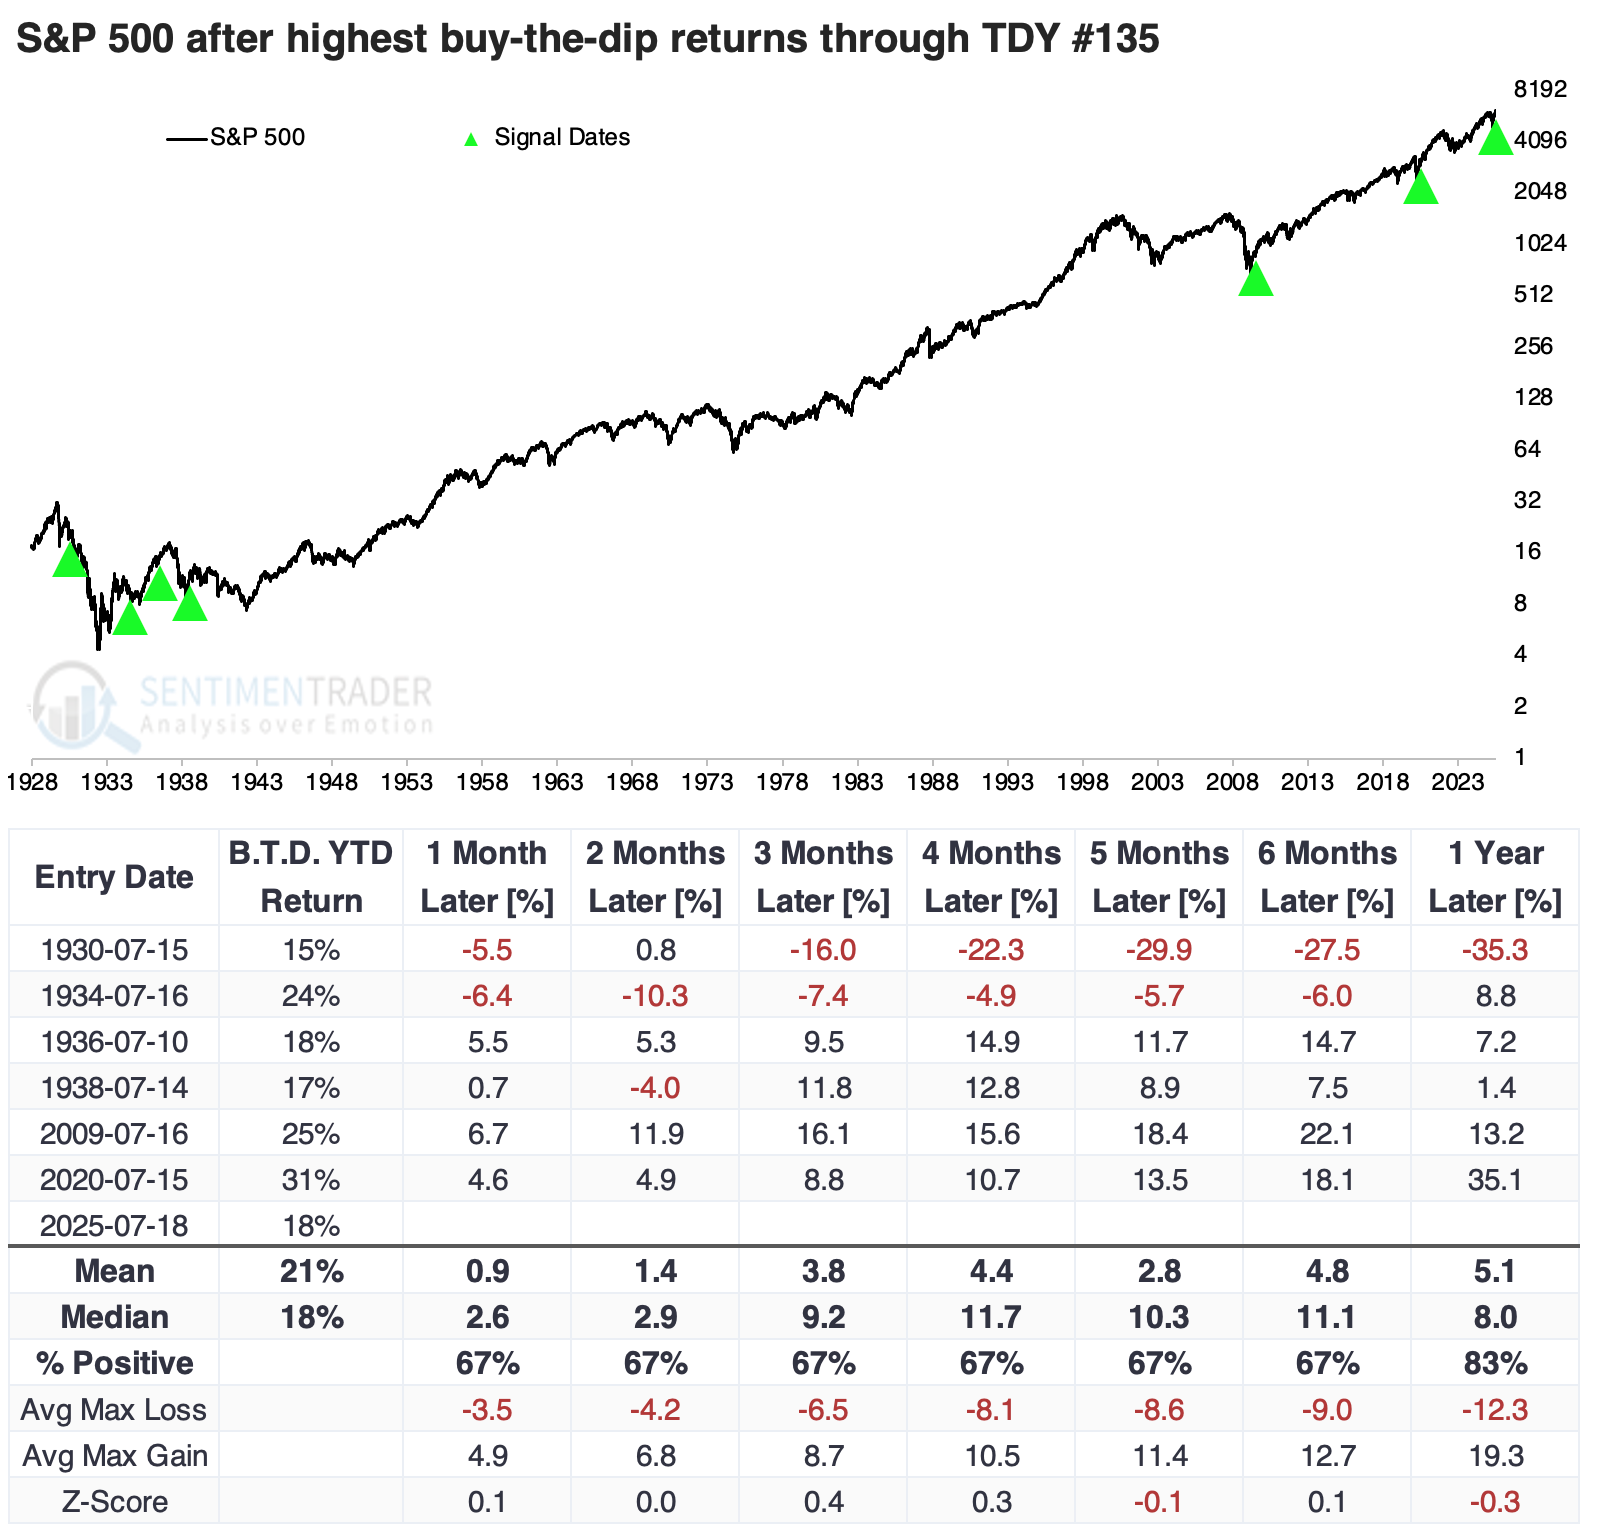
The table below shows the handful of times the S&P generated a cumulative buy-the-dip return of +15% or more through approximately mid-July. Again, as much as we can tell from a tiny sample size, it was mostly a good sign. The only significant loss was in 1930; all the others showed a one-year positive return. Both recent instances coincided with the initial stages of sustained bull markets.
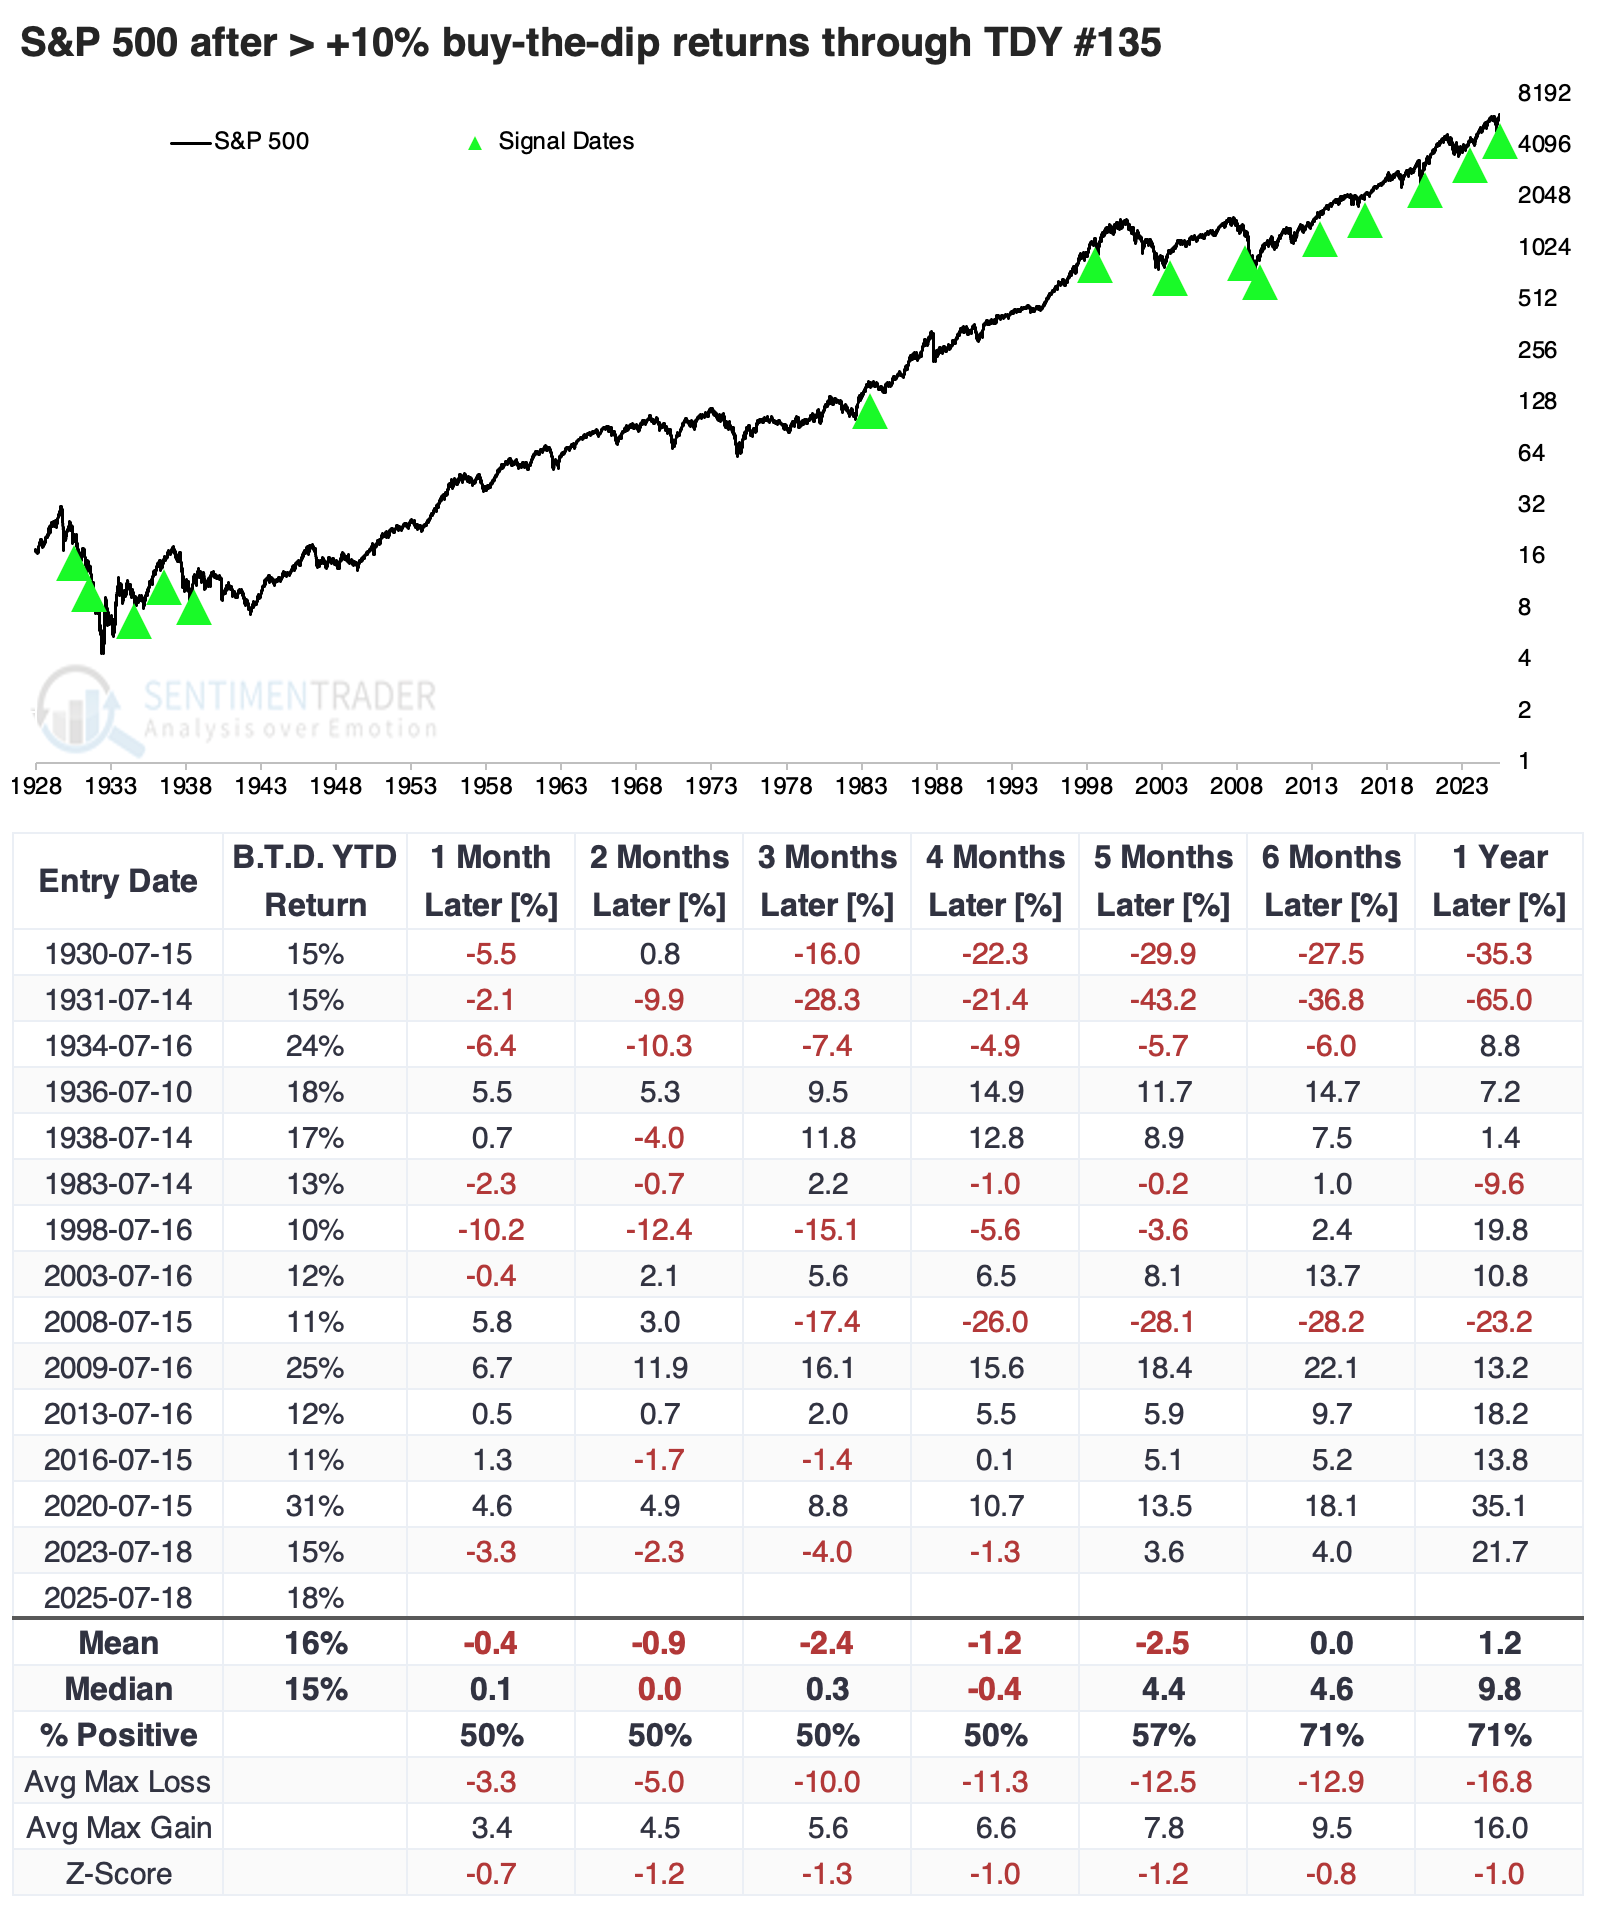
Below, we can see an expanded sample by looking at all YTD buy-the-dip returns of +10% or greater. This was not such a great sign. There were several false signals mixed in, years when traders' buy-the-dip mentality preceded anxious declines. Across most time frames, the S&P's median return was below random, and risk was higher than reward. There were exceptions, as noted above, but we have to deal with base rates and probabilities.
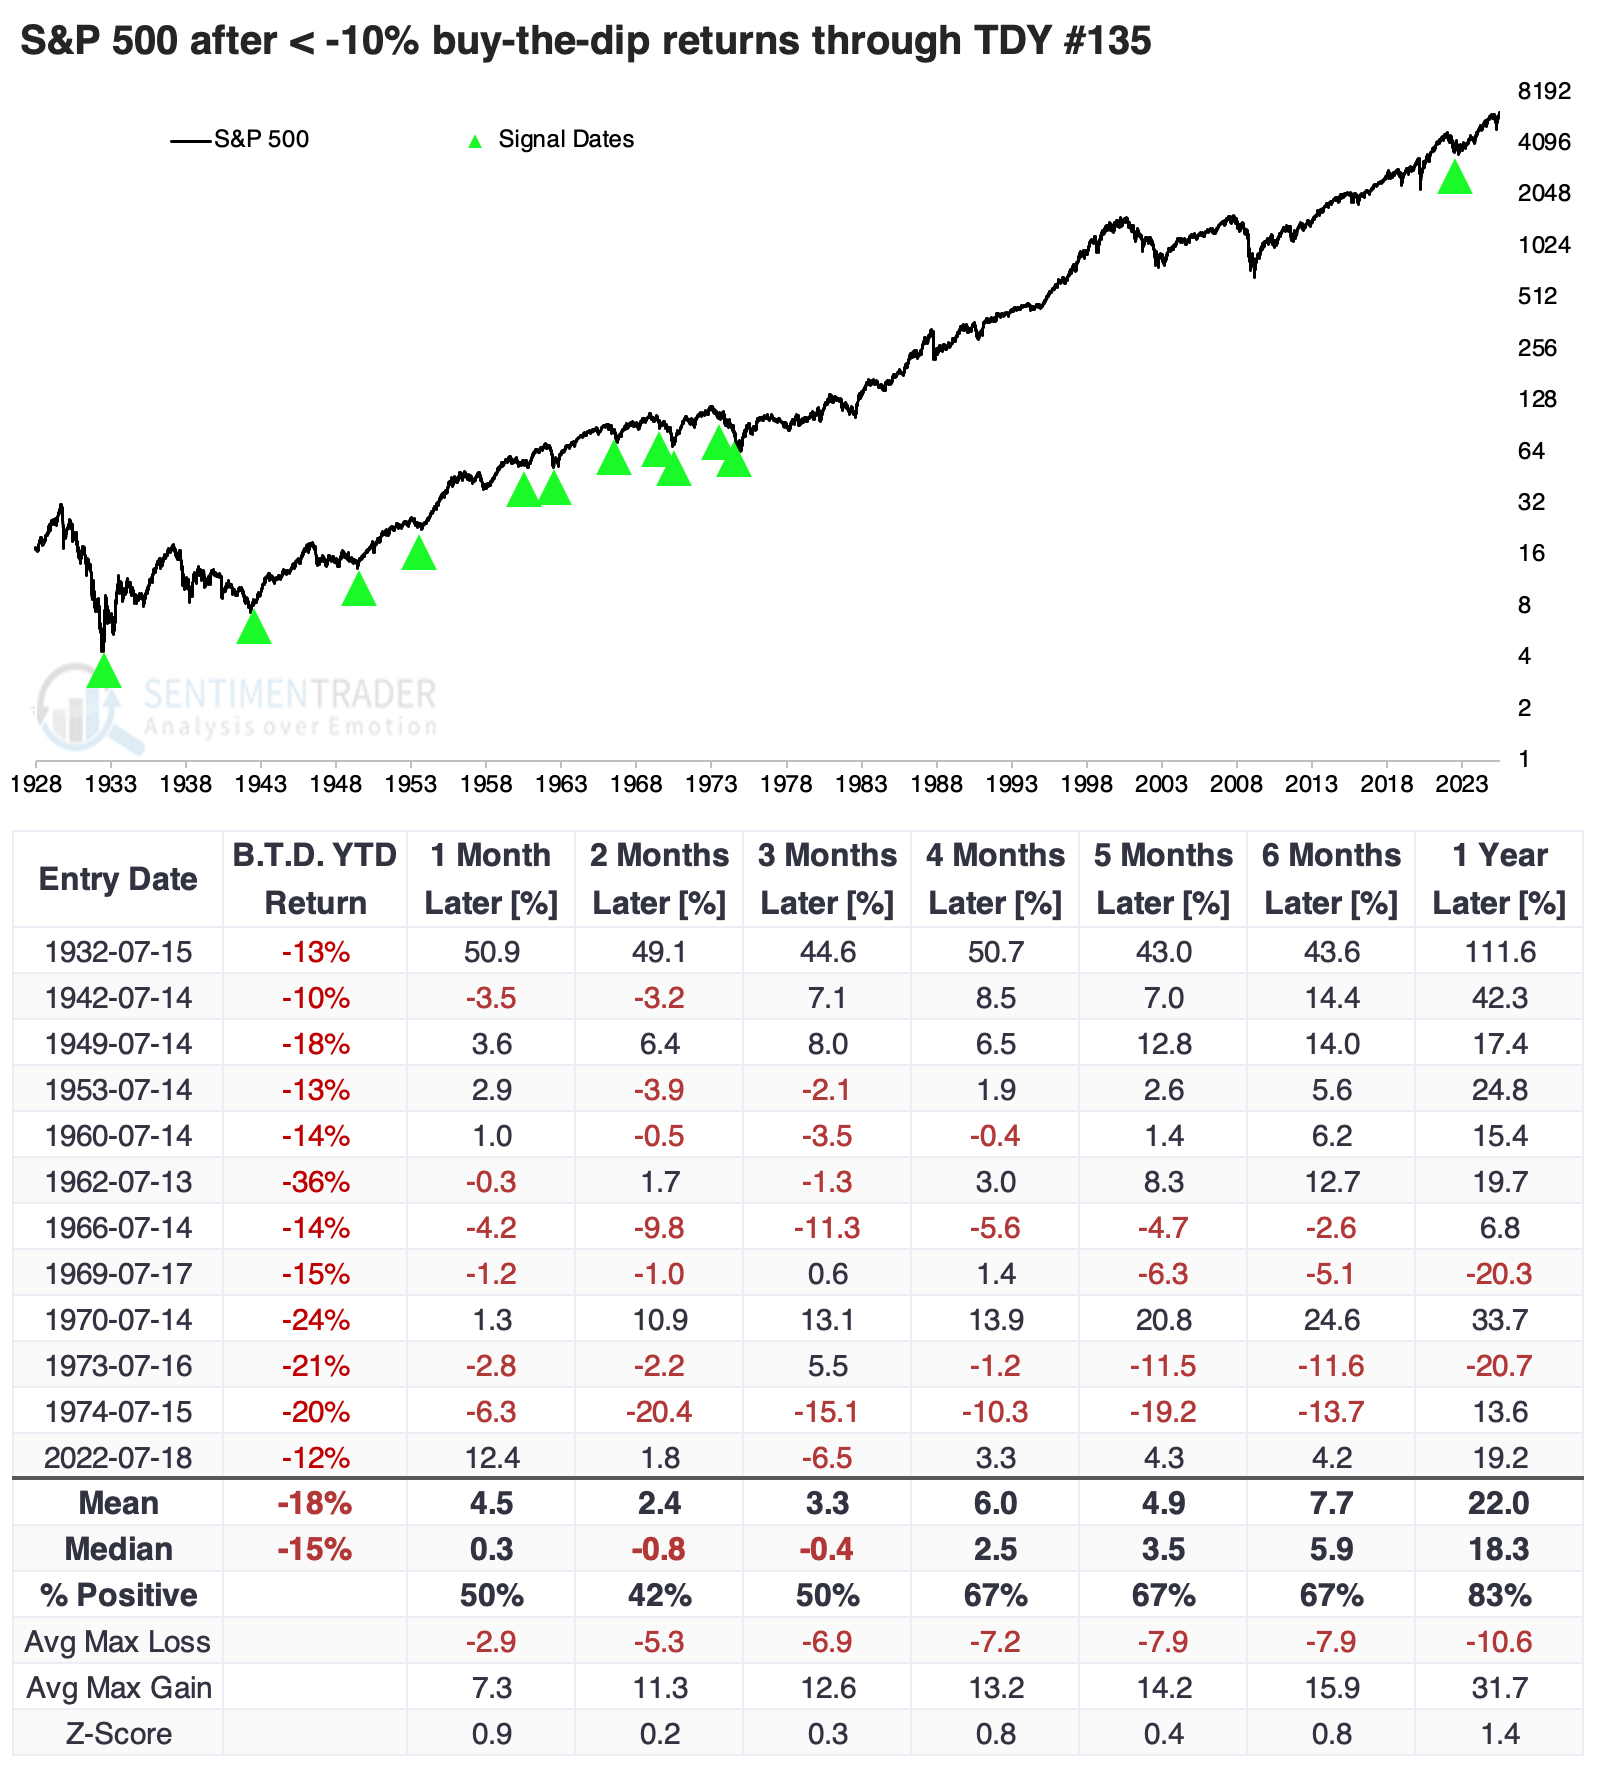
The S&P's counterexamples were mostly negative over the following two months, but showed improved returns over longer time frames. Its risk/reward skew was significantly more positive than the table above, suggesting a more mean-reverting nature. It was somewhat better for investors to buy when traders exhibited less desire to buy the dip during the year's first half.
What the research tells us...
Narrower indices like the tech-dominated Nasdaq 100 can often exhibit trendier behavior. It can go on long runs both ways. That's why we frequently see periods of positive momentum leading to positive returns, and vice versa.
Broader indices tend to be more mean-reverting, with periods of momentum preceding poorer-than-random returns and vice versa. We see that phenomenon above, with traders' buy-the-dip behavior through the year's first half. When it's highly positive, like 2025, the Nasdaq 100 tends to do better than when buy-the-dip wasn't a thing. The S&P tended to do worse.
For our current situation, this may be a modest positive for the Nasdaq 100 for the balance of the year, as it can be difficult to shake traders away from a strategy that's been working. For the broader market, it's not necessarily a great sign, and is a small brick in the pile of things to start to be concerned about.