
A generational bout of uncertainty and volatility

Key points:
- The S&P 500's average range over the past week has reached par with the most extreme events in 60 years
- On a longer time frame, the intraday volatility is still historically extreme, in the top 2% of all days
- How investors behave over the following two weeks has been an excellent signal for longer-term opportunities
Historic swings
For younger investors, even some not-so-young, this is their "I lived through that" moment. Over the past week, the equity index with the most riding on it has been as volatile as the most significant crises in 60 years.
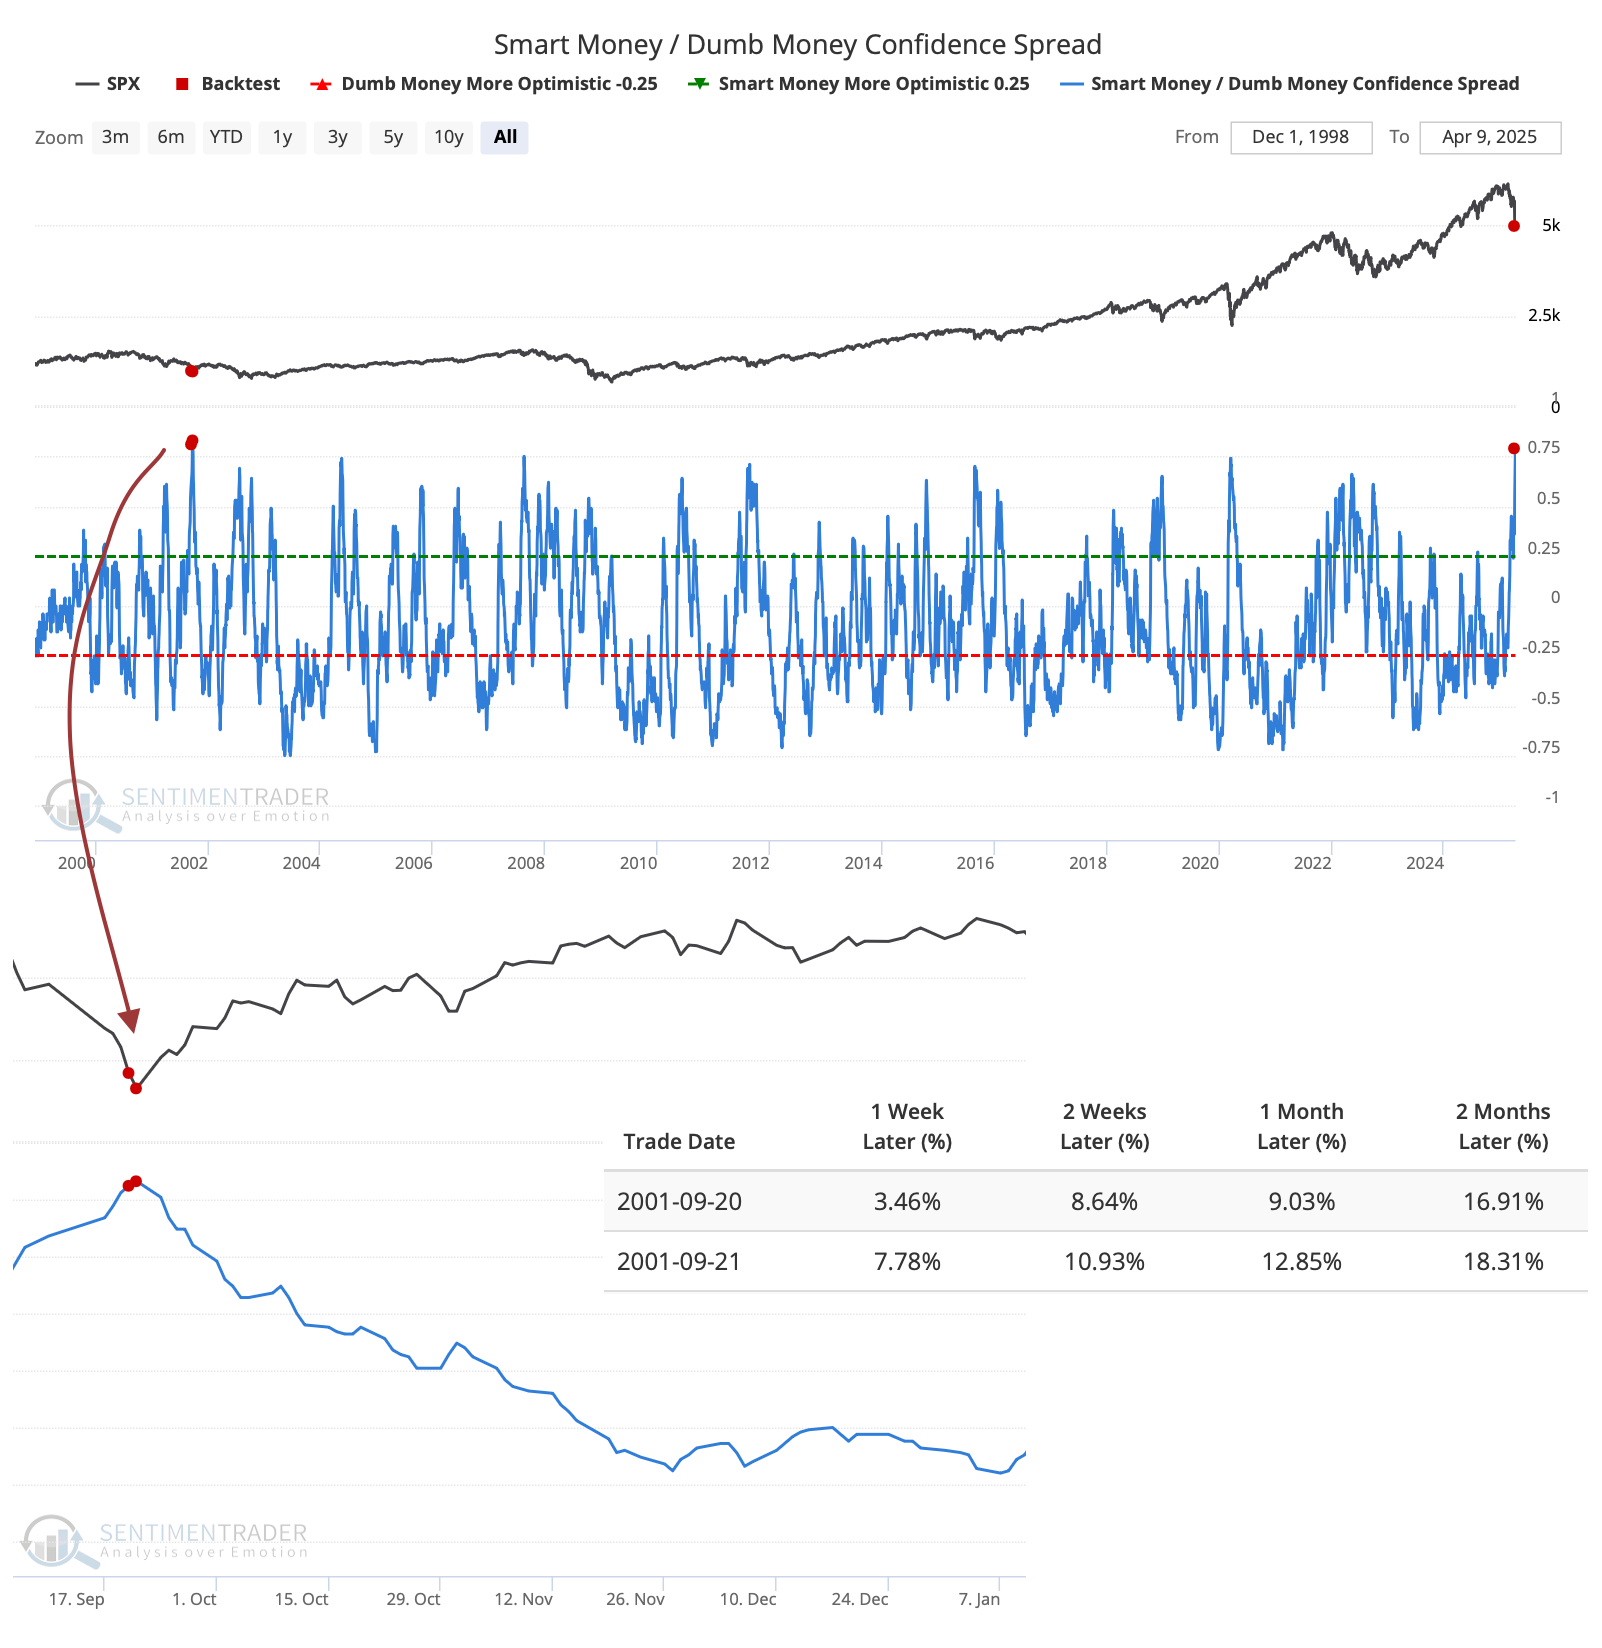
Volatility breeds uncertainty, and uncertainty gives birth to pessimism. Over the past few days, Dumb Money Confidence, in a sustained rally, has plunged, while Smart Money Confidence has jumped. The spread between them is now the second-most positive since SentimenTrader began calculating these models in 1998. The only wider spread was after markets opened following the 9/11 attack.
We rarely reference technical indicators, but Average True Range (ATR) is one of them. It measures each day's range, taking the maximum value based on High, Low, and Close values. It then creates a relative value by dividing it by the closing price and averages it over a given number of days.
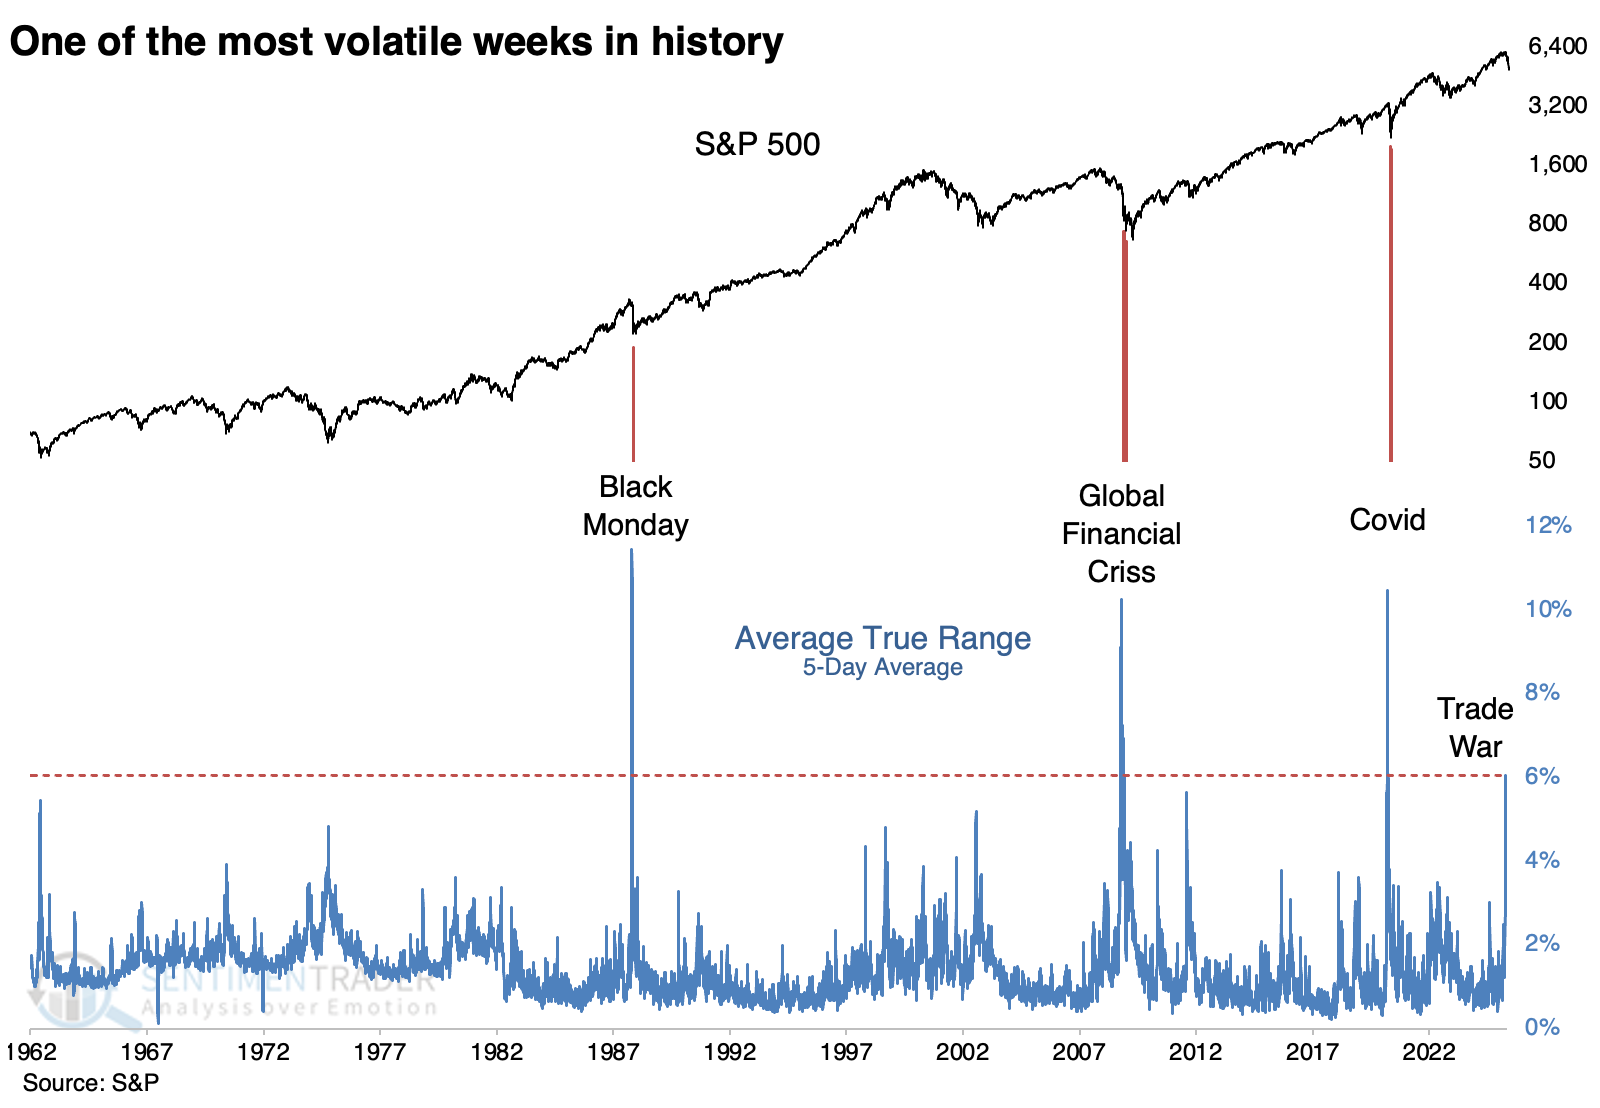
If we use a 5-day average for the S&P 500, the current value just spiked above 6% for only the fourth time since 1962, when our intraday data begins. The others were October 1987 (Black Monday crash), October and November 2008 (Global Financial Crisis), and March 2020 (Covid shutdowns).
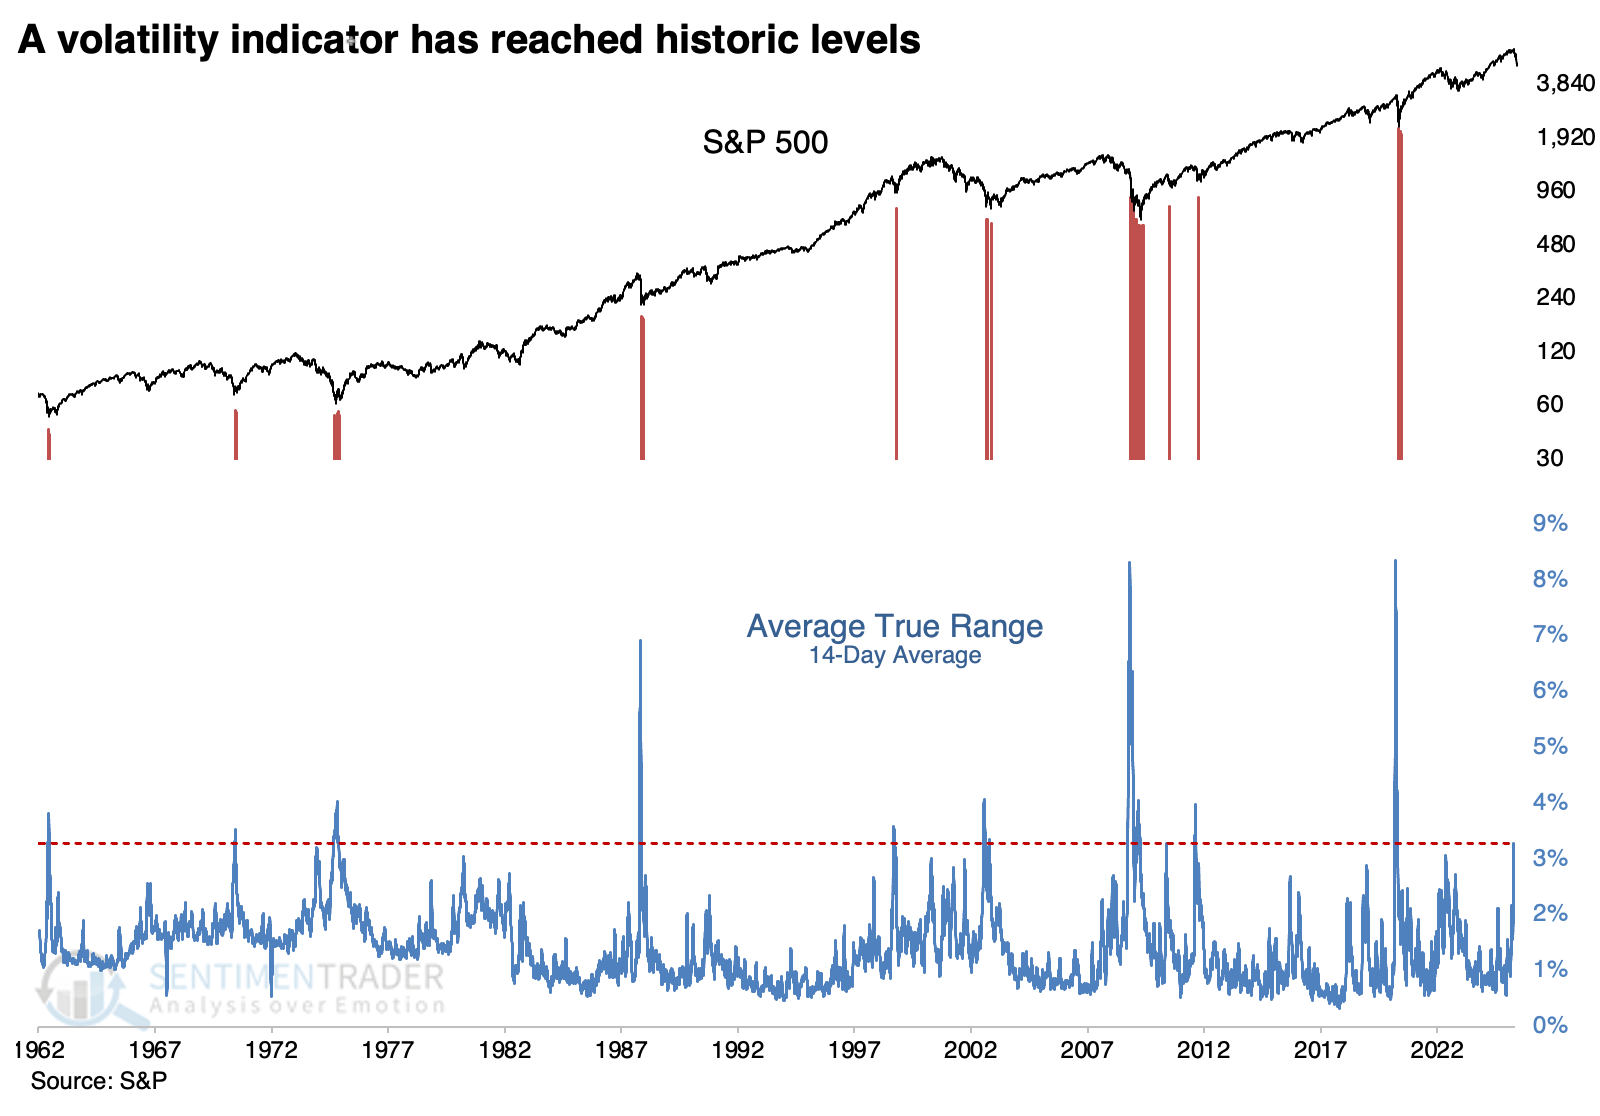
A week isn't a very long, and a 5-day average is atypical for this indicator. The default value is 14 days, so we'll use that. Over that long of a lookback, the S&P's ATR is half as large, just over 3%. It still ranks in the top 2% of all days since 1962.
An opportunity, depending on the coming weeks
When the ATR spiked above 3% for the first time in a couple of years, it would be shocking to investors who had gotten used to a lengthy calm period. Mostly, they took this as an opportunity, with the S&P rising 6 out of 8 times during the following three months and one year.
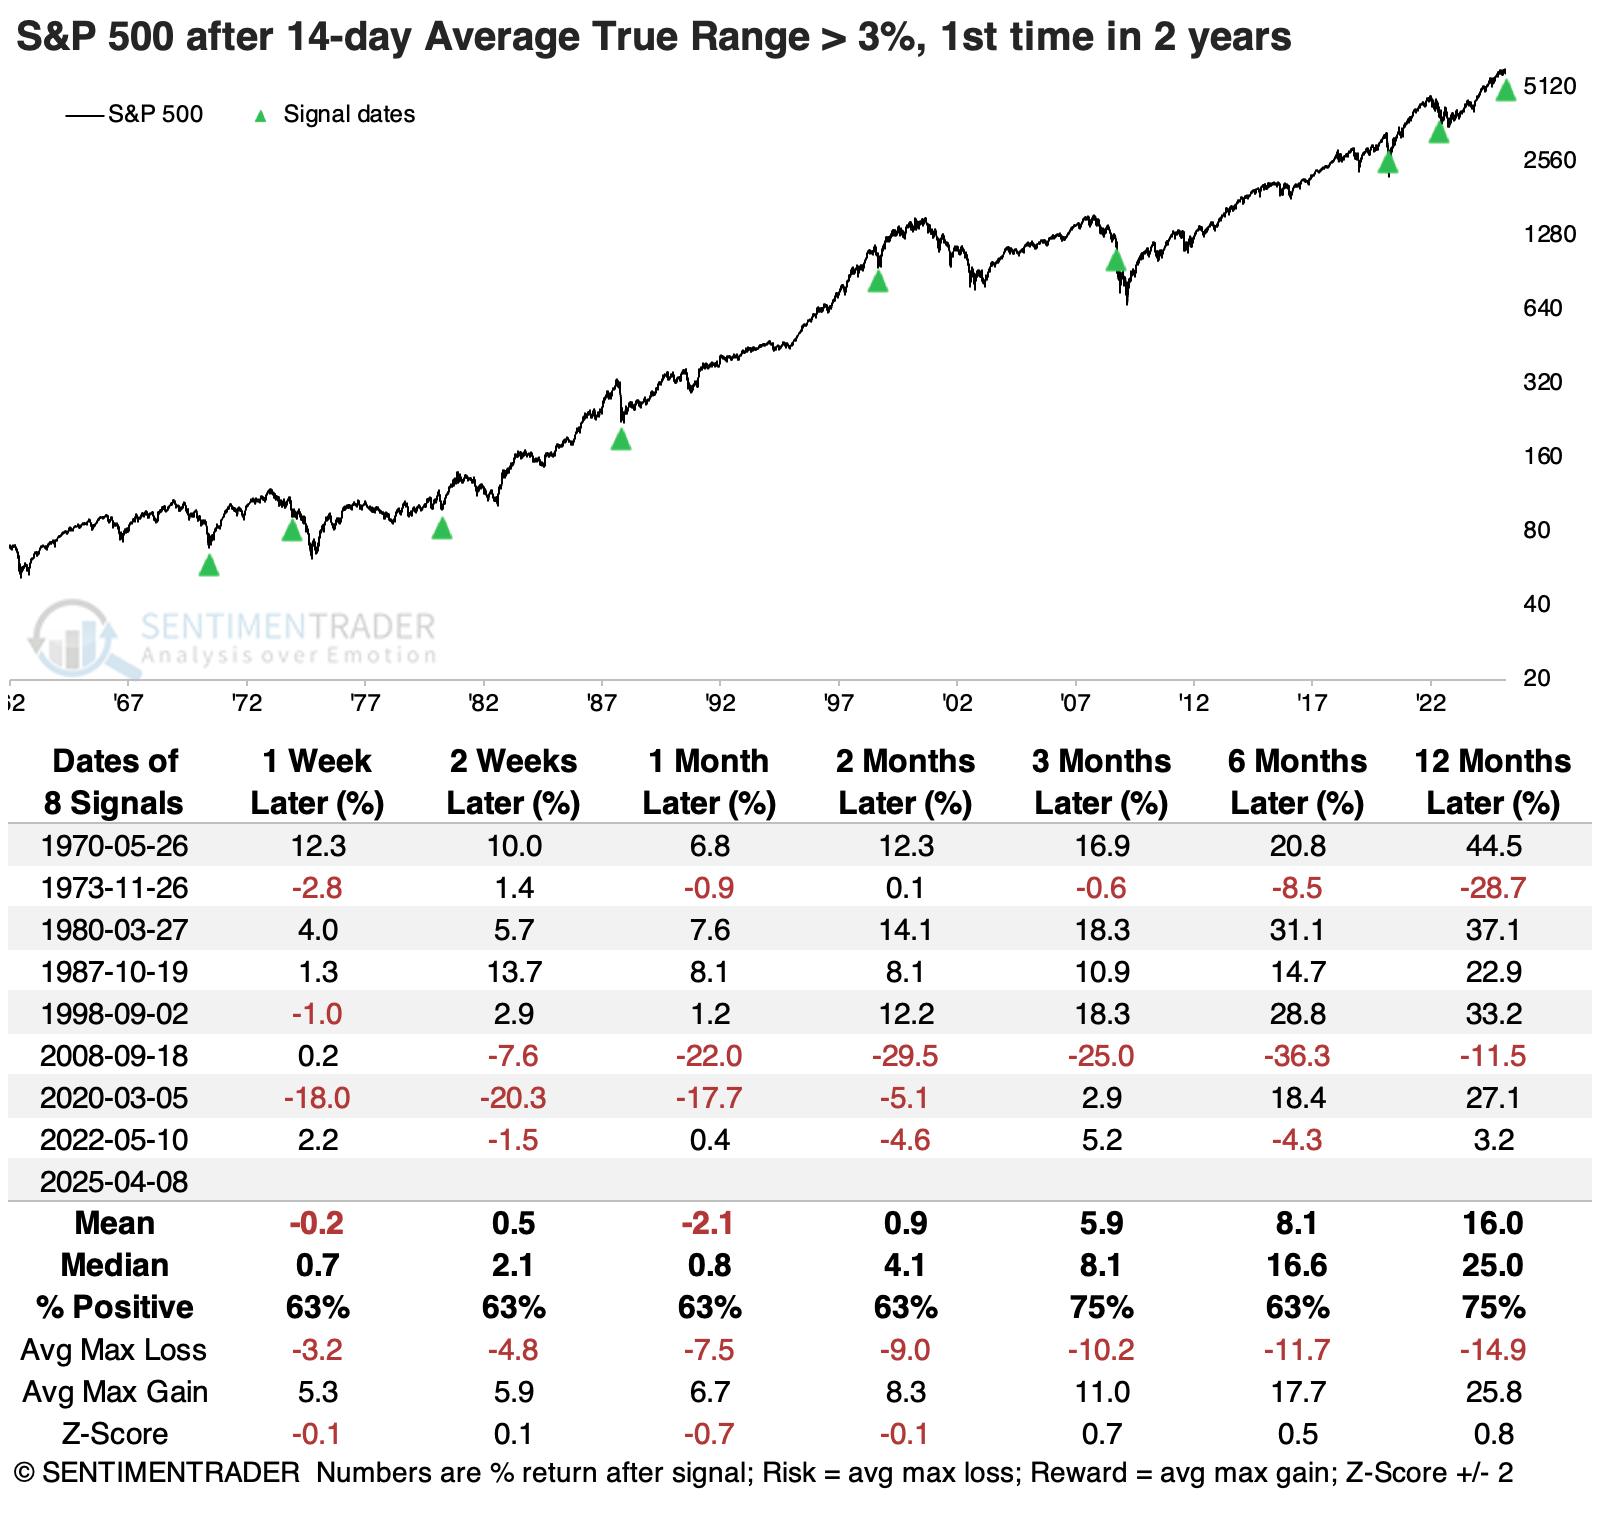
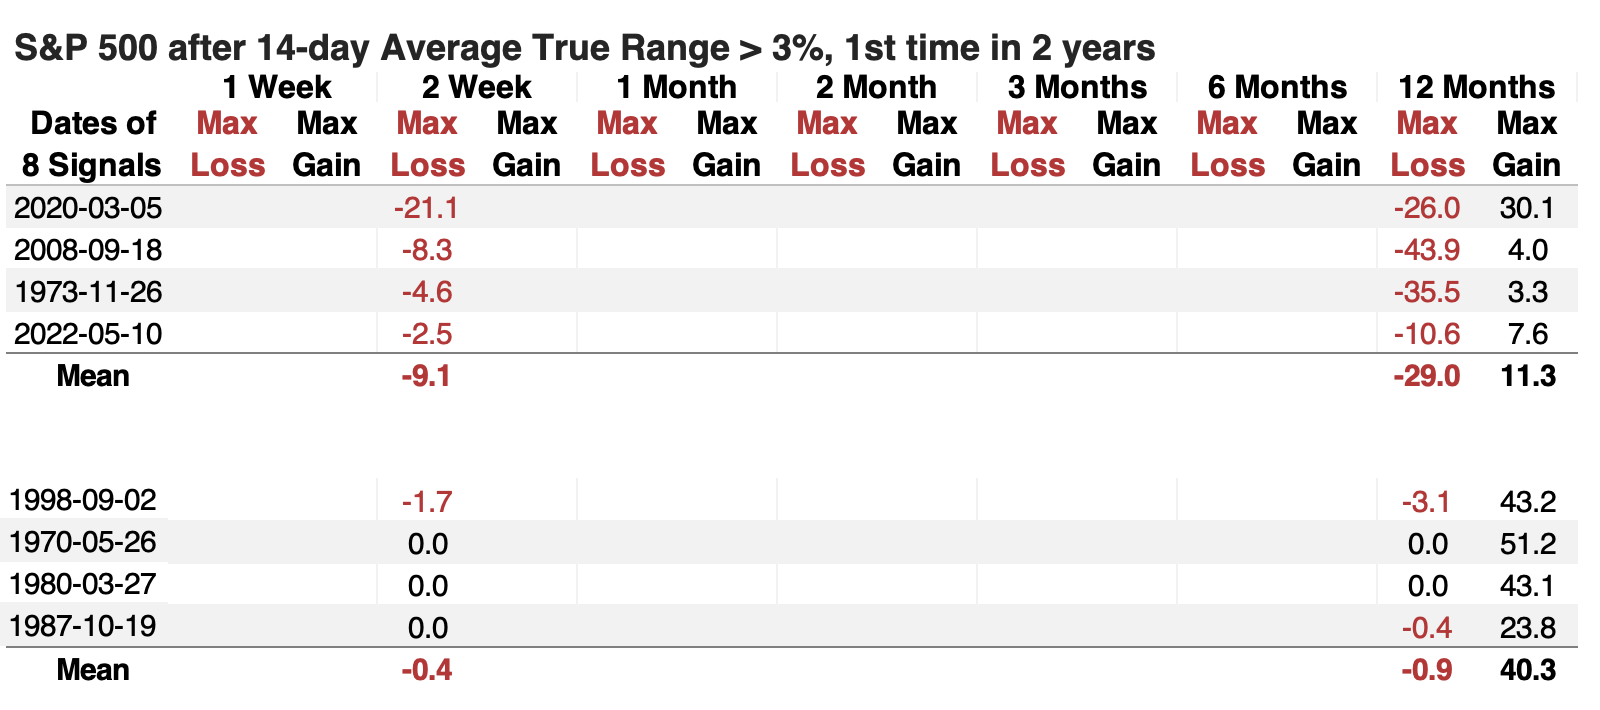
Some hefty losses were mixed in there, though, and that's a problem. Instead of showing all the numbers in the table of maximum gains and losses across time frames, let's simplify it by what may be the most important tell - how buyers reacted over the next couple of weeks.
The table below shows the S&P 500's maximum loss over the next two weeks and its maximum loss and gain over the next year. It's sorted by the two-week max loss. The four instances with more than a -2% drawdown are grouped together, and we can see that those did not turn out well in the long term. Over the following year, they suffered an average drawdown of -29% and average drawup (maximum gain) of only +11%.
Compare that to the signals when investors stepped up right away. When the two-week drawdown was smaller than -2%, the average drawdown over the following year was negligible, while the maximum gain averaged +40%.
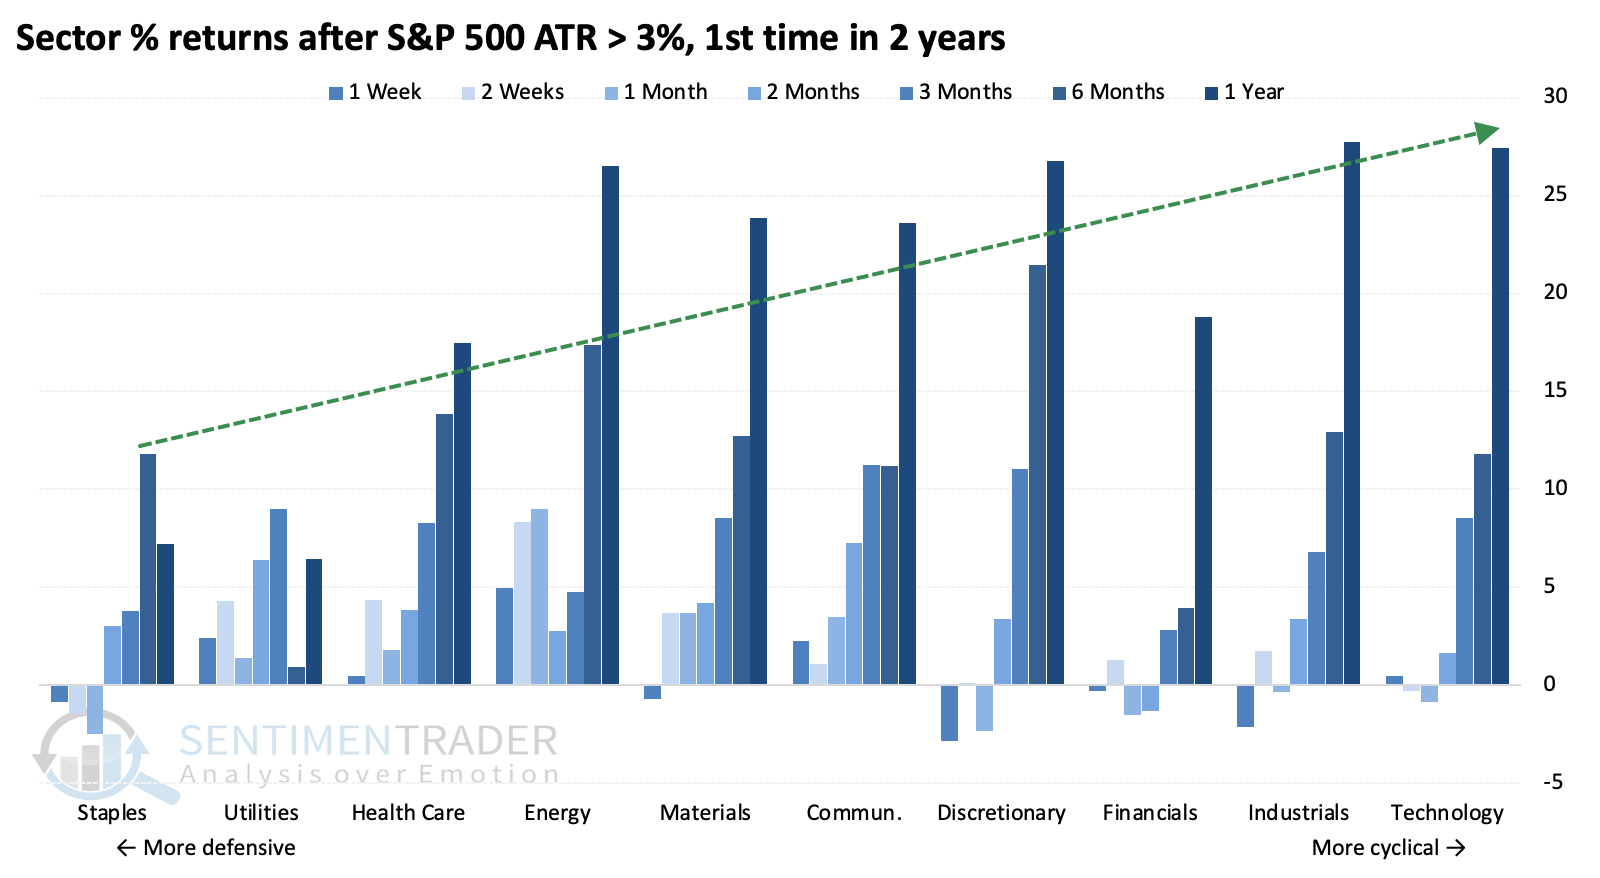
Several times earlier this year, we showed that given conditions at the time, defensive sectors had the best and most consistently positive average return over most time frames. That's starting to change, with the extreme volatility and pessimism now evident. After spikes in the S&P 500's Average True Range, average returns across sectors tended to increase with the sector's cyclicality.
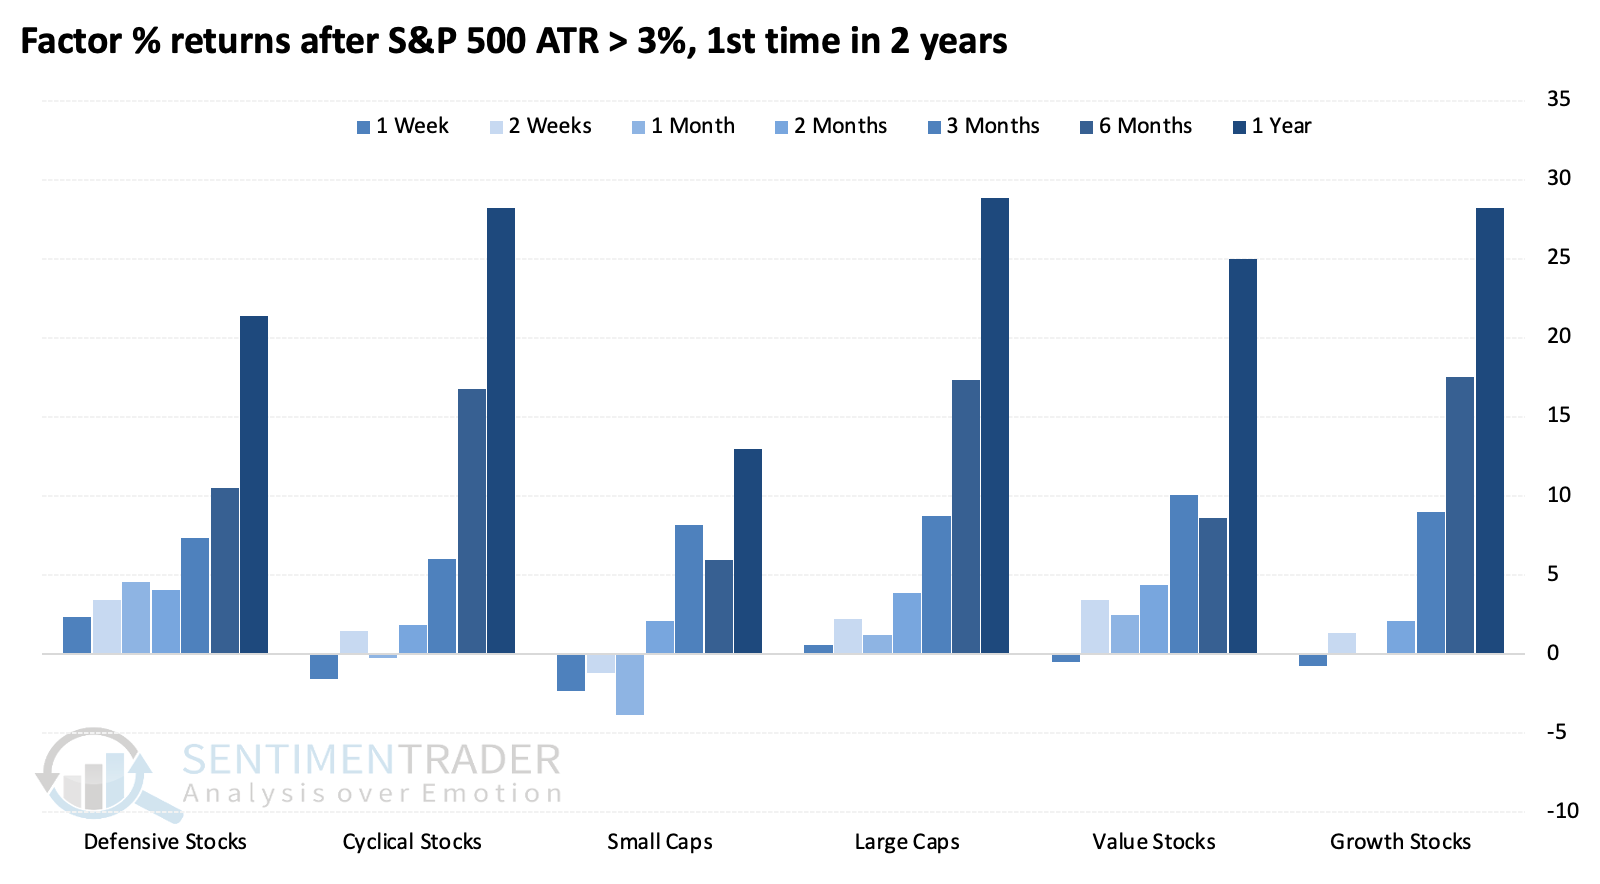
There wasn't much difference among factors, though lowly small-caps were the laggards across most time frames.
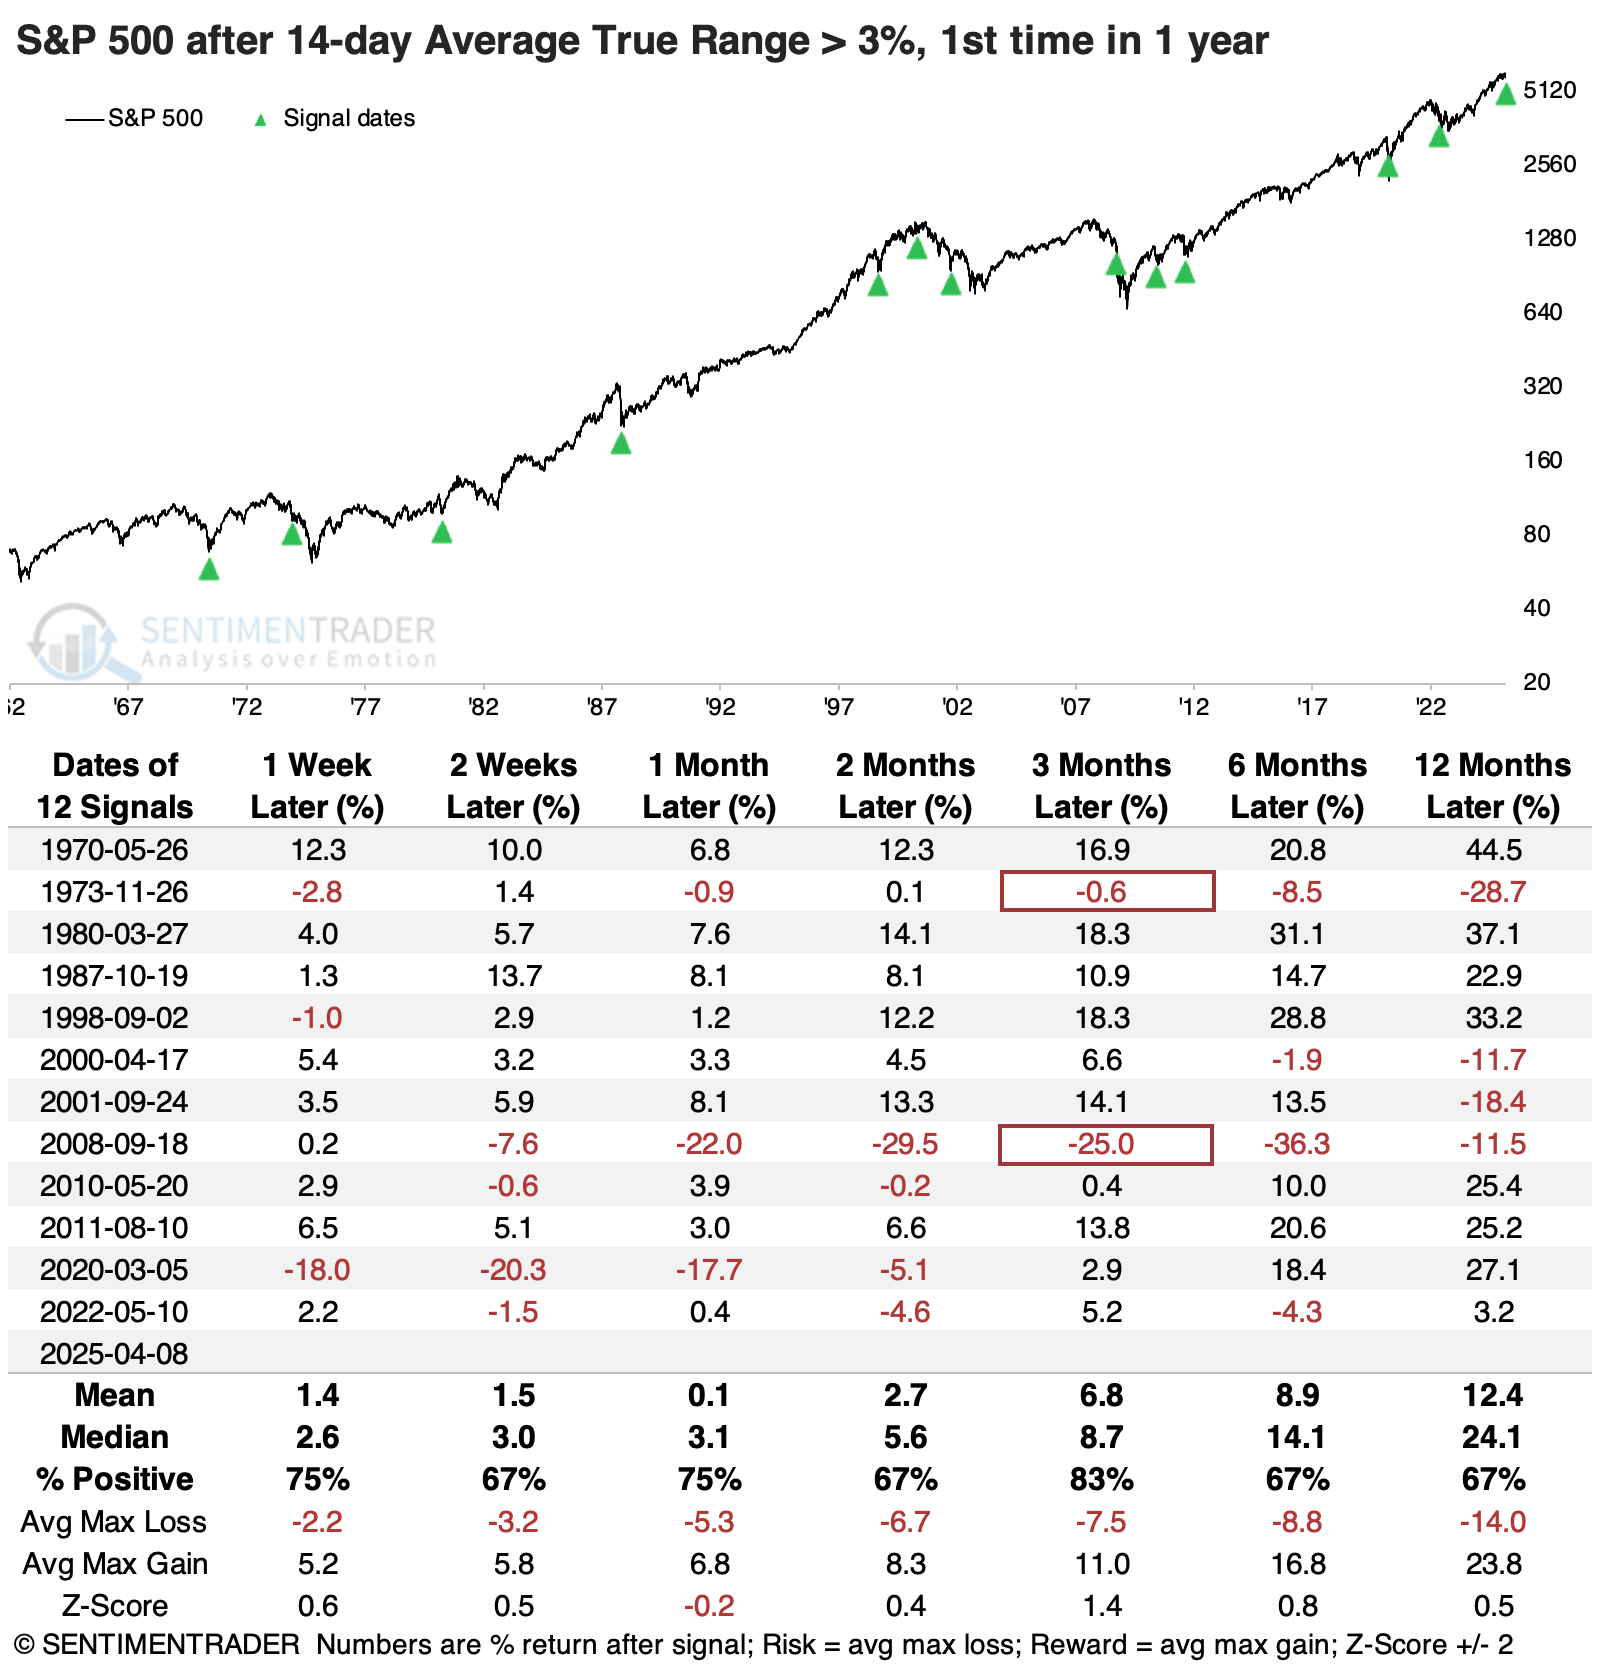
The implications don't change if we relax the ATR threshold to generate a large sample size. If we look for times when it exceeded 3% for the first time in one year (instead of two years), we add a handful of signals. Over the following three months, the S&P 500 suffered only two losses, one of which was minuscule (but quickly turned sour).
What the research tells us...
Chaos generally presents an opportunity, and we're likely on the cusp of one now. Whether it's an opportunity for bulls or bears is the question, and most of what we've looked at doesn't give a clear suggestion just yet. While similar extremes have generally shown good-to-great average returns over three months and longer, there has often been short-term volatility, which can easily scare out even the most ardent bull.
When we see behavior like this, stocks often undergo days with extreme two-sided volatility, as was evident on Tuesday. There will be sickening declines when it seems all is lost and euphoric rallies when it seems the coast is clear. Investors bail on the down days and rush in on the good ones. When all is said and done, there is most often a multi-day or even multi-week rally, volatility recedes, then reality hits once again, and the low is tested. If there is a positive breadth thrust after that, it has been the lowest-risk and highest-reward entry for patient investors.