
A four sector summer portfolio

Key Points
- Overall stock market performance during the summer months of May through August tends to be less robust than in the winter into spring months
- A simple four sector portfolio has demonstrated relatively consistent performance for over 90 years
- The portfolio can be emulated using ETFs
- However, results can vary widely on a year-to-year basis
The four sector portfolio
The following test involves holding the S&P 500 Index sectors listed below each year only during May through August:
- Consumer Staples
- Utilities
- Health Care
- Real Estate
On the last trading day of April each year, the portfolio is split equally among these four sectors and held through the end of August.
The data
We will use monthly total return data for the four sectors listed above. The data series for each uses the Fama French database from 1927 through 1989 and then the S&P 500 Index sector data.
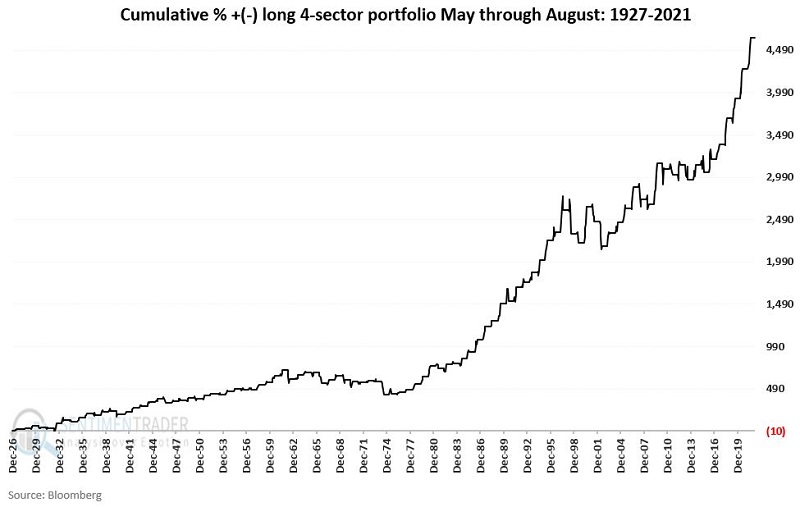
The results
The chart below displays the hypothetical cumulative % growth achieved by holding the four sectors listed above only during May through August from 1927 through 2021. No gain or loss is assumed from September through April for this test.
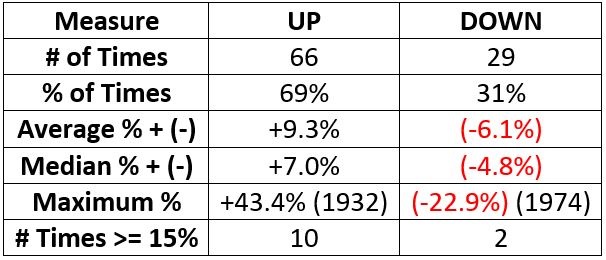
The table below displays a summary of annual results.
Using ETFs
This strategy can be emulated using the following ETFs:
- XLP (Consumer Staples Select Sector SPDR Fund)
- XLU (Utilities Select Sector SPDR Fund)
- XLV (Health Care Select Sector SPDR Fund)
- XLRE (The Real Estate Select Sector SPDR Fund)
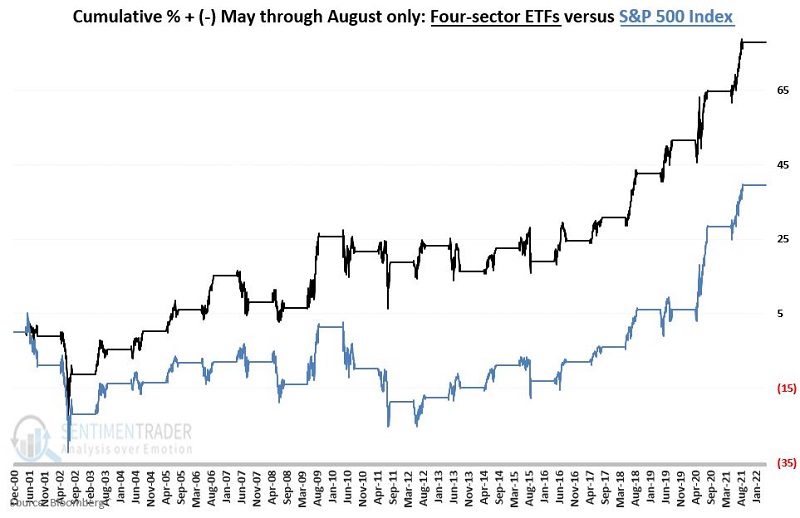
We will begin our test in 2001. Note that ticker XLRE did not start trading until mid-2015. So for 2001 through 2015, we will substitute ticker IYR (iShares US Real Estate ETF) in its place. We use XLRE to represent the real estate sector starting in 2016.
NOTE: The results highlight performance only during May through August. During the rest of each year, no profit or loss is accumulated.
The chart below displays the cumulative % +(-) for the four sector ETF portfolio held only during May through August versus the S&P 500 Index held only during May through August from 2001 through 2021.
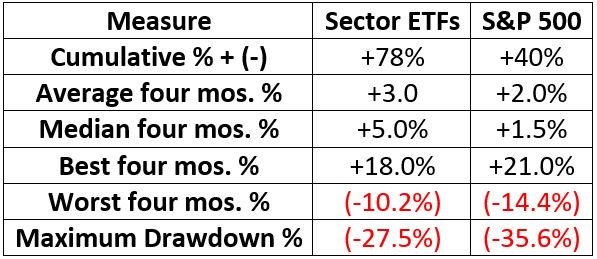
The table below displays some comparative results.
What the research tells us…
For real-world implementation, this strategy requires a high degree of patience and discipline on the part of the investor. While the long-term results display a substantial degree of consistency and have outperformed buying and holding the S&P 500 Index over an extended time, on a year-to-year or even multi-year basis, extended periods of flat to negative results appear inevitable. There is also the not small matter of deciding what to hold during all other months (a topic for another day, perhaps). This reminds us once again about the need for steadfast discipline on the part of the investor.