
A few storm clouds gather on the horizon

Key points
- The stock market remains constructive on a trend-following basis
- However, some potential warning signs have recently flashed
- These signs do not necessarily scream "Sell Everything," but they do suggest that investors review their contingency plans and not assume that everything is "smooth sailing" for stocks
The Nasdaq Titanic Syndrome indicator is flashing yellow
Bill Omaha created the Titanic Syndrome in the 1960s. It highlights a technical market condition when stocks have recently been at a high, and then there is a sudden jump in new 52-week lows versus highs on the Nasdaq. For our purposes, we use the following conditions: 1) The Nasdaq 100 closed at a 52-week high at some point in the past seven sessions, and 2) New 52-week lows outnumber 52-week highs on the Nasdaq. It is a warning sign that typically precedes trouble over the next 1-3 months.
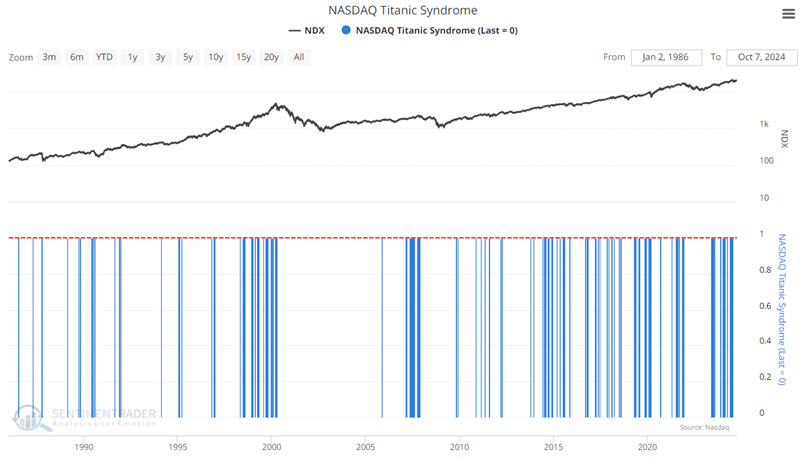
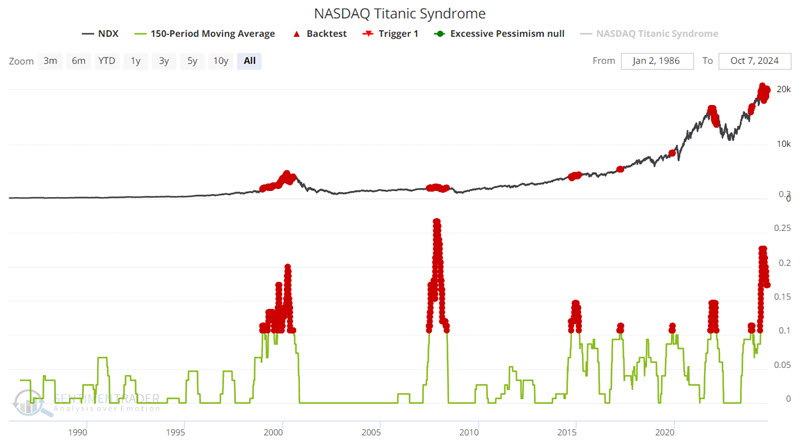
The chart below highlights all dates when the 150-day moving average of the Nasdaq Titanic Syndrome indicator was above 0.10.
The table below summarizes subsequent performance for the Nasdaq 100 Index.
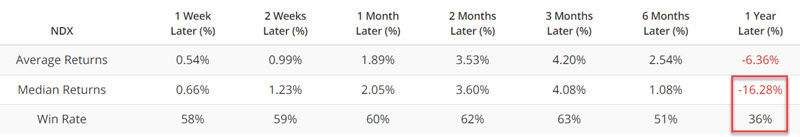
This is not a "precision timing tool," as median returns for up to six months are positive, and the Win Rate is above 50%. However, 1) these returns and Win Rates are below average, and 2) the median 12-month return and Win Rate of -16.28% and 36%, respectively, is an important red flag warning to investors.
A potentially more stark warning sign appears if we highlight only those dates when the 150-day moving average crossed above 0.20, as shown in the chart and table below.
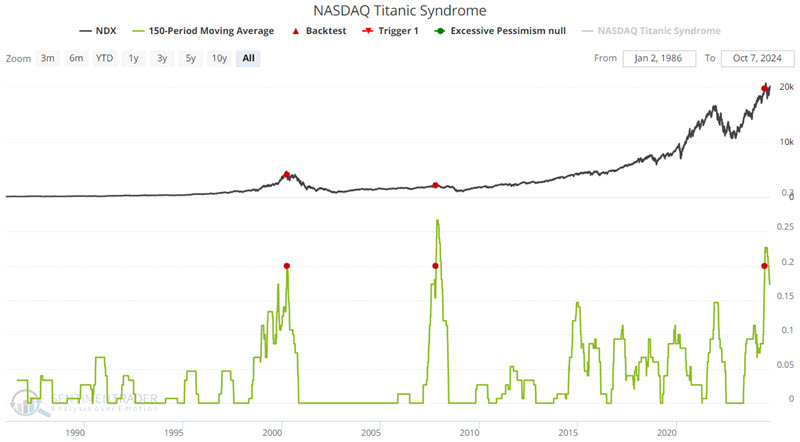
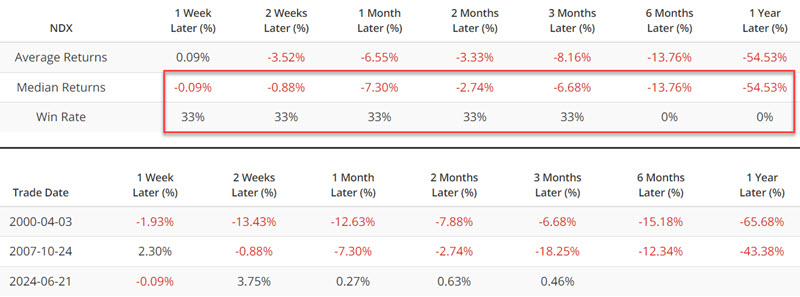
The first two signals - in 2000 and 2007 - were followed by devastating bear markets. The most recent signal was on 2024-06-21. Since that time, the Nasdaq 100 has been up roughly 0.50%. While it might be tempting for someone with an already bearish outlook to shout, "The sky is falling," the obvious caveat is the minuscule sample size.
The Nasdaq High/Low Logic suggests some churning in the market
The HiLo Logic Index was created by Norman Fosback in 1979. Intended to observe "split" market conditions, it looks for times when there are both a large number of 52-week highs AND 52-week lows among securities on the exchange. When there are a lot of both, the market is severely split between winners and losers, and it tends to be a negative for stocks. In other words, a high reading suggests some "churning" in the market rather than a broad, uniform advance. When there is a very low number, then the market is heavily one-sided, which tends to be a positive for stocks.
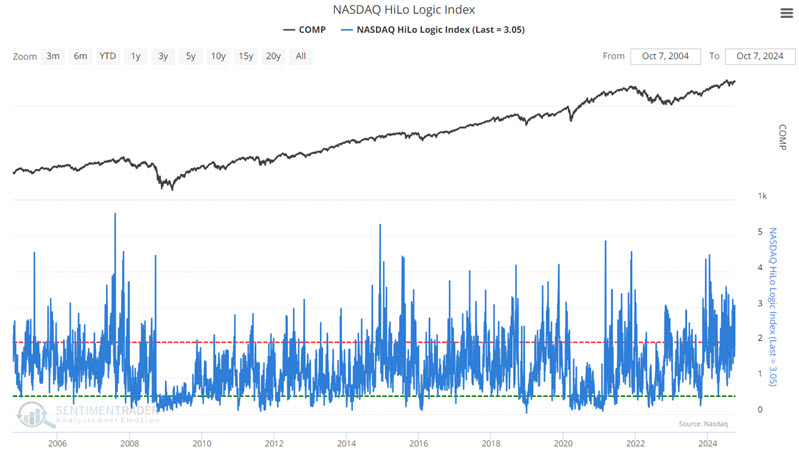
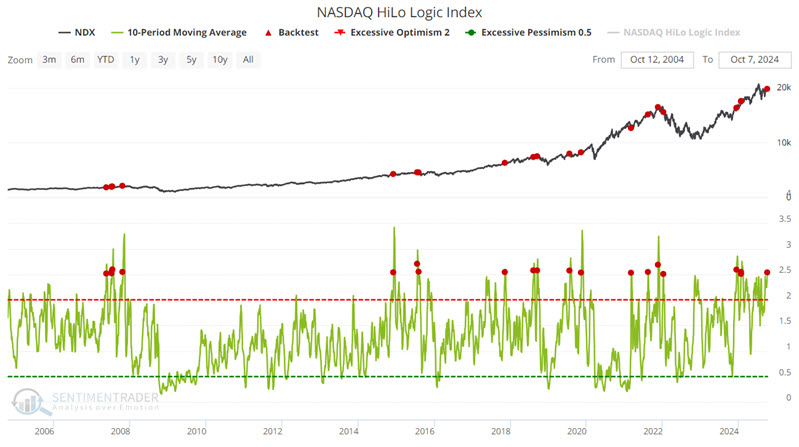
The indicator is traditionally interpreted over a longer time frame, so we suggest viewing it with a 10-day moving average. The chart below highlights all dates when the 10-day moving average of the Nasdaq HiLo Logic Index crossed above 2.5.
The tables below summarize subsequent performance for the Nasdaq 100 Index and signal-by-signal results.
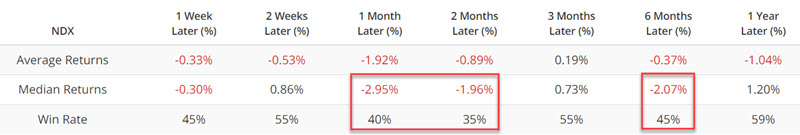
Once again, this signal (which occurred most recently on 2024-10-02) does not constitute an "automatic" sell signal. However, the generally subpar market results following signals should be noted.
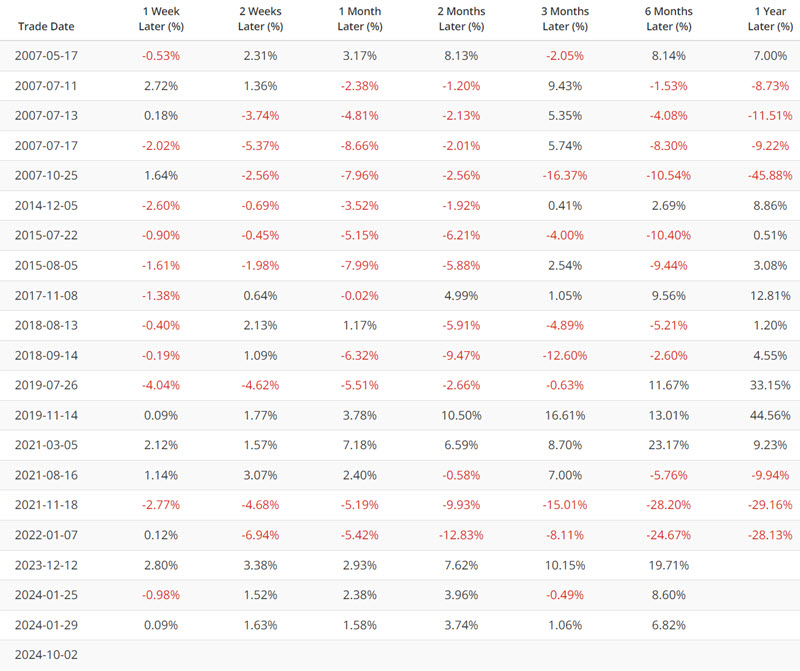
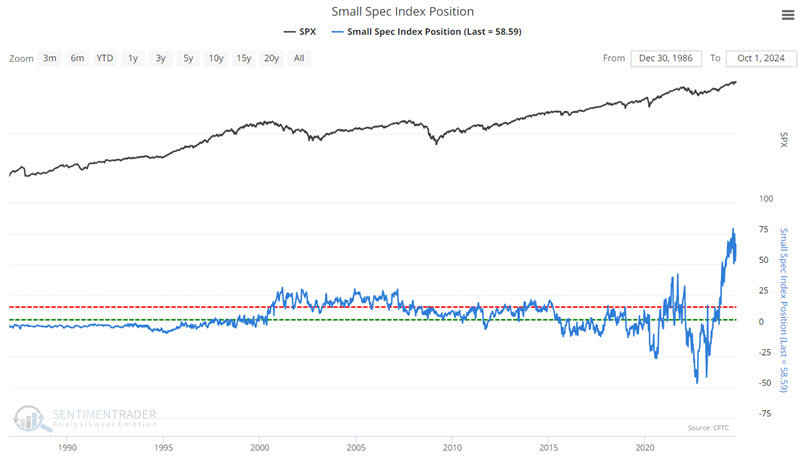
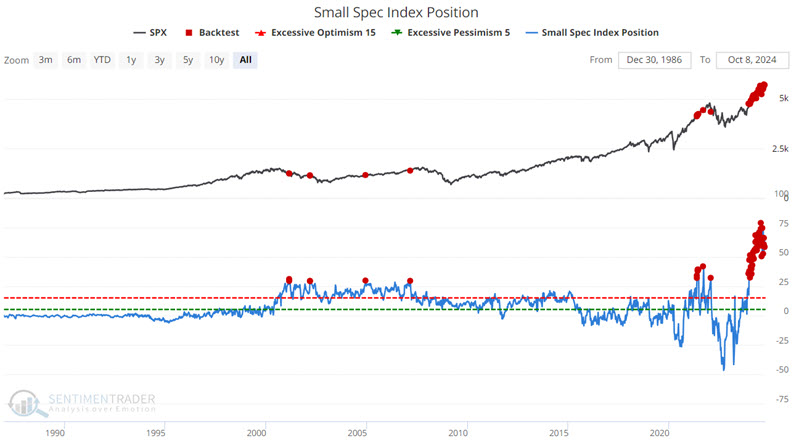
Small Spec Index Position recently went "off the charts."
This shows the net position of small (nonreportable) traders in S&P 500, Nasdaq 100, and DJIA index futures, full contract, and e-mini, adjusted for position size and index value, shown in billions of dollars. As you can see in the chart below, this index recently spiked to an unprecedented level. While this seems like a significant development, it is important not to read too much into it and to use it as "weight of the evidence" and not as a standalone system,
The chart below highlights all dates when the Small Spec Index Position indicator is above 29.
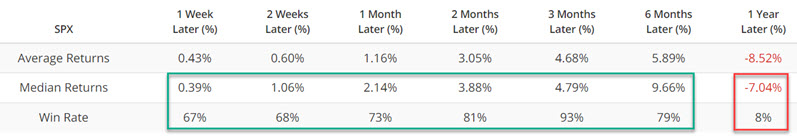
The table below summarizes subsequent performance for the S&P 500 Index. Note the slightly bizarre nature of the results - a 93% Win Rate after three months and only an 8% Win Rate after twelve months.
What the research tells us…
None of the above signals constitute an outright "sell" signal (at least in this author's market-addled opinion). But they remind us of the old adage, "Hope for the best, prepare for the worst." As long as the major market indexes hold above their longer-term moving averages, indicator signals like the above are more "alerts" than "warnings." But if things start to break down, investors might be wise to have some contingency plans already in place to reduce risk.
It is also worth noting:
Jay's Trading Maxim #147: As the market rises, look for things that question your bullishness, NOT for things that confirm it.