Products
SentimenTrader Trading Tools
‍
Backtest Engine
My Trading Toolkit
Correlation Analysis
Seasonality
Market Prediction
Indicators & Data API
‍
Proprietary Indicators & Charts
Market Data API
Strategies & Scanner
‍
50+ Trading Strategies
Smart Stock Scanner
Smart Option Scanner
Research Reports
‍
Research Solutions
Reports Library
Free Resources
Simple Backtest Calculator
Simple Seasonality Calculator
The Kelly Criterion Calculator
Sentiment Geo Map
Public Research Reports
Education
Sentiment Indicators
Technical Indicators
Pricing
Company
About
In the News
Testimonials
Client Success Stories
Contact
Log inLoginSign up
< BACK TO ALL REPORTS

A Few More Hopeful Indicator Signals

Jay Kaeppel
2026-04-09
The stock market is struggling of late to hold on to an uptrend. Recent signals from a variety of indicators - including breadth, crude relative to gold, and consumer confidence - offer hope to stock market bulls that things can still play out to the upside. Details herein.

Key points:

  • The character of the market changed recently, with several breadth, interest rate, and price action warnings
  • Nevertheless, as long as the major indexes hold above their longer-term averages, investors and traders can look for favorable indicator signals
  • Recent favorable signals have been flashed by industry group action, crude oil relative to gold, and consumer confidence

Industry % in Bear Market hits a key level

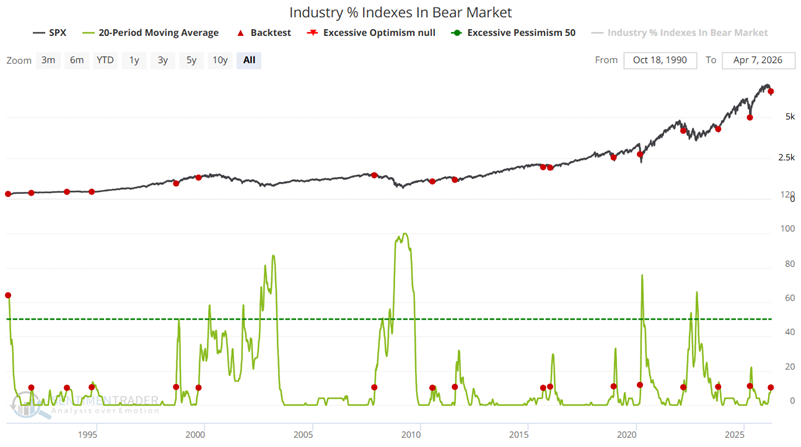
As the name implies, our Industry % in Bear Market indicator shows the percentage of 23 industries that are trading more than 20% below their 52-week highs. This is an important indicator of overall market health. Ironically, a rising trend can represent good news or bad news. When the percentage of industries that are 20% or more below their respective 52-week highs reaches a significant level, it means one of two things. Either a) the overall market is plunging into a broad bear market, or b) a serious intermediate decline may have just about run its course. Unfortunately, there is no way to know for sure which event is taking place solely from this indicator's action. We need confirmation or denial from other indicators, and from watching subsequent price action. Regardless, it is useful to know when this indicator crosses a key level.

The chart below highlights those dates when the 20-period moving average for the Indust

Sorry, you don't have access to this report

Upgrade your subscription plan to get access
Go to Dasboard
PRODUCTS
SentimenTrader
Trading Tools
Indicators & Data API
‍
Strategies & Scanner
‍
Research Reports
FREE
RESOUrCES
Simple Backtest
Calculator
Simple Seasonality
Calculator
The Kelly Criterion
Calculator
Sentiment Geo Map
‍
Public Research Reports
‍
Education
Sentiment Indicators
‍
Technical Indicators
‍
Pricing
Bundle pricing
‍
FAQ
‍
Announcements
‍
COMPANY
‍
About
‍
In the News
‍
Testimonials
‍
Client Success Stories
CONTACT
‍
General Inquiries
‍
Media Inquiries
‍
Financial Professionals Inquiries
‍
© 2026 Sundial Capital Research Inc. All rights reserved.
Setsail Marketing
TermsPrivacyAffiliate Program
Risk Disclosure: The information and tools provided are for research and analytical purposes only and are not intended as investment advice. Market analysis involves uncertainty, and outcomes may differ from expectations. Users should conduct their own due diligence and consider their individual circumstances before making any financial decisions. Past performance is not necessarily indicative of future results.

Hypothetical Performance Disclosure: Hypothetical performance results have many inherent limitations, some of which are described below. No representation is being made that any account will or is likely to achieve profits or losses similar to those shown; in fact, there are frequently sharp differences between hypothetical performance results and the actual results subsequently achieved by any particular trading program. One of the limitations of hypothetical performance results is that they are generally prepared with the benefit of hindsight. In addition, hypothetical trading does not involve financial risk, and no hypothetical trading record can completely account for the impact of financial risk of actual trading. for example, the ability to withstand losses or to adhere to a particular trading program in spite of trading losses are material points which can also adversely affect actual trading results. There are numerous other factors related to the markets in general or to the implementation of any specific trading program which cannot be fully accounted for in the preparation of hypothetical performance results and all which can adversely affect trading results.

Testimonial Disclosure: Testimonials appearing on this website may not be representative of other clients or customers and is not a guarantee of future performance or success.