
A favorable signal from the SKEW Index

Key Points
- The SKEW Index is an indicator designed to measure market risk at any given point in time
- While the index itself has been at an all-time high recently (generally interpreted as unfavorable for stocks), there is an alternative usage
- The rate-of-change in the SKEW Index recently flashed what has historically been a favorable signal for stocks
What is the SKEW Index?
The SKEW Index, calculated and distributed by the Chicago Board Options Exchange, shows the risk of a "black swan" type of event in equities within the next 30 days. Basically, it shows the risk of a swift, sharp drop in prices as determined by options traders in the S&P 500 index. According to the CBOE (see here), when the SKEW is high, options traders are pricing in a higher risk of a sudden decline. When the SKEW is low, traders are relatively sanguine, and the risk of a black swan event is low.
This is NOT a contrary indicator.
Therefore, when the SKEW is high, we should be worried about the probability of a sudden stock decline, and when it is low, we should have more confidence that stocks will rise (or at least not suffer a sharp drop anytime soon).
According to CBOE research, here are the probabilities of a significant move (2 standard deviations) given specific values in the SKEW:
SKEW Value Probability of Large Move
100 2.3%
105 3.7%
110 5.0%
115 6.4%
120 7.7%
125 9.1%
130 10.4%
135 11.8%
140 13.1%
145 14.5%
The chart below displays the history of the SKEW Index, which was first calculated in 1990.
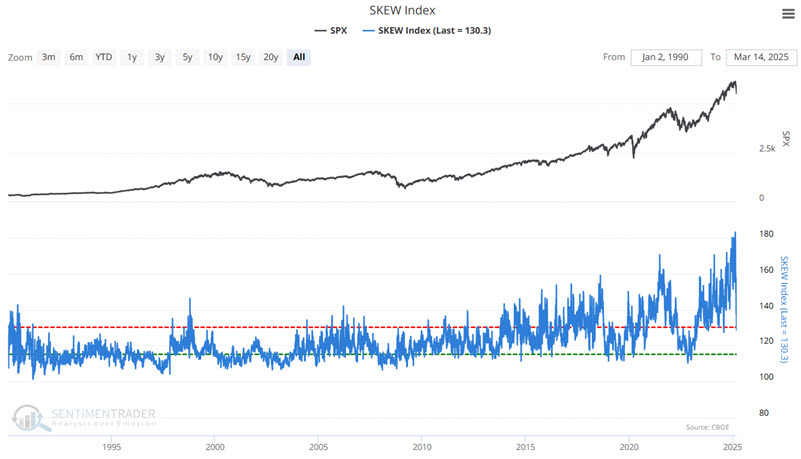
The chart above shows that the index has recently been at record highs, so perhaps we should not have been surprised by the recent sharp selloff in stocks. That said, it is hard to point to specific index levels as automatic buy or sell signals.
A different perspective on the SKEW Index
We will use week-ending data from here for the SKEW Index and the S&P 500 Index. Let's look at the 13-week percentage rate of change in the SKEW Index. The chart below overlays:
- The S&P 500 Index weekly close (black line, scale on the right)
- The 13-week % change in the SKEW Index (blue line, scale right)
- -15% (red line, scale right)
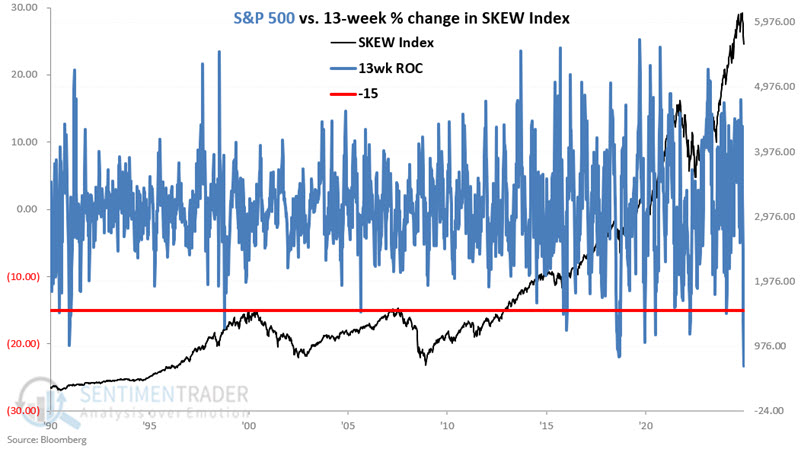
Let's examine the rare occasions when the 13-week % change for the SKEW Index fell to -15% or lower.
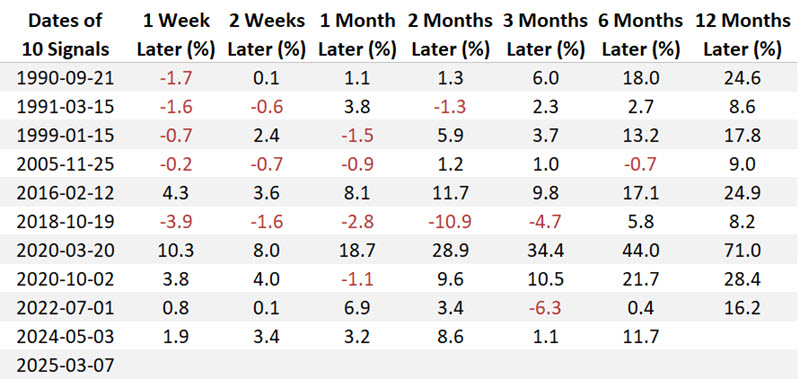
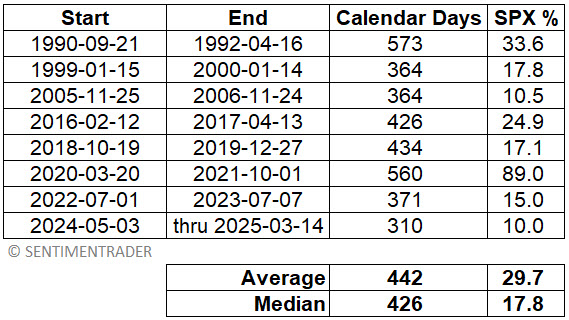
The table below displays the dates when the SKEW Index dropped below -15 and subsequent S&P 500 performance. The most recent signals were 2024-05-03 and 2025-03-07.
The table below summarizes S&P 500 performance following the dates listed in the table above.
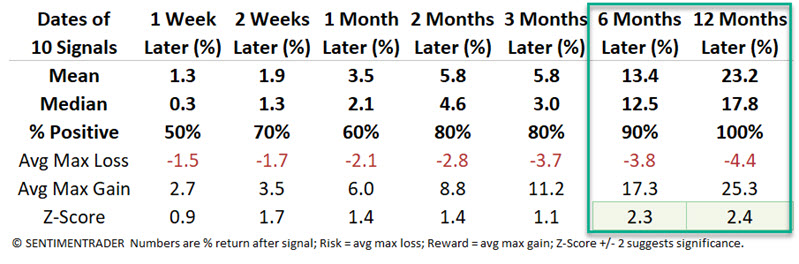
Note the compelling Win Rates, Median Returns, and Z-scores for six and twelve months after signals. While this is just one indicator, and thus more "weight of the evidence" than "proof positive," based on historical results, this interpretation of the SKEW Index falls on the favorable side of the weight of the evidence ledger.
A simple systematic approach
It is not recommended that the SKEW Index be used as a standalone trading signal generator. That said, for purposes of illustration, we will apply a simple rule to create a crude "system."
Rules:
- If the 13-week change for the SKEW Index crosses below -15%, the model is favorable for stocks for 52 weeks
- If during the initial 52 weeks, SKEW crosses back above -15%, then back below -15% again, we will add another 52 weeks to the holding period (i.e., any cross from above -15% to below -15% starts a new 52-week holding period for stocks).
- After 52 weeks since the last signal, the "system" goes to neutral
The chart below displays the hypothetical growth of $1 invested in the S&P 500 using the above rules.
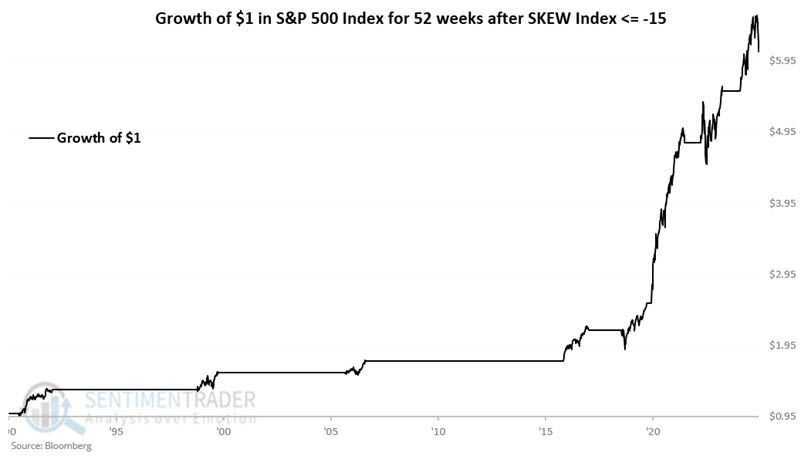
The chart below shows the same result on a logarithmic scale.

The table below summarizes the results using the rules above.
What the research tells us…
So does the recent signal on 2025-03-07 guarantee that the S&P 500 is sure to advance over the next twelve months? Absolutely not. However, the historical results above suggest that longer-term investors continue to give the bullish case the benefit of the doubt.