
A favorable sign from the action of initial public offerings

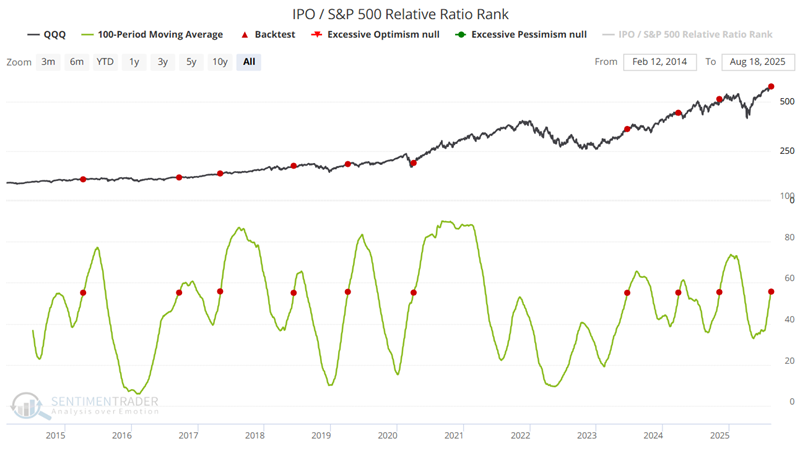
The IPO/SPX Relative Ratio Rank indicator compares initial public offerings to the action of the S&P 500 index. This indicator shows where the ratio is relative to its range over the past four months. When the relative ratio is high, investors are showing risk-on behavior. When the ratio drops to a low level, they exhibit risk-off behavior.
For trading purposes, I look for times when the indicator exhibited risk-off behavior and then swung to the upside. The chart below uses QQQ as the underlying index. It highlights those rare occasions when the 100-day moving average of the IPO/SPX Relative Ratio Rank indicator crossed above 55 for the first time in a month. The most recent signal occurred on August 18th.
The tables below summarize QQQ performance following previous signals.
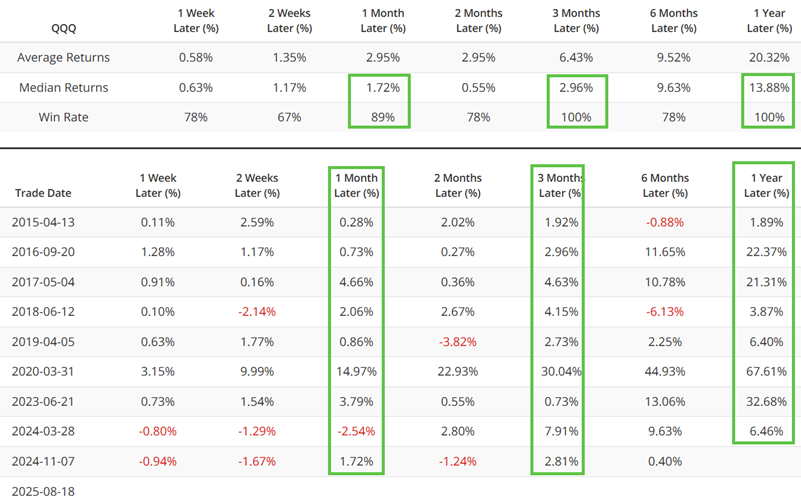
Does the August 18th signal guarantee higher prices for the Nasdaq 100 three and twelve months from now? Not at all. But it does lend weight to the favorable side of the weight of the evidence ledger.