Products
SentimenTrader Trading Tools
‍
Backtest Engine
My Trading Toolkit
Correlation Analysis
Seasonality
Market Prediction
Indicators & Data API
‍
Proprietary Indicators & Charts
Market Data API
Strategies & Scanner
‍
50+ Trading Strategies
Smart Stock Scanner
Smart Option Scanner
Research Reports
‍
Research Solutions
Reports Library
Free Resources
Simple Backtest Calculator
Simple Seasonality Calculator
The Kelly Criterion Calculator
Sentiment Geo Map
Public Research Reports
Education
Sentiment Indicators
Technical Indicators
Pricing
Company
About
In the News
Testimonials
Client Success Stories
Contact
Log inLoginSign up
< BACK TO ALL REPORTS

A favorable short-term period for stocks approaches

Jay Kaeppel
2022-10-26
A favorable period for short-term traders is at hand. This period has seen the S&P 500 Index gain 75% of the time with a median gain/median loss ratio of 2.3-to-1.

Key points:

  • The stock market is entering a short-term positive seasonal window
  • The S&P 500 has rallied 75% of the time during these windows
  • The next period begins at the close on October 27

A favorable period approaches

A month ago, we looked at the upcoming positive seasonality for stocks. Now, let's get a little more granular, as a short-term positive window is also opening.

The period we will examine is the 5-trading day period that extends from the close of the 3rd to the last trading day of October through the close on the 3rd trading day of November.

In plain English, we are talking about being long the S&P 500 Index during the last two trading days of October plus the first three trading days of November. For 2022, this period will extend from the close on October 27 through the close on November 3.

A compelling history

The chart below displays the cumulative percentage growth for the S&P 500 Index (price only) every year during the five days described above, starting in 1949.

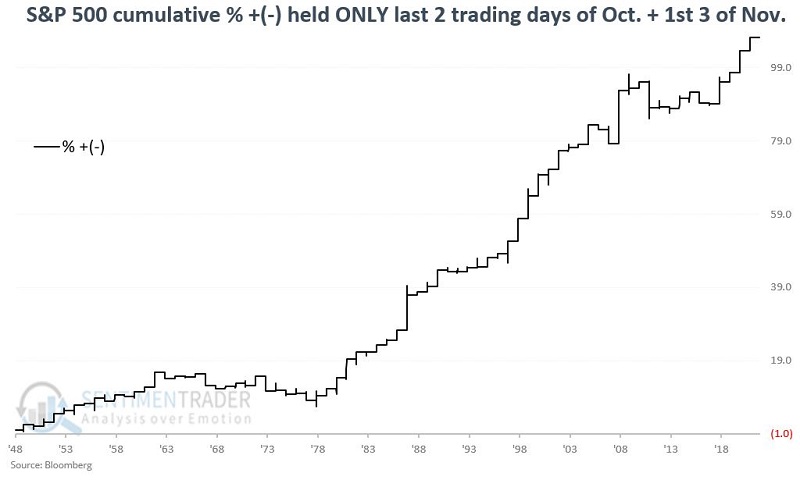
The index showed a gain 55 times versus 18 losses. Its average, median, and maximum gains during the good years far outweighed its losses during the bad ones.

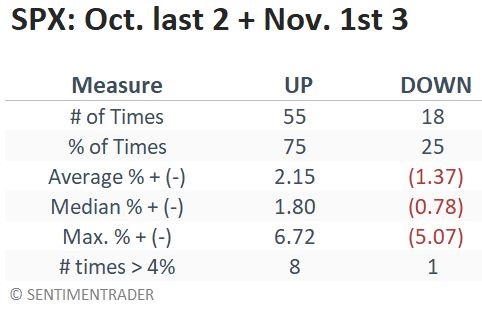
This period has witnessed an S&P 500 Index gain during 3 out of every four years. The median winning period was +1.80% versus a median losing period of minus -0.78% resulting in a median win/median loss ratio of 2.30-to-1. Also, note that this five-day trading period showed a gain of over +4% on eight occasions versus only one losing period above -4%.

What the research tells us…

The S&P 500 Index has witnessed a gain 3 of every four years during the five-day window highlighted above over the last 73 years. Is the market destined to advance during this five-trading day period in 2022? Ah, there's the rub. There are no sure things in the financial markets, and 2022 could easily be one of those off years. 

At the same time, a 75% Win Rate combined with a median win/median loss ratio of 2.3-to-1 over 73 years offers a potential short-term trading edge that some traders may find compelling.

PRODUCTS
SentimenTrader
Trading Tools
Indicators & Data API
‍
Strategies & Scanner
‍
Research Reports
FREE
RESOUrCES
Simple Backtest
Calculator
Simple Seasonality
Calculator
The Kelly Criterion
Calculator
Sentiment Geo Map
‍
Public Research Reports
‍
Education
Sentiment Indicators
‍
Technical Indicators
‍
Pricing
Bundle pricing
‍
FAQ
‍
Announcements
‍
COMPANY
‍
About
‍
In the News
‍
Testimonials
‍
Client Success Stories
CONTACT
‍
General Inquiries
‍
Media Inquiries
‍
Financial Professionals Inquiries
‍
© 2026 Sundial Capital Research Inc. All rights reserved.
Setsail Marketing
TermsPrivacyAffiliate Program
Risk Disclosure: The information and tools provided are for research and analytical purposes only and are not intended as investment advice. Market analysis involves uncertainty, and outcomes may differ from expectations. Users should conduct their own due diligence and consider their individual circumstances before making any financial decisions. Past performance is not necessarily indicative of future results.

Hypothetical Performance Disclosure: Hypothetical performance results have many inherent limitations, some of which are described below. No representation is being made that any account will or is likely to achieve profits or losses similar to those shown; in fact, there are frequently sharp differences between hypothetical performance results and the actual results subsequently achieved by any particular trading program. One of the limitations of hypothetical performance results is that they are generally prepared with the benefit of hindsight. In addition, hypothetical trading does not involve financial risk, and no hypothetical trading record can completely account for the impact of financial risk of actual trading. for example, the ability to withstand losses or to adhere to a particular trading program in spite of trading losses are material points which can also adversely affect actual trading results. There are numerous other factors related to the markets in general or to the implementation of any specific trading program which cannot be fully accounted for in the preparation of hypothetical performance results and all which can adversely affect trading results.

Testimonial Disclosure: Testimonials appearing on this website may not be representative of other clients or customers and is not a guarantee of future performance or success.