Products
SentimenTrader Trading Tools
‍
Backtest Engine
My Trading Toolkit
Correlation Analysis
Seasonality
Market Prediction
Indicators & Data API
‍
Proprietary Indicators & Charts
Market Data API
Strategies & Scanner
‍
50+ Trading Strategies
Smart Stock Scanner
Smart Option Scanner
Research Reports
‍
Research Solutions
Reports Library
Free Resources
Simple Backtest Calculator
Simple Seasonality Calculator
The Kelly Criterion Calculator
Sentiment Geo Map
Public Research Reports
Education
Sentiment Indicators
Technical Indicators
Pricing
Company
About
In the News
Testimonials
Client Success Stories
Contact
Log inLoginSign up
< BACK TO ALL REPORTS

A favorable seasonal period for the energy sector approaches

Jay Kaeppel
2022-03-23
The energy sector is about to enter one of the most reliably favorable seasonal periods of the year. Will it be reliable this year? We detail the history so that you can make your own assessment.

Key Points

  • The energy sector has had a terrific run - quadrupling since the 2020 Covid lows
  • This market is about to enter a seasonal period of typically favorable performance
  • Ticker XLE allows traders to play the broader energy sector

Energy

For our test, we will use an energy sector data series that goes back to 1954. The index uses the Fama French data series from 1954 into 1990 and S&P 500 Energy Sector from there.

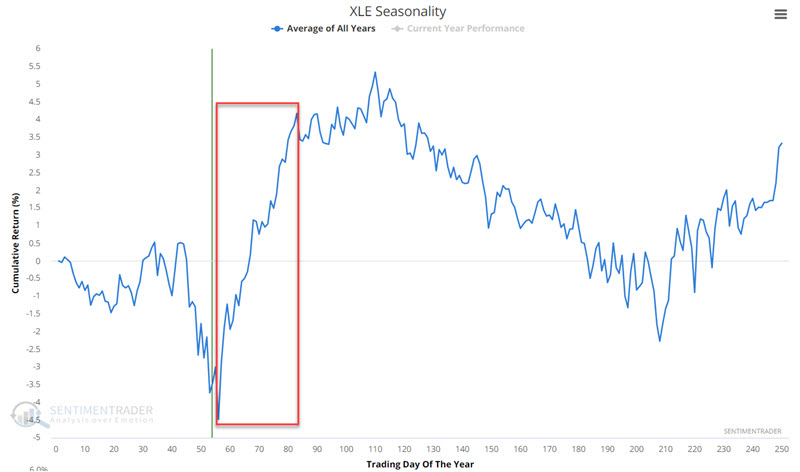
The chart below displays the annual seasonal trend for XLE (Energy Select Sector SPDR ETF). A favorable seasonal period extends from Trading Day of the Year (TDY) #56 through TDY #83. For 2022, this period extends from 3/23 through 5/2.

The chart below displays the growth of $1 invested in the Energy sector data series described above only during this favorable period each year since 1954.

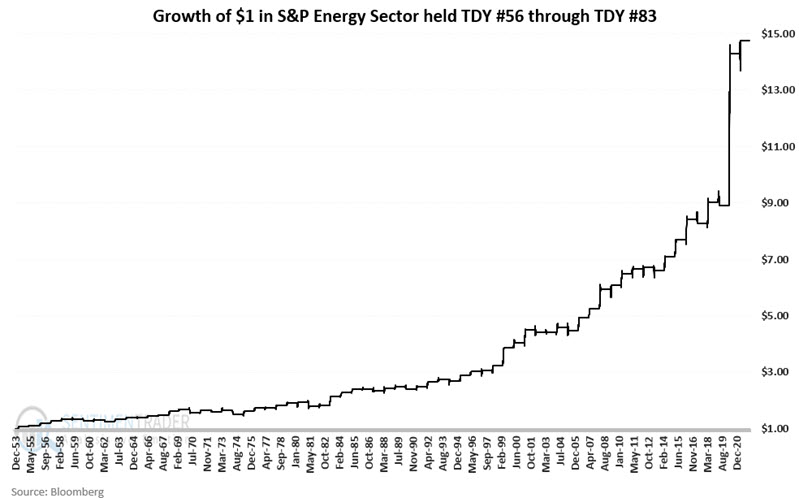
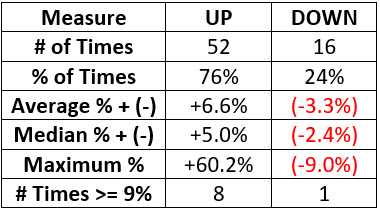
The table below displays a summary of performance results.

What the research tells us…

The good news is that historically energy stocks have gained ground during the highlighted seasonal period in roughly three out of every four years, and the average and median gains are twice as large as the average and median losses. In addition, this sector has shown a gain of over +9% on eight separate occasions and a loss of over -9% only once.

The bad news is that one never knows which year will be that one-in-four down years until after the fact. Following a seasonal trend requires a "leap of faith" (or, even better, some confirmation from other indicators and/or price action itself).

PRODUCTS
SentimenTrader
Trading Tools
Indicators & Data API
‍
Strategies & Scanner
‍
Research Reports
FREE
RESOUrCES
Simple Backtest
Calculator
Simple Seasonality
Calculator
The Kelly Criterion
Calculator
Sentiment Geo Map
‍
Public Research Reports
‍
Education
Sentiment Indicators
‍
Technical Indicators
‍
Pricing
Bundle pricing
‍
FAQ
‍
Announcements
‍
COMPANY
‍
About
‍
In the News
‍
Testimonials
‍
Client Success Stories
CONTACT
‍
General Inquiries
‍
Media Inquiries
‍
Financial Professionals Inquiries
‍
© 2026 Sundial Capital Research Inc. All rights reserved.
Setsail Marketing
TermsPrivacyAffiliate Program
Risk Disclosure: The information and tools provided are for research and analytical purposes only and are not intended as investment advice. Market analysis involves uncertainty, and outcomes may differ from expectations. Users should conduct their own due diligence and consider their individual circumstances before making any financial decisions. Past performance is not necessarily indicative of future results.

Hypothetical Performance Disclosure: Hypothetical performance results have many inherent limitations, some of which are described below. No representation is being made that any account will or is likely to achieve profits or losses similar to those shown; in fact, there are frequently sharp differences between hypothetical performance results and the actual results subsequently achieved by any particular trading program. One of the limitations of hypothetical performance results is that they are generally prepared with the benefit of hindsight. In addition, hypothetical trading does not involve financial risk, and no hypothetical trading record can completely account for the impact of financial risk of actual trading. for example, the ability to withstand losses or to adhere to a particular trading program in spite of trading losses are material points which can also adversely affect actual trading results. There are numerous other factors related to the markets in general or to the implementation of any specific trading program which cannot be fully accounted for in the preparation of hypothetical performance results and all which can adversely affect trading results.

Testimonial Disclosure: Testimonials appearing on this website may not be representative of other clients or customers and is not a guarantee of future performance or success.