
A favorable period for the S&P 500 Index approaches

Key Points
- The S&P 500 Index rallied almost 120% between March 2020 and early January 2022
- Since then, the index suffered a -14.6% decline in less than two months before a strong bounce
- The index is about to enter a seasonal period of typically favorable performance
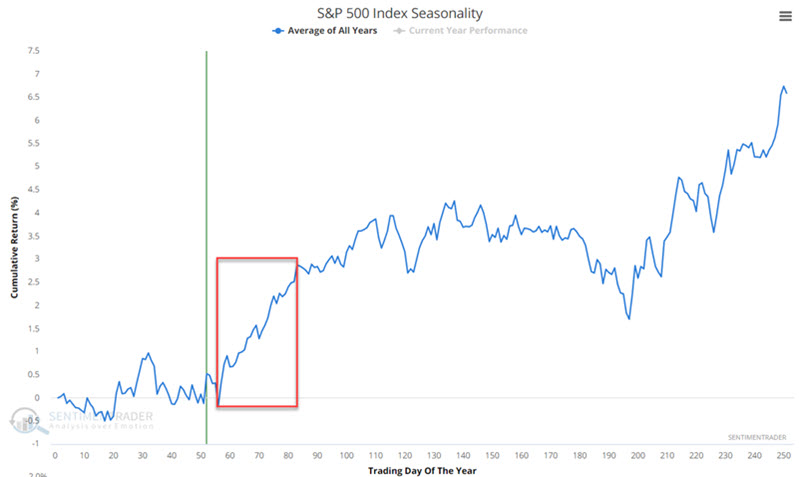
S&P 500 Index
The chart below displays the annual seasonal trend for SPX (S&P 500 Index). A favorable seasonal period extends from Trading Day of the Year (TDY) #56 through TDY #83. For 2022, this period extends from 3/23 through 5/2.
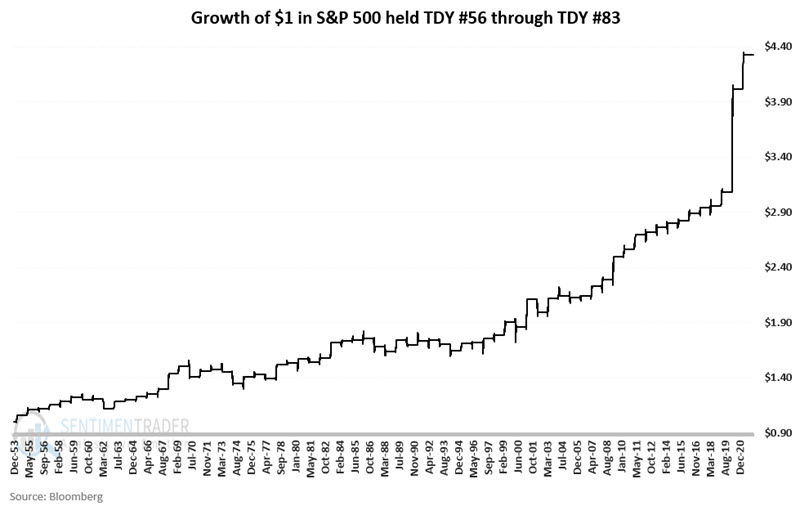
For our test, we will use price data for the S&P 500 Index going back to 1954. The chart below displays the growth of $1 invested in the S&P 500 Index only during this favorable period each year since 1954.
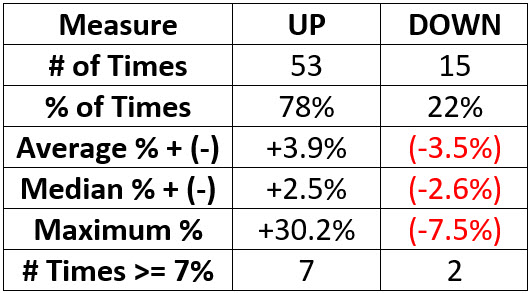
The table below displays a summary of performance results.
What the research tells us…
The information above in no way "guarantees" a stock market rally in the weeks ahead. It suggests that traders pay less attention to "negative news" and more attention to actual price trends and confirming bullish indicators (see here and here).
It is important to remember that 78% winning trades is a far cry from 100% winning trades. As a result, position sizing and risk controls are still the backbones of any trading campaign. However, seasonality suggests that traders be open to giving the bullish case the benefit of the doubt until proven otherwise.