Products
SentimenTrader Trading Tools
‍
Backtest Engine
My Trading Toolkit
Correlation Analysis
Seasonality
Indicators & Data API
‍
Proprietary Indicators & Charts
Market Data API
Strategies & Scanner
‍
50+ Trading Strategies
Smart Stock Scanner
Research Reports
‍
Research Solutions
Reports Library
Free Resources
Simple Backtest Calculator
Simple Seasonality Calculator
The Kelly Criterion Calculator
Sentiment Geo Map
Public Research Reports
Education
Sentiment Indicators
Technical Indicators
Pricing
Company
About
In the News
Testimonials
Client Success Stories
Contact
Log inLoginSign up
< BACK TO ALL REPORTS

A favorable combination of price patterns emerges

Jay Kaeppel
2023-07-31
The stock market has experienced a steady, decisive advance in recent months, and to many investors, a correction "feels" inevitable. And it may well be. But a combination of rare price patterns serves as a reminder to continue to give the bullish case the benefit of the doubt.

Key points

  • The S&P 500 will close July 2023 with a gain; this would mark the 5th consecutive up month
  • During this time, April, May, and June all closed higher, completing a "2nd Quarter Trifecta"
  • Following previous occurrences of these price patterns during the past 70+ years, the stock market has shown a persistent favorable bias in the months ahead

Five up months for the S&P 500 Index is rare - and bullish

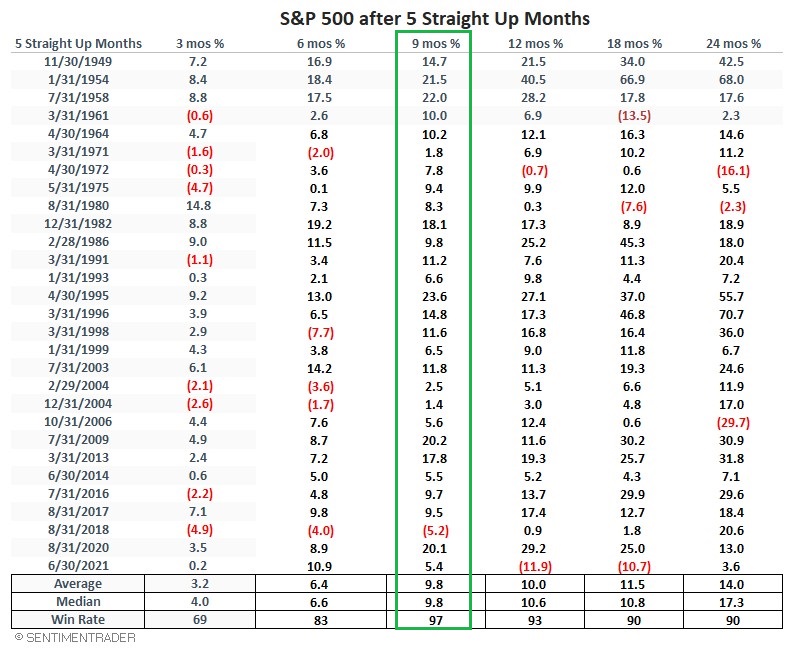
As discussed in detail in this piece, since 1949, there have been only 29 times when the S&P 500 Index showed a calendar monthly gain for five consecutive months. This has tended to be followed by favorable stock market action over the ensuing nine months. As a quick review, the table and chart below are reprinted from the previous article.

The table below displays the dates and subsequent S&P 500 performance for each of the previous instances.

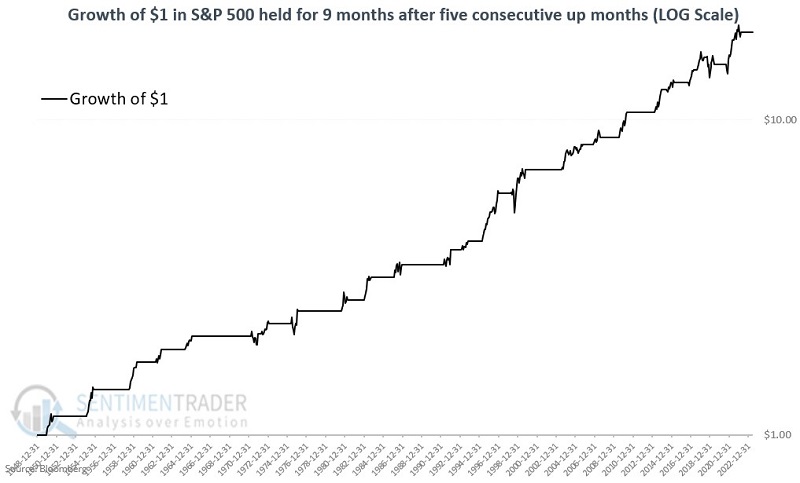
The chart below displays the growth of $1 invested in the S&P 500 (on a logarithmic scale, i.e., the distance between $1 and $10 is the same as the distance between $10 and $100) only during the nine months following the dates listed in the table above.

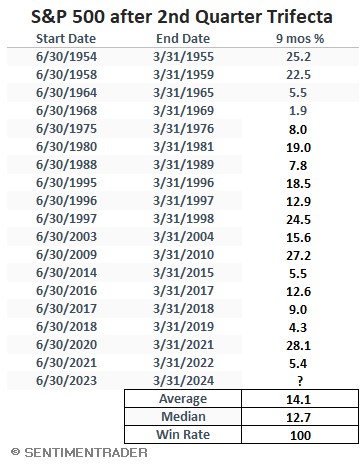
The 2nd Quarter Trifecta (2QT)

A 2nd Quarter Trifecta occurs when the S&P 500 shows a monthly gain for April, May, and June during the same year. This tends to be a favorable sign for stocks over the next nine months (i.e., through March of the following year). The table below displays the dates of previous occurrences and subsequent S&P 500 performance over the next nine months.

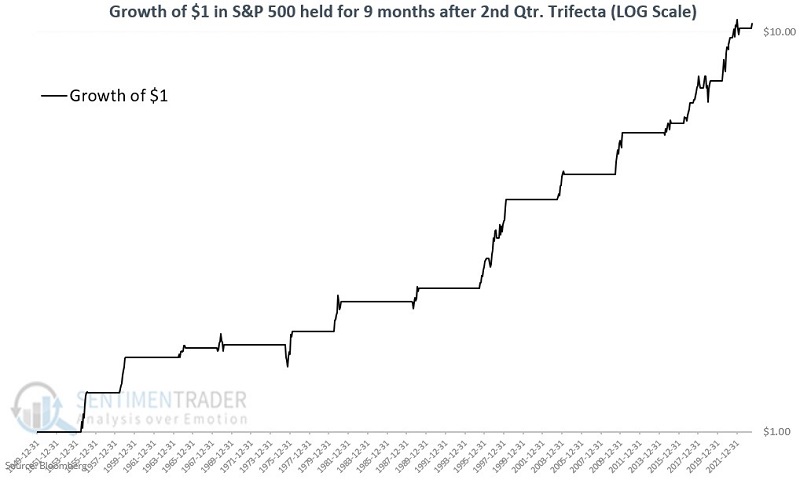
The chart below displays the growth of $1 invested in the S&P 500 (on a logarithmic scale) only during the nine-month periods listed in the table above (including July 2023, which showed the S&P 500 with a gain of +2.8% through July 28th).

Combining the two price patterns reveals a favorable tendency

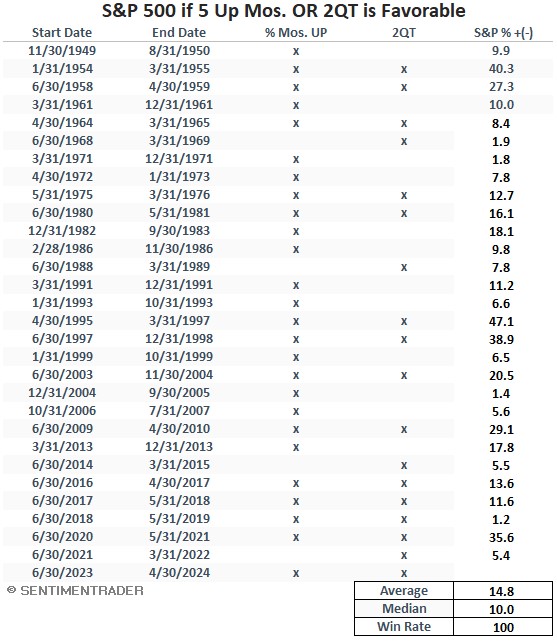
Next, we will combine the two price patterns above and consider all periods when either pattern is in a favorable nine-month period.

The table below displays all periods when at least one - or both - of the price patterns was favorable (i.e., the nine months after the 5th consecutive up months for the S&P 500 and/or the nine months after April, May, and June all see the S&P 500 close higher).

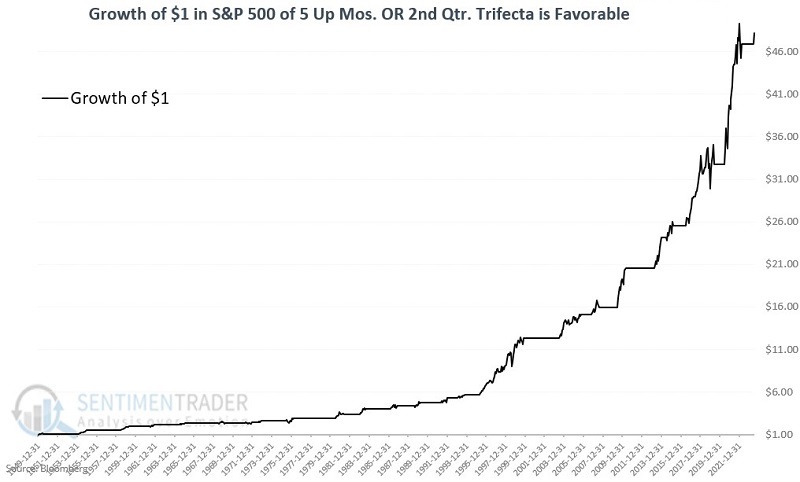
The chart below displays the growth of $1 invested in the S&P 500 only during the favorable periods listed in the table above.

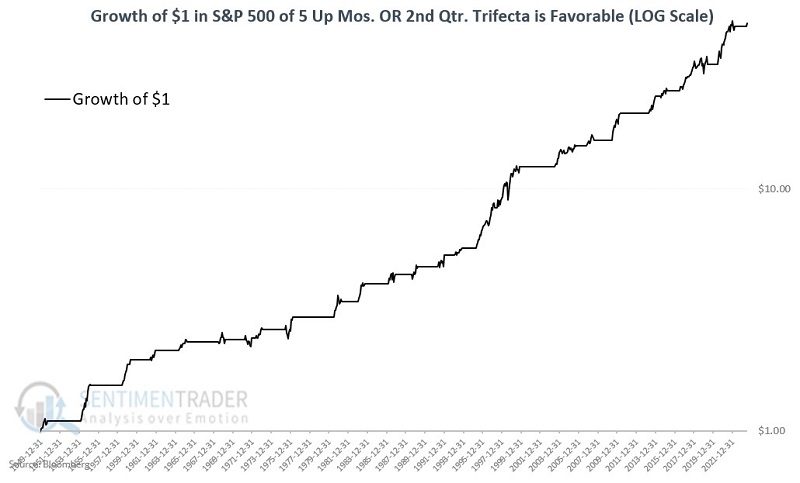
The chart below displays the same results as the previous chart but on a logarithmic scale.

What the research tells us…

Momentum can be a powerful force in the stock market. The results highlighted above represent a clear case in point. Nevertheless, it is essential to remember that there are no sure things in the financial markets. It would be a mistake for any investor to assume that the stock market is guaranteed to advance between now and April 2024. The primary lesson from the data above is one of being willing to give the bullish case the benefit of the doubt until price action gives some reason to think otherwise.

Sorry, you don't have access to this report

Upgrade your subscription plan to get access
Go to Dasboard
PRODUCTS
SentimenTrader
Trading Tools
Indicators & Data API
‍
Strategies & Scanner
‍
Research Reports
FREE
RESOUrCES
Simple Backtest
Calculator
Simple Seasonality
Calculator
The Kelly Criterion
Calculator
Sentiment Geo Map
‍
Public Research Reports
‍
Education
Sentiment Indicators
‍
Technical Indicators
‍
Pricing
Bundle pricing
‍
FAQ
‍
Announcements
‍
COMPANY
‍
About
‍
In the News
‍
Testimonials
‍
Client Success Stories
CONTACT
‍
General Inquiries
‍
Media Inquiries
‍
Financial Professionals Inquiries
‍
© 2026 Sundial Capital Research Inc. All rights reserved.
Setsail Marketing
TermsPrivacyAffiliate Program
Risk Disclosure: Futures and forex trading contains substantial risk and is not for every investor. An investor could potentially lose all or more than the initial investment. Risk capital is money that can be lost without jeopardizing ones’ financial security or life style. Only risk capital should be used for trading and only those with sufficient risk capital should consider trading. Past performance is not necessarily indicative of future results.

Hypothetical Performance Disclosure: Hypothetical performance results have many inherent limitations, some of which are described below. No representation is being made that any account will or is likely to achieve profits or losses similar to those shown; in fact, there are frequently sharp differences between hypothetical performance results and the actual results subsequently achieved by any particular trading program. One of the limitations of hypothetical performance results is that they are generally prepared with the benefit of hindsight. In addition, hypothetical trading does not involve financial risk, and no hypothetical trading record can completely account for the impact of financial risk of actual trading. for example, the ability to withstand losses or to adhere to a particular trading program in spite of trading losses are material points which can also adversely affect actual trading results. There are numerous other factors related to the markets in general or to the implementation of any specific trading program which cannot be fully accounted for in the preparation of hypothetical performance results and all which can adversely affect trading results.

Testimonial Disclosure: Testimonials appearing on this website may not be representative of other clients or customers and is not a guarantee of future performance or success.