
A dwindling premium for stocks

Key points:
- By two measures, stocks have become overvalued relative to bonds
- Similar extremes have tended to precede poor multi-month returns in stocks, slightly less so in bonds
- Value and defensive stocks tended to hold up better under similar conditions
Valuation differences shrink
Momentum in stocks has been somewhere between good and great, with mostly impressive and supportive breadth among stocks and sectors. As we've seen time and again, in study after study, these types of conditions tend to persist for months at least.
Unlike in most past instances, there is now a major competing asset. And asset allocation is the most important factor for the average investor.
As noted by Bloomberg:
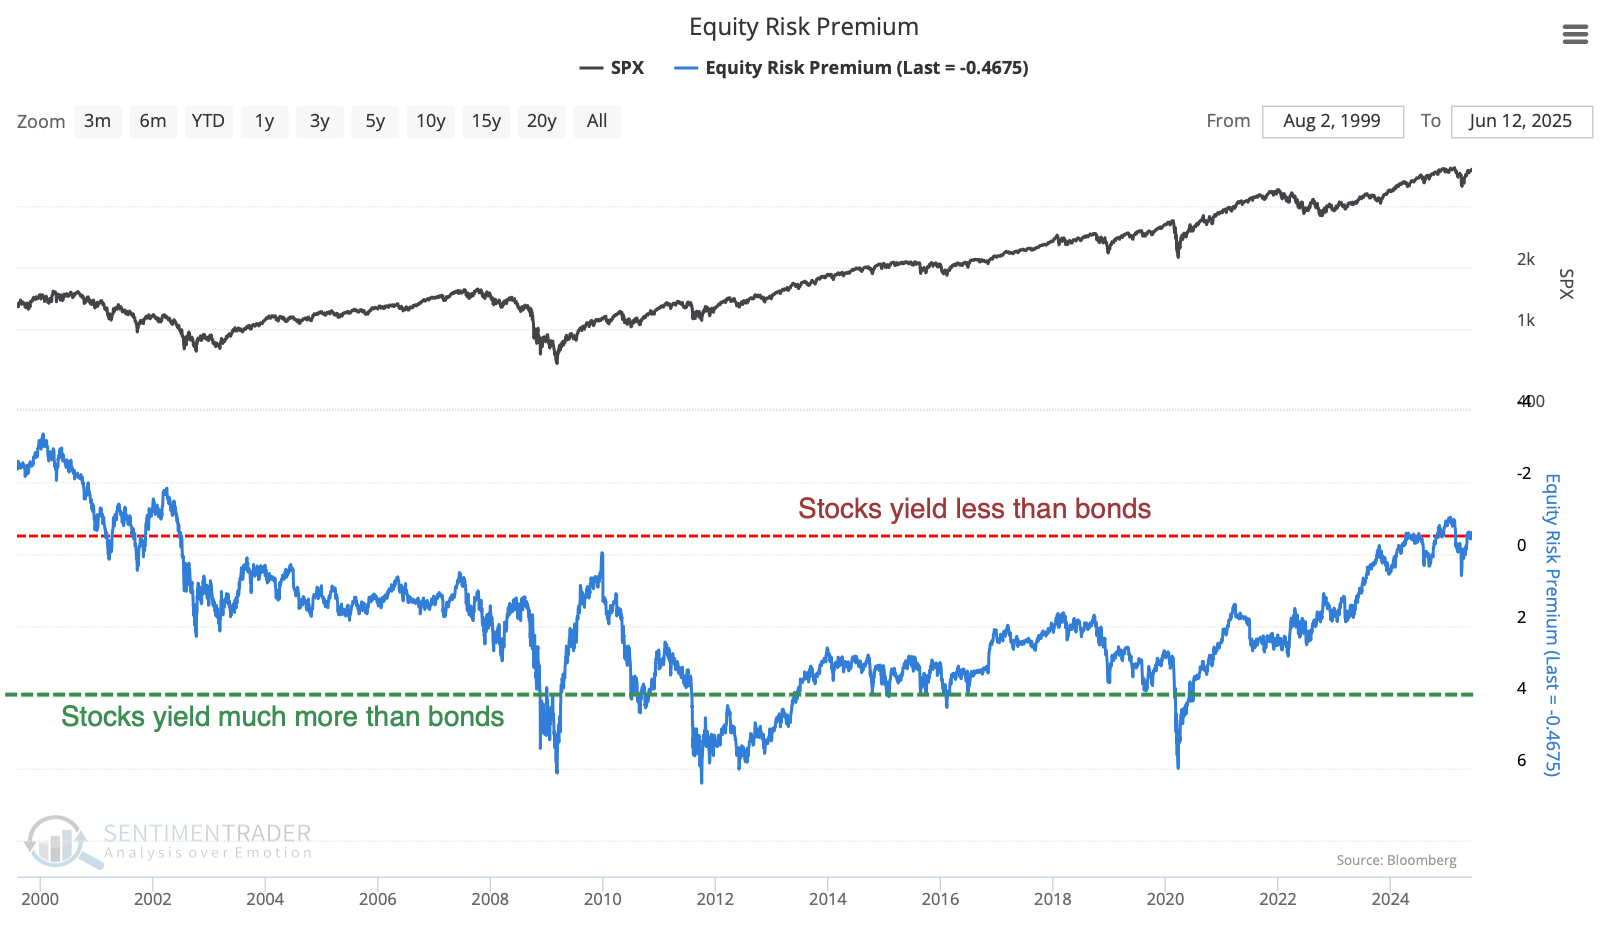
Calculated by subtracting the S&P 500 Index's earnings yield from the 10-year Treasuries rate, the gauge helps investors decide where to allocate their cash. The case for owning equities becomes less compelling if bonds can earn nearly as much as stocks but with reduced risk.
While calculations can vary, the Equity Risk Premium (ERP) shown on the site is among its most extreme levels since 2000. The scale on the chart is inverted to better line up with overbought/oversold conditions in stocks.
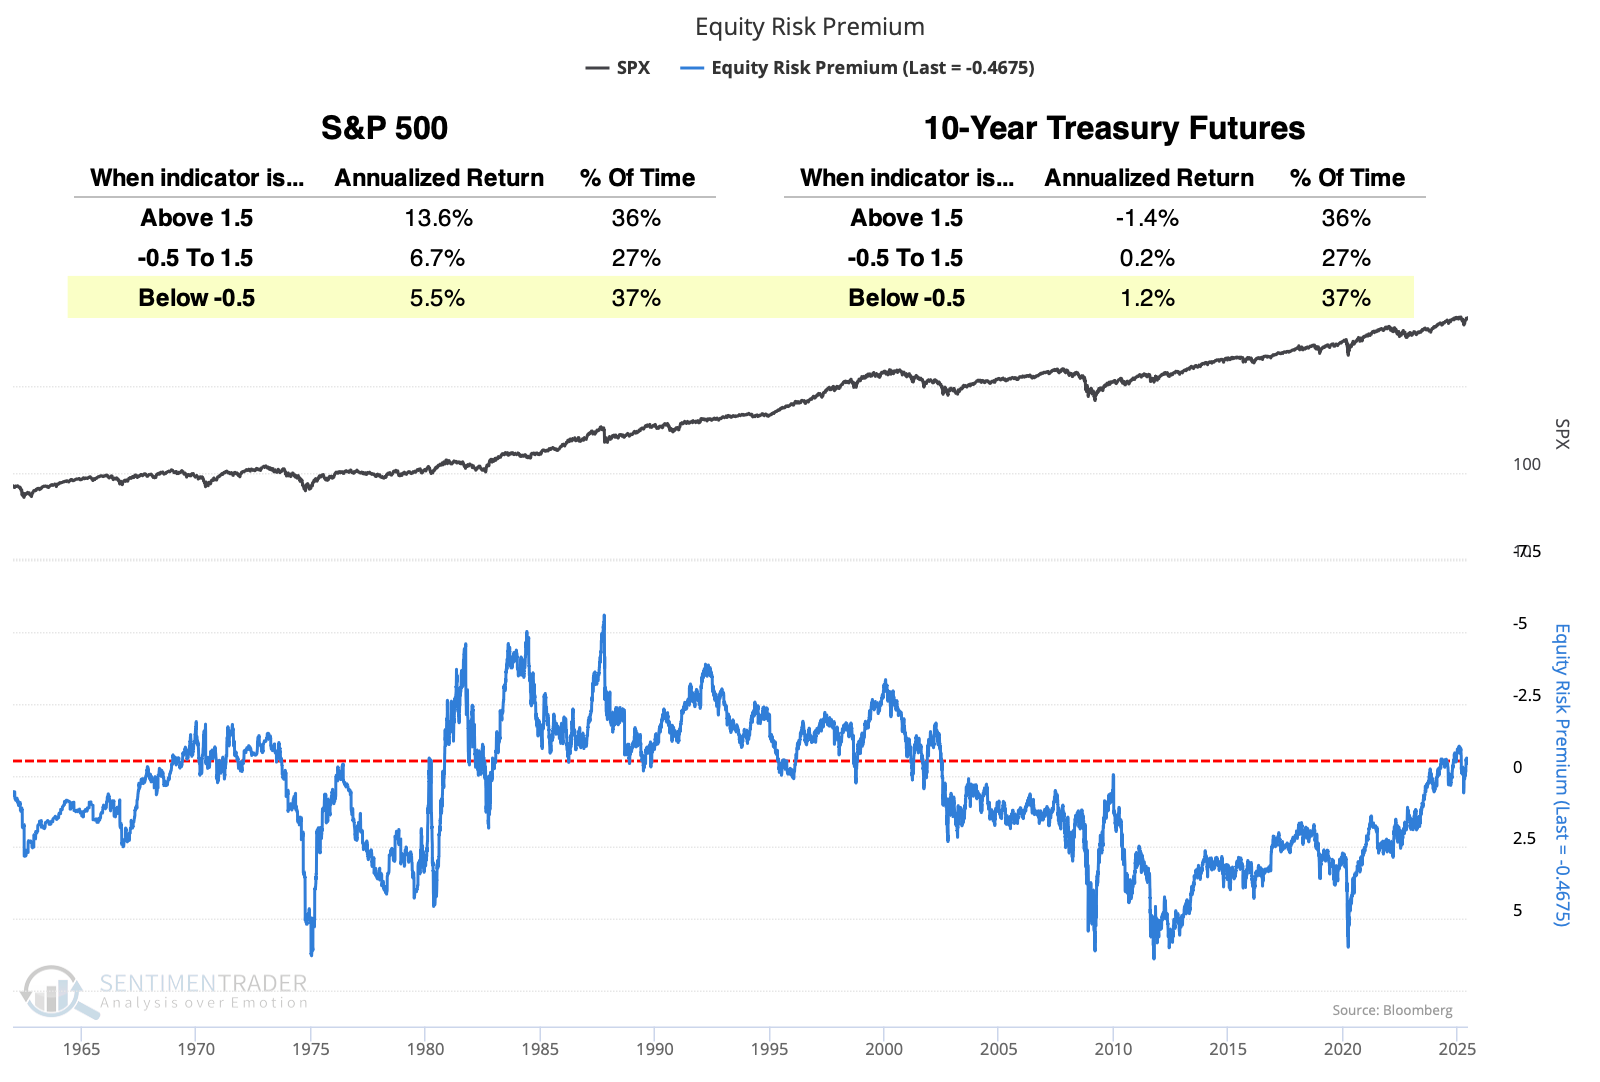
Dating back to 1962, the current level has been exceeded often, including most of the 1980s and 1990s. Even so, the annualized return in the S&P 500 at this level was only +5.5%, while on 10-year Treasury futures it was +1.2%. That is significantly worse for the S&P than under other ERP regimes, and markedly better for Treasuries.
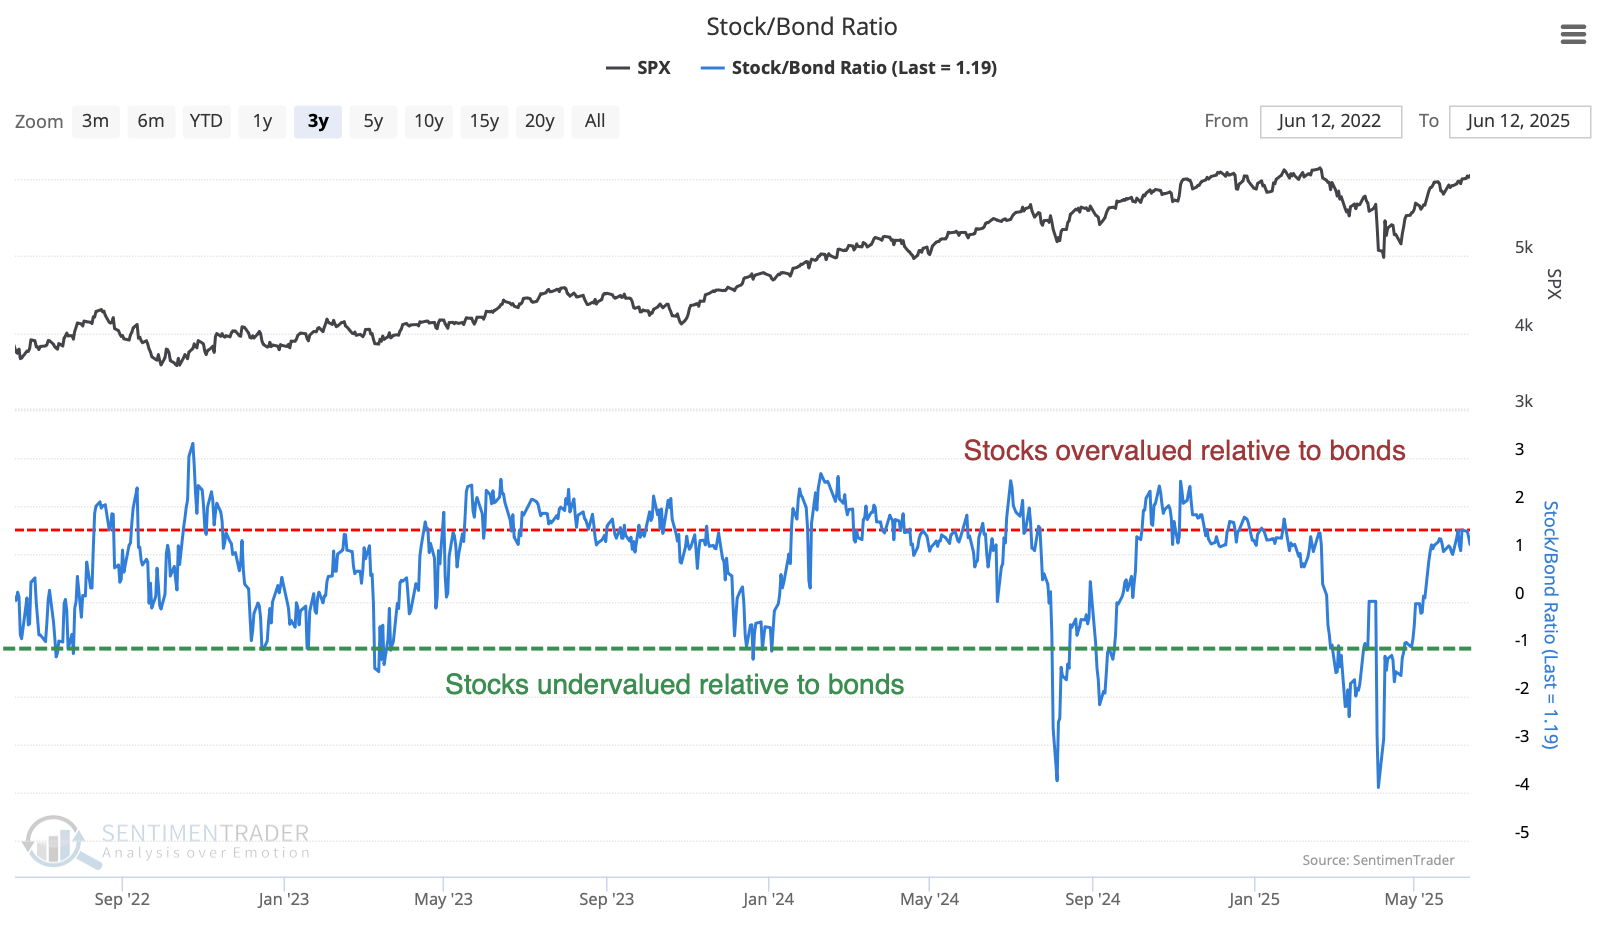
Not only is the ERP at an extreme, but on a shorter-term basis, the Stock/Bond Ratio has gotten out of whack, trading at the upper end of its typical range. It suggests that stocks have been around 1.5 standard deviations above the typical relationship with bonds.
The edge for stocks has become fraught
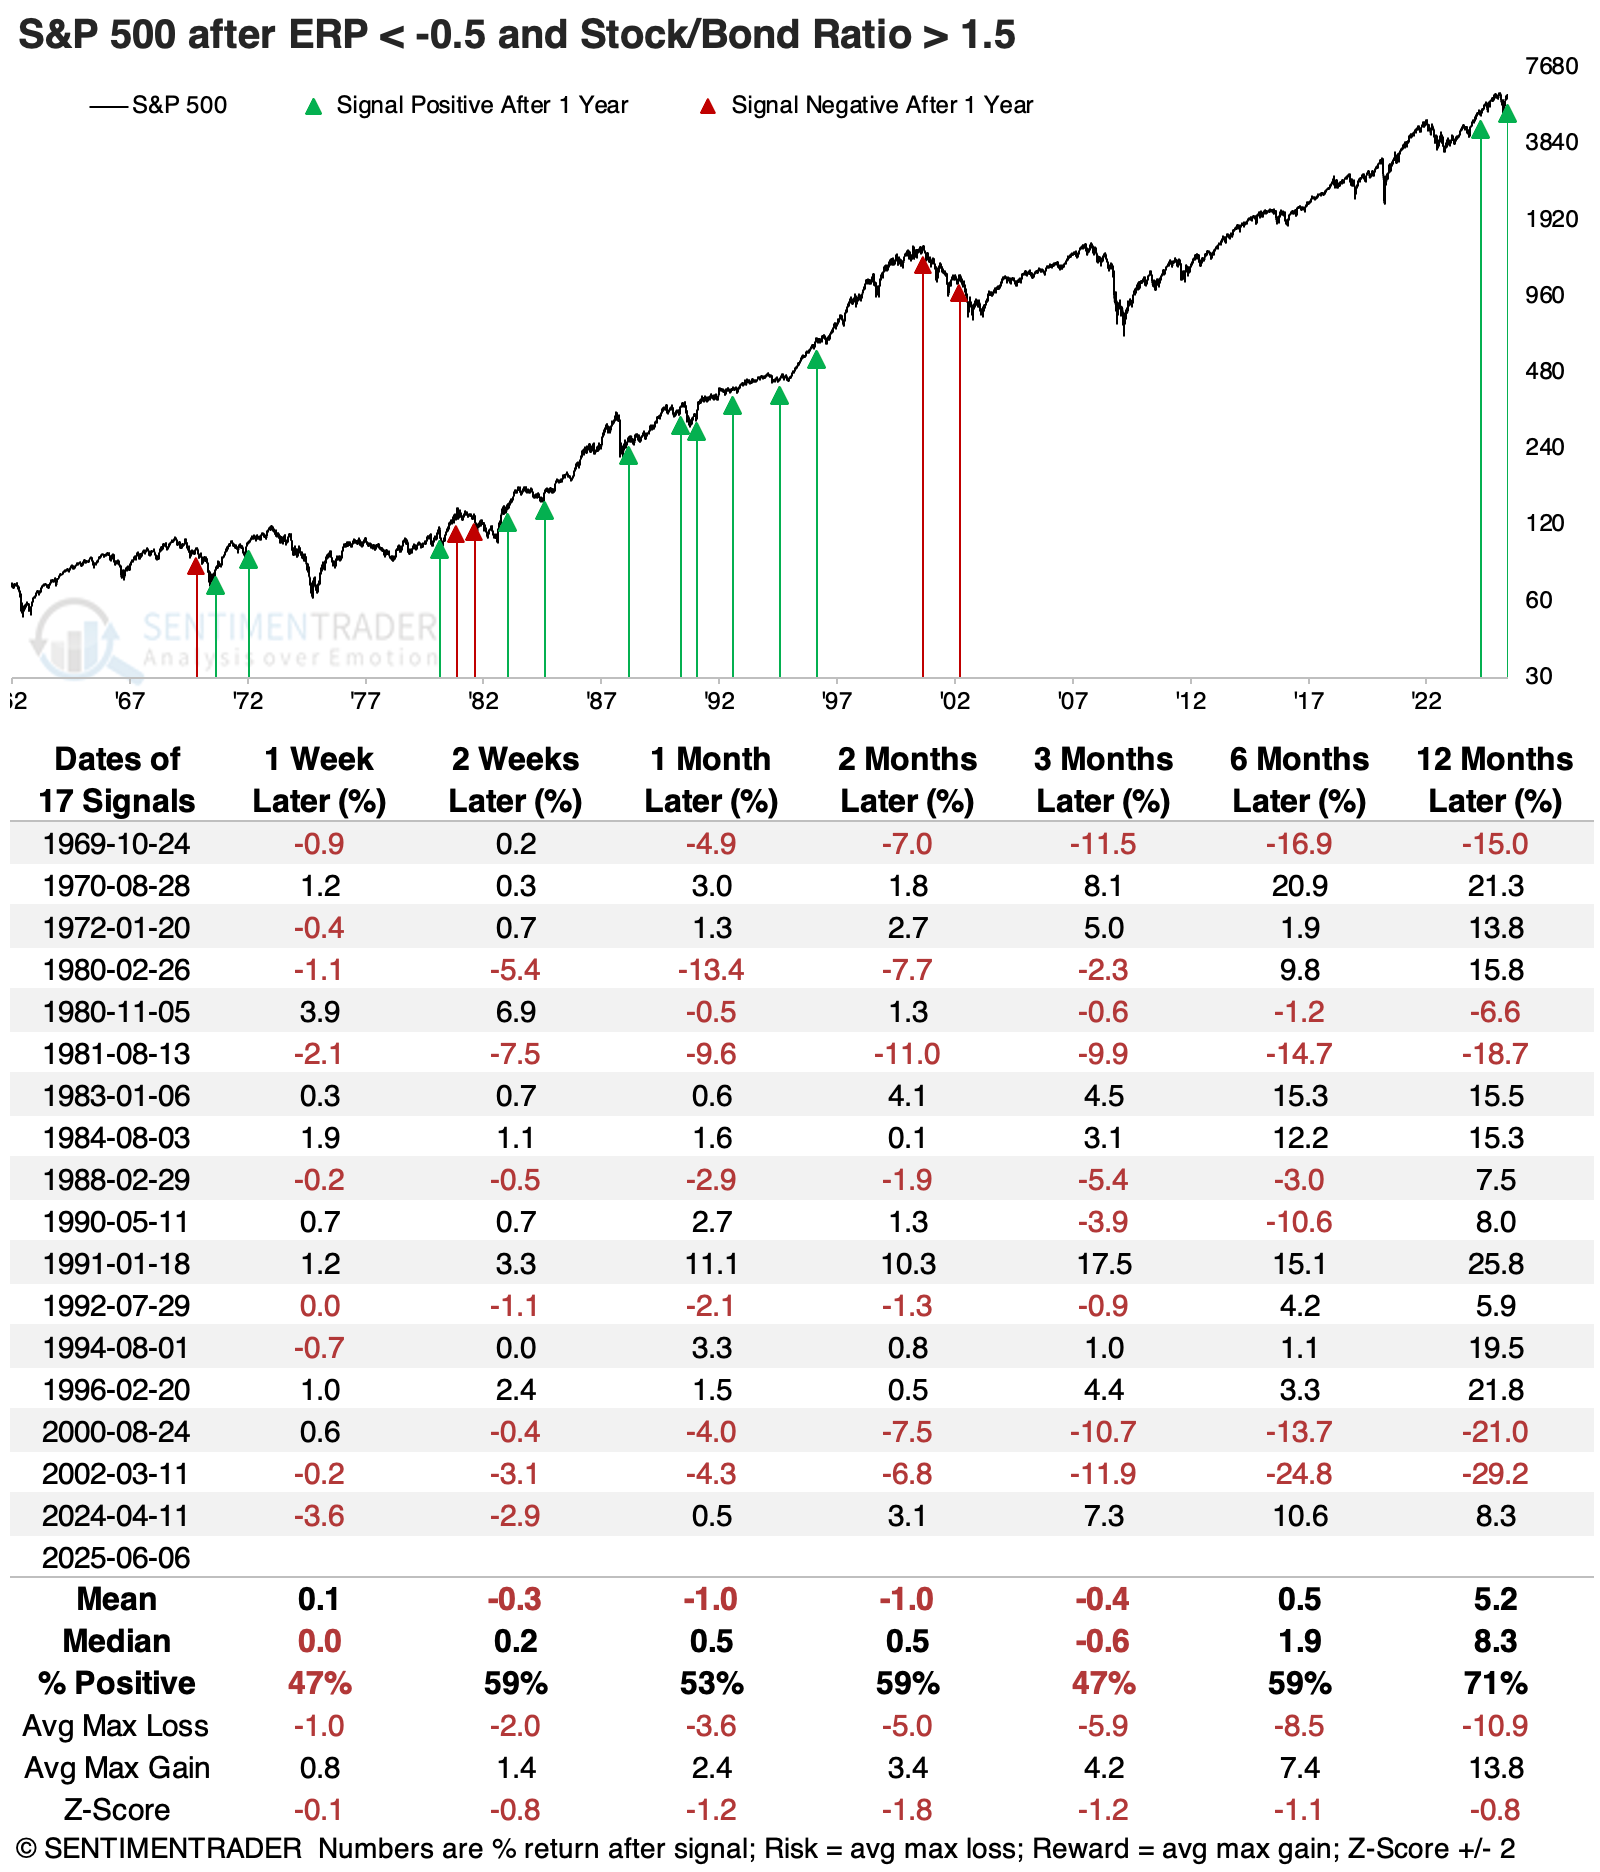
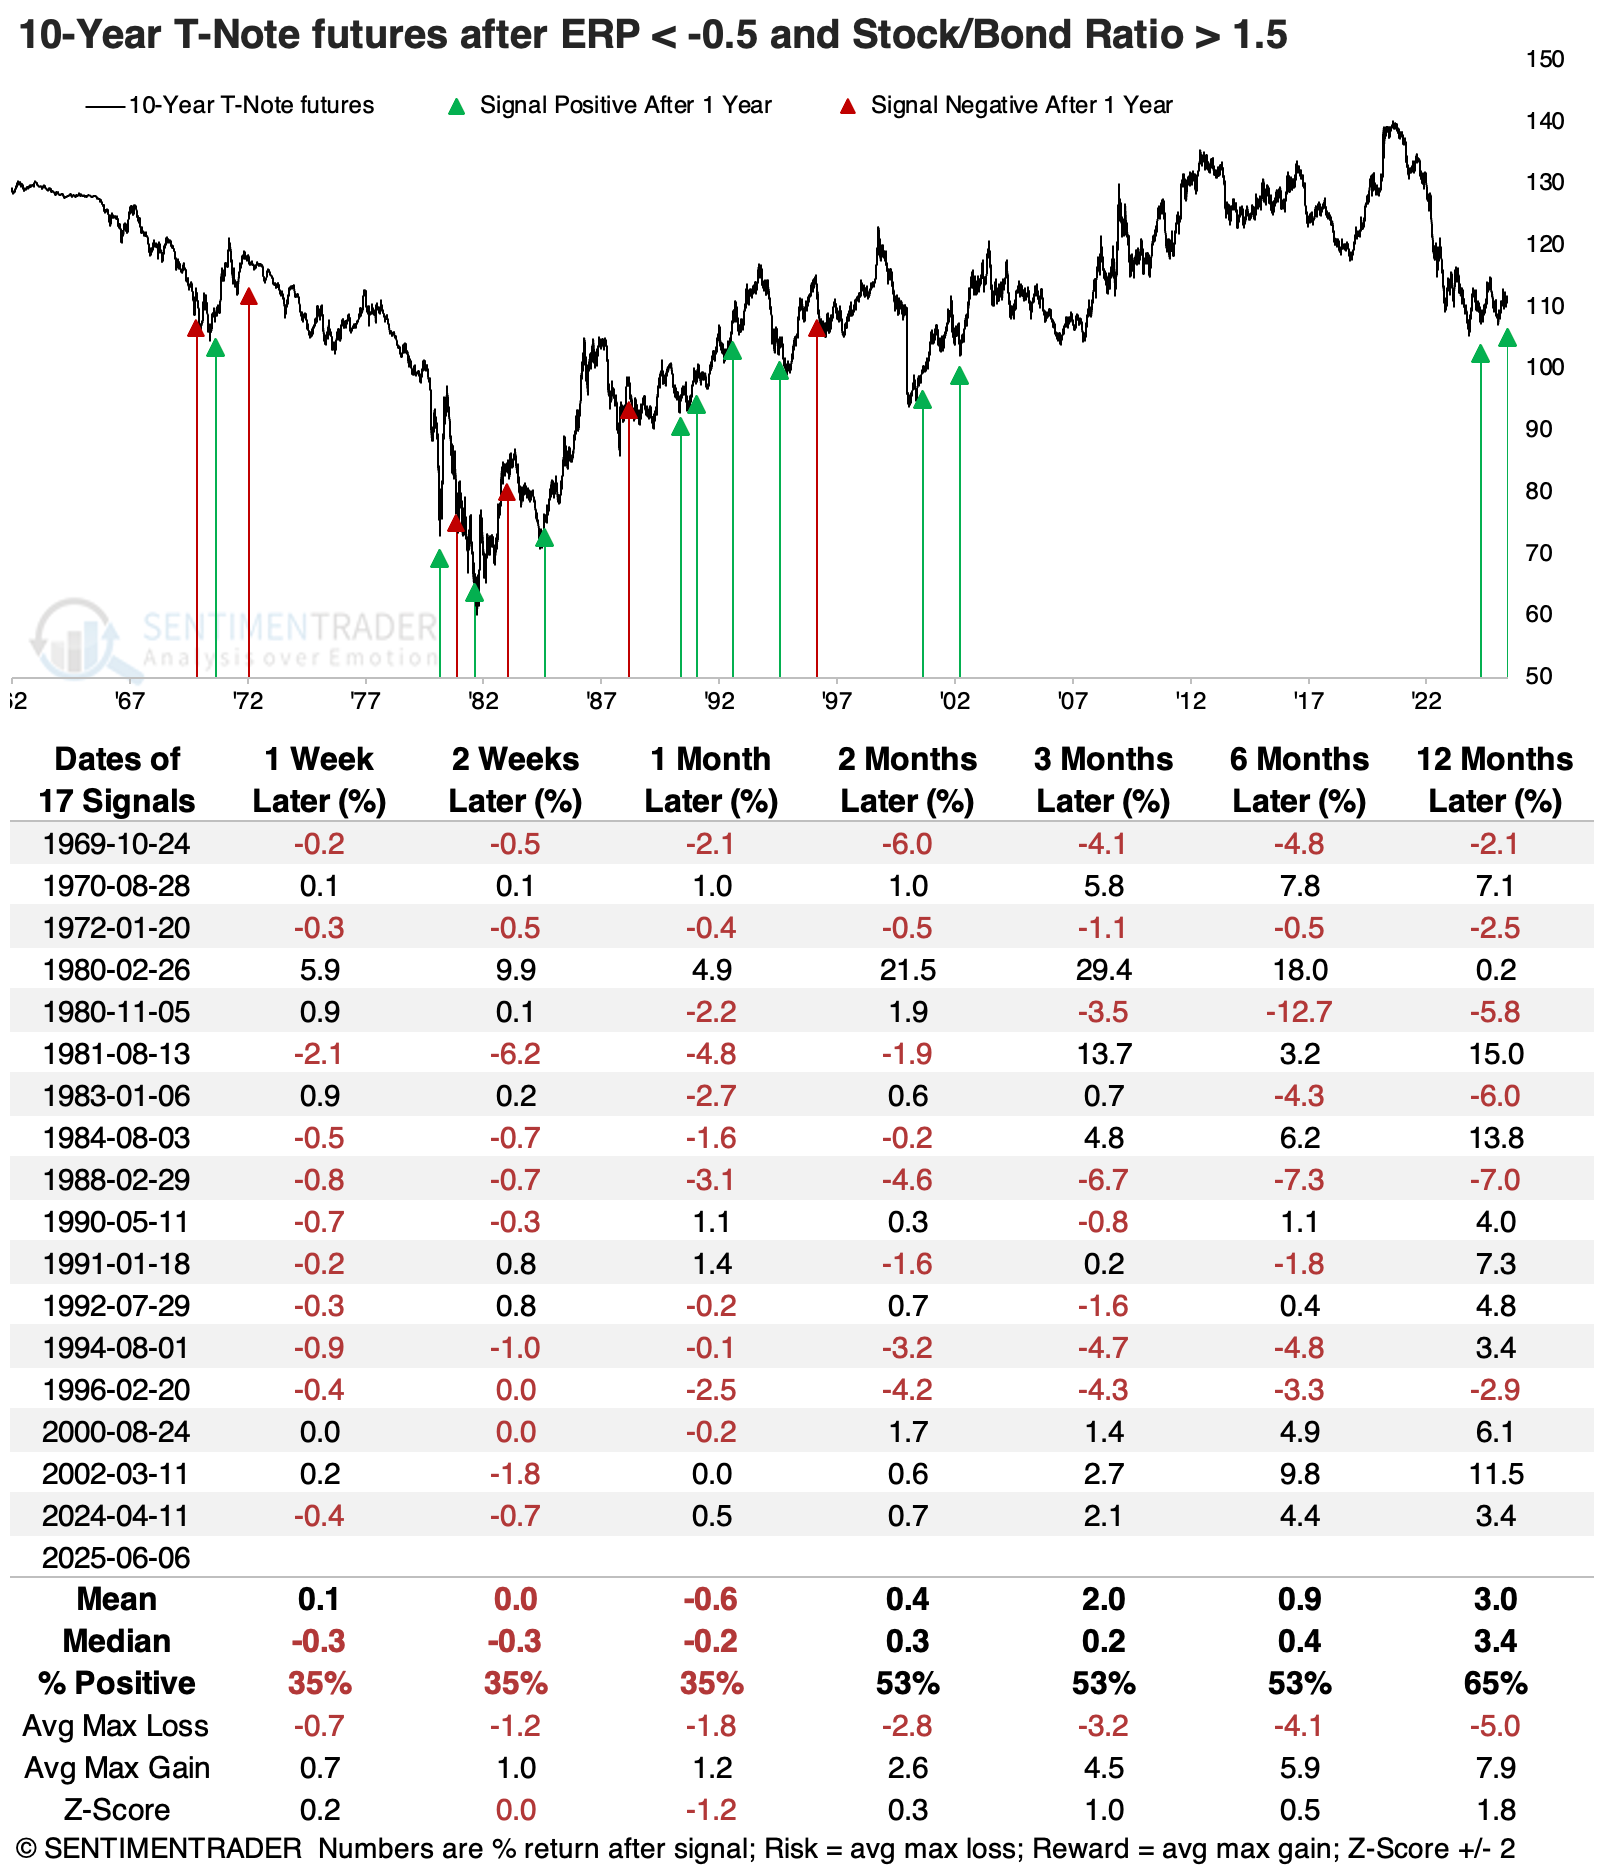
When we combine a negative ERP with an overvalued Stock/Bond Ratio, the return in the S&P 500 over the next three months was underwhelming. Its median return was negative, with more risk than reward. Even during the 1980s-90s, the S&P was negative about as often as positive over that time frame.
Bond futures suffered terribly before 1982, and their returns over the next month were poor. Beyond that, returns turned positive on average, though not compellingly so.
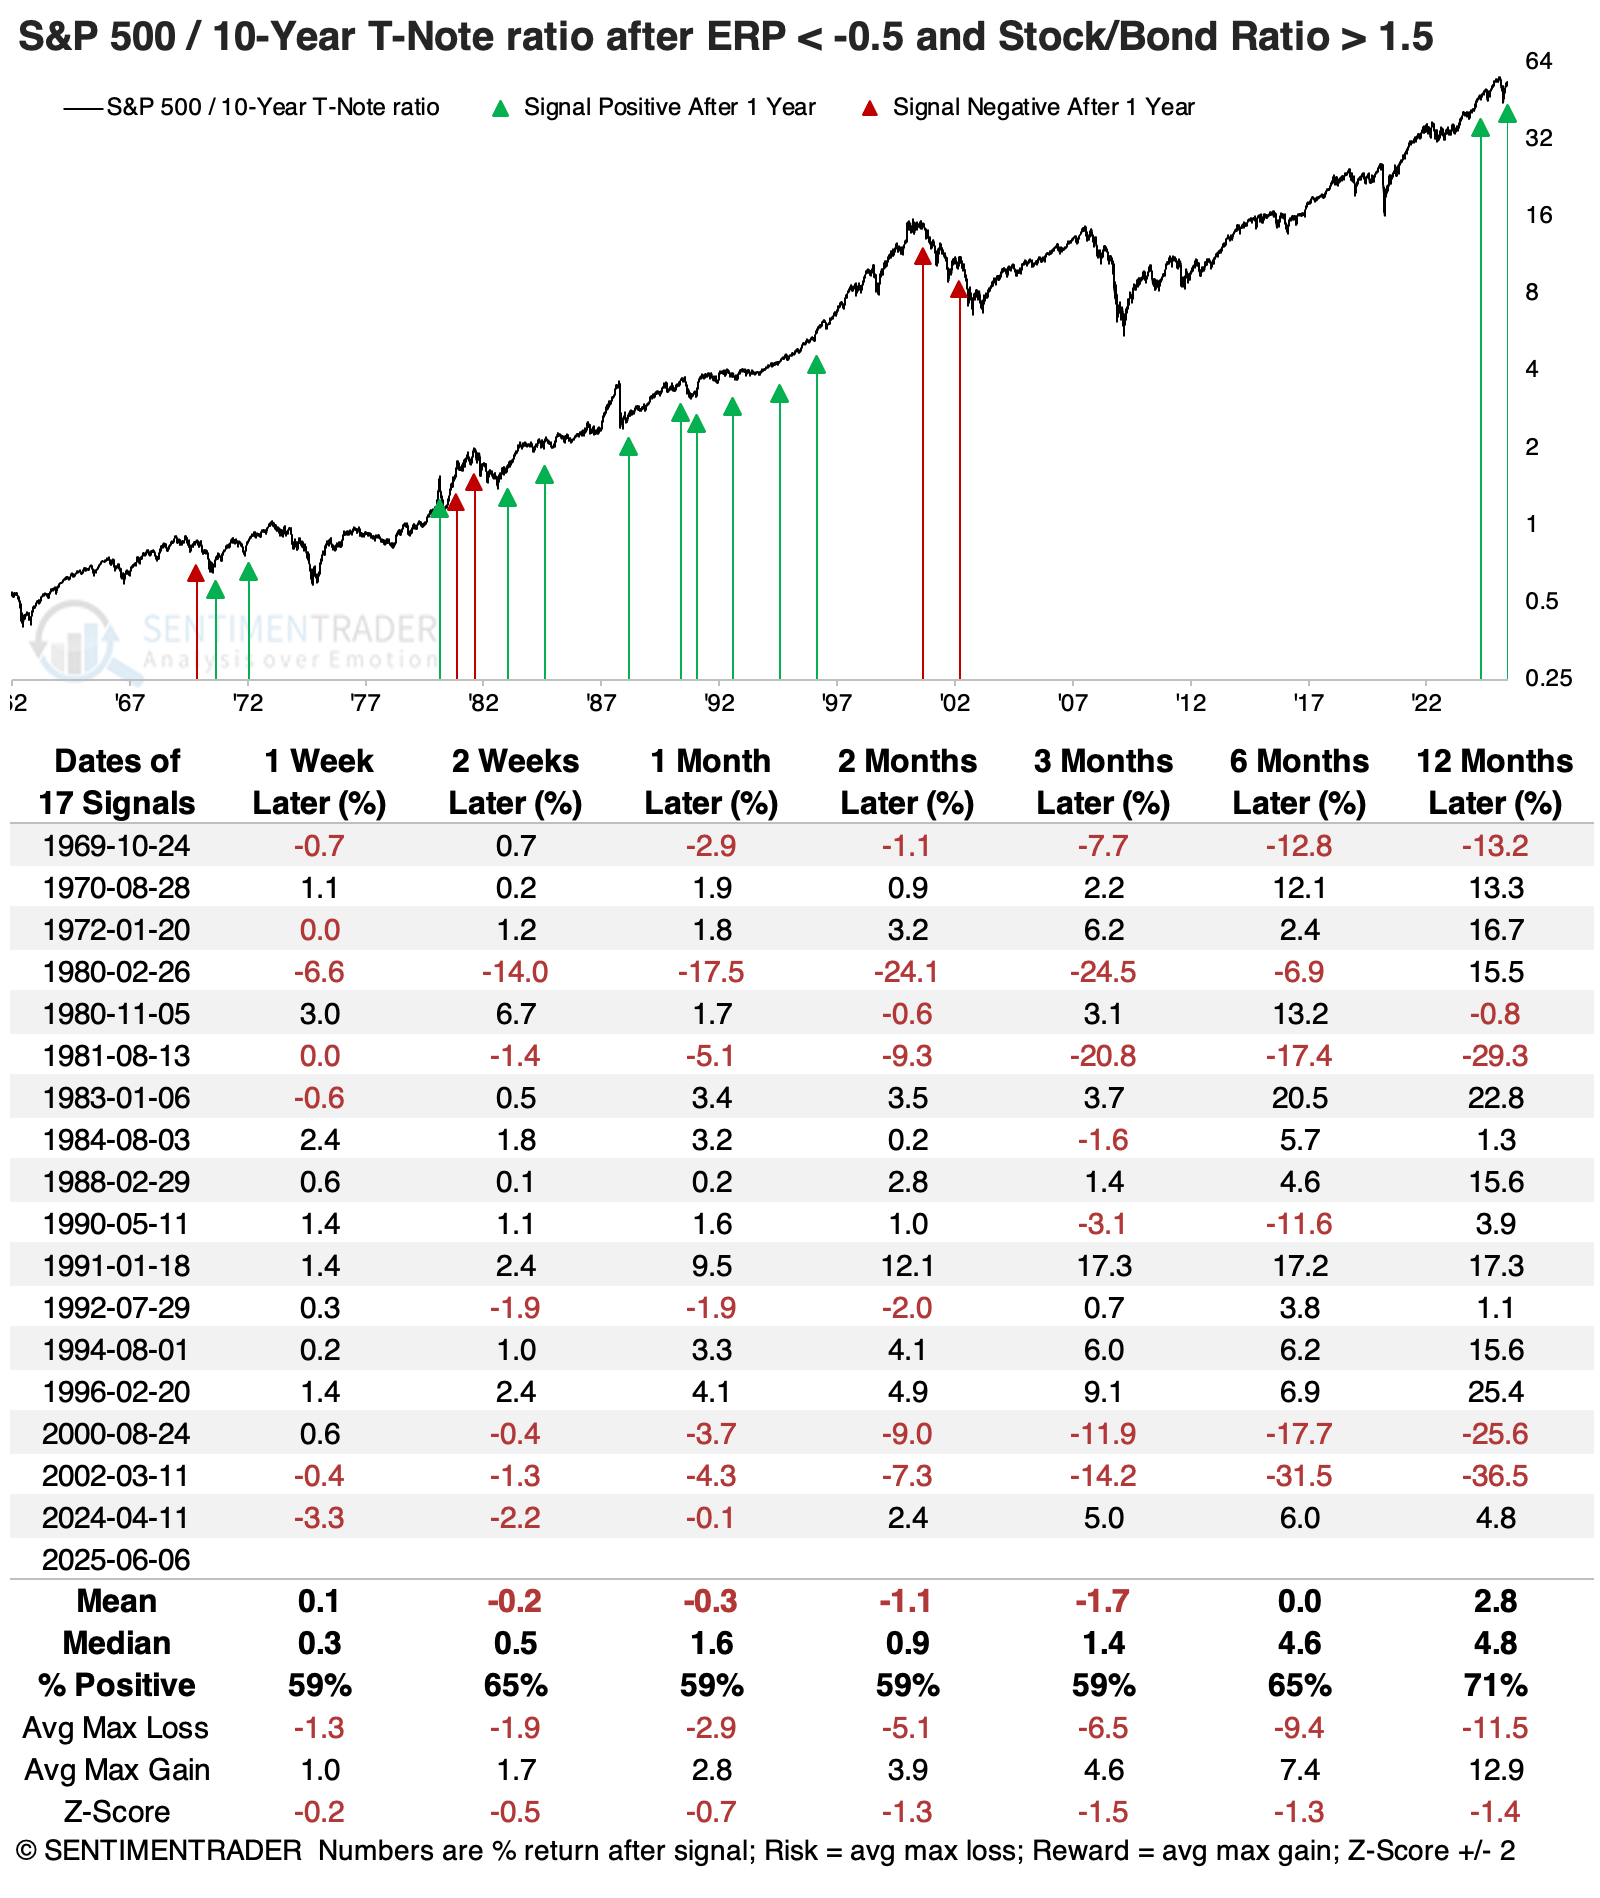
Stocks still tended to outperform bonds, but this was not a given. In fact, the three-month arithmetic average return for the ratio of the S&P 500 to 10-year Treasury futures was negative, thanks to a few heavy losses.
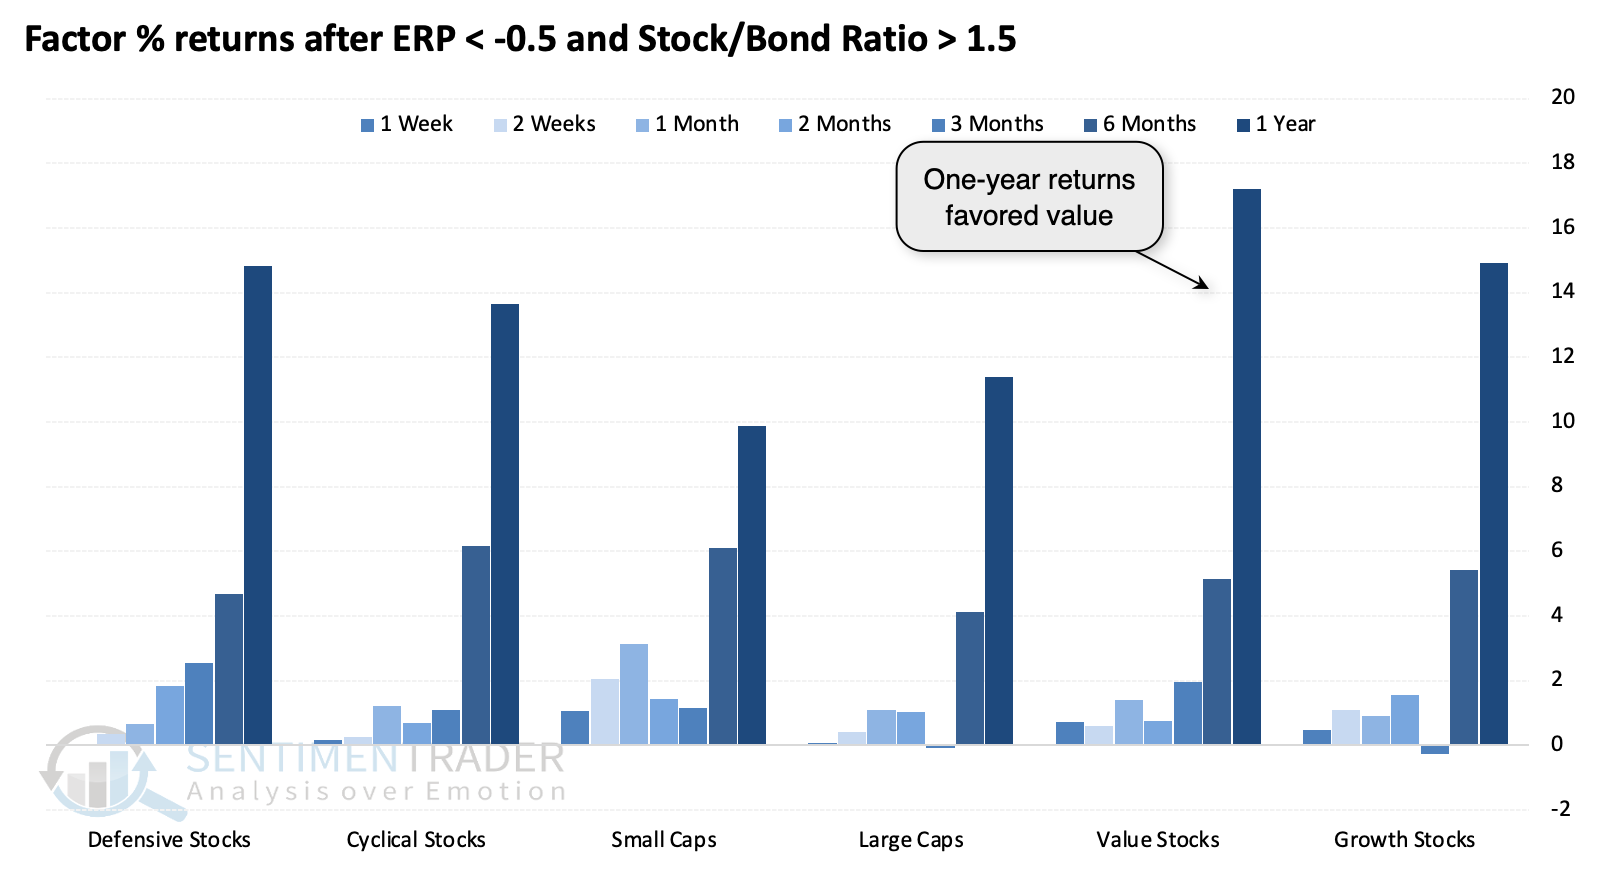
After these stock versus bond valuation extremes, the value factor showed the highest average one-year returns.
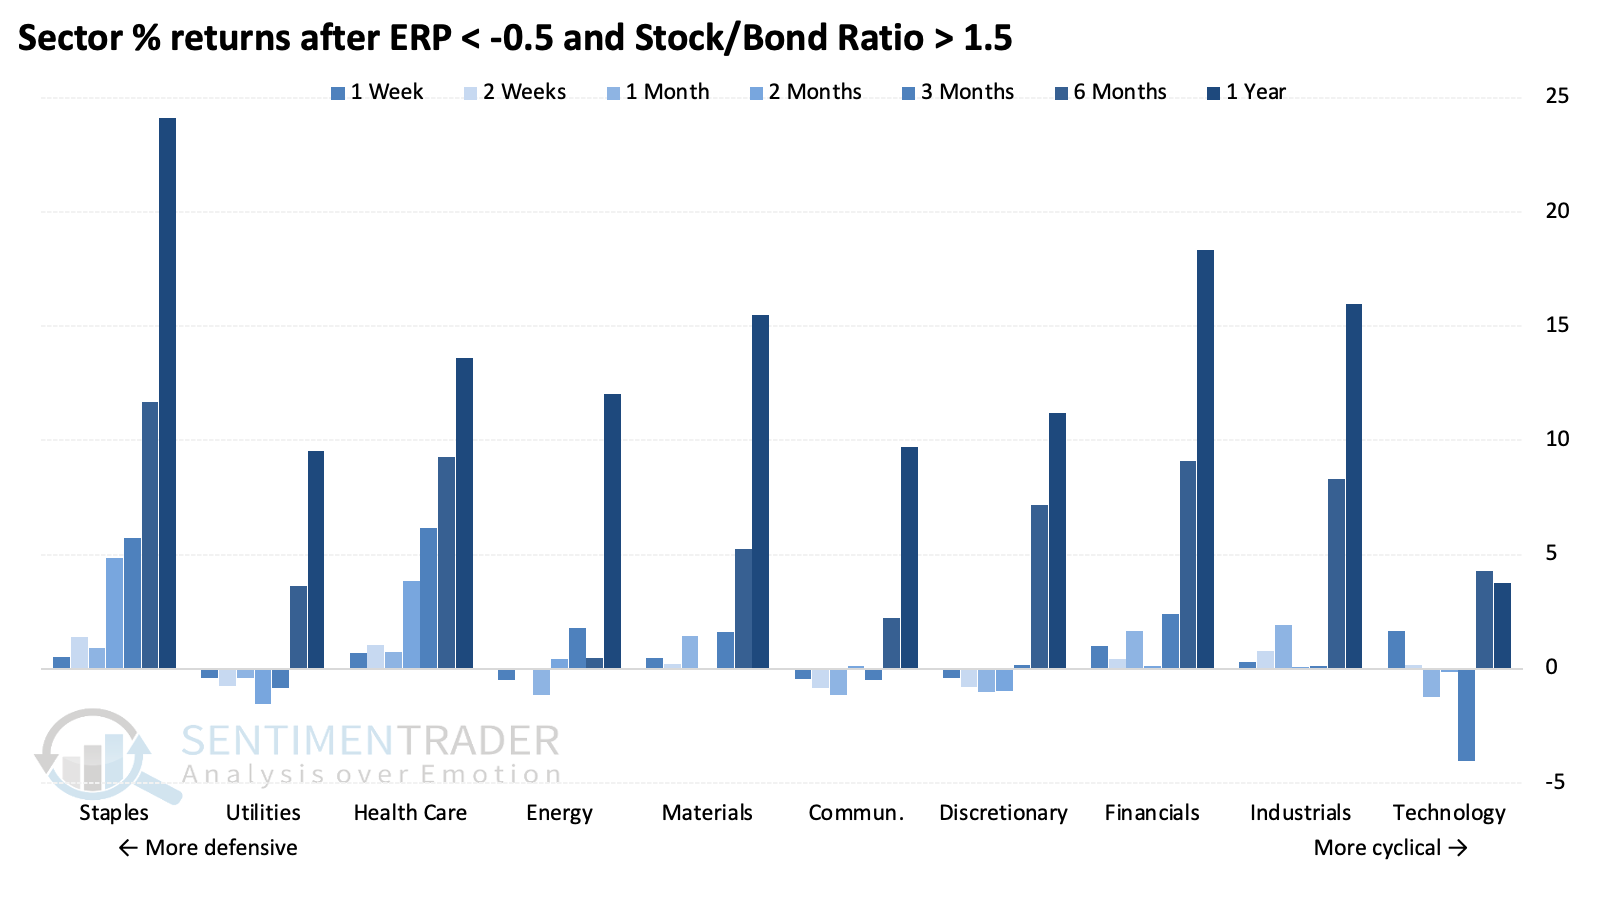
Defensive stocks were the most consistent winners, with the highest probability of a positive return across time frames.
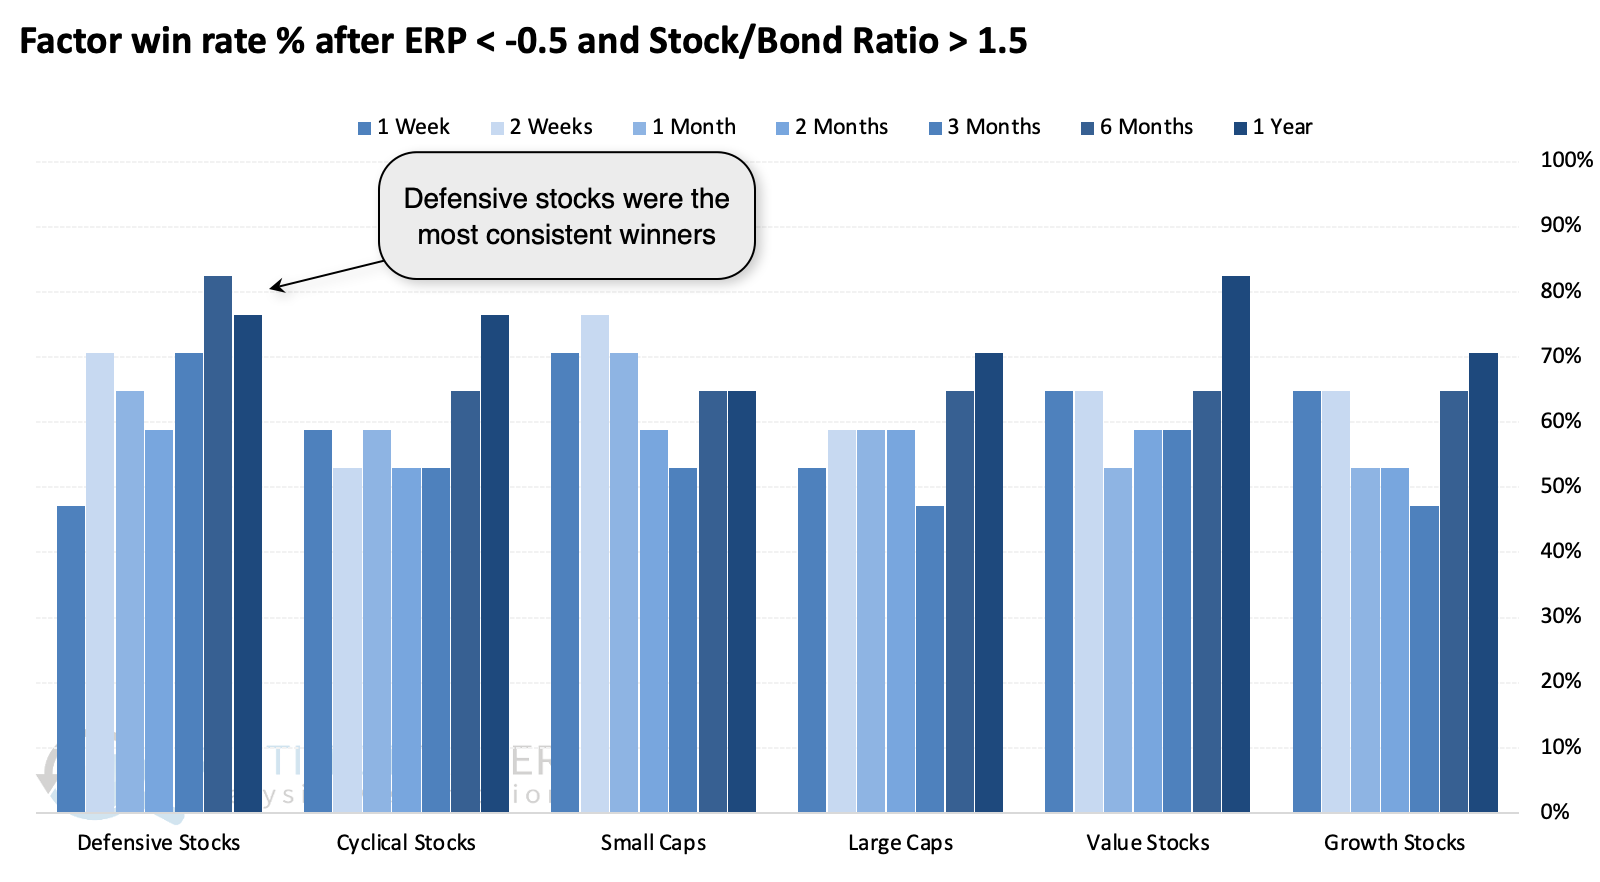
That high win rate was largely due to consumer staples, which led all sectors in average returns across time frames.
What the research tells us...
Since mid-April, most of what we've discussed has been modestly to extremely bullish for future stock returns, with a preference for cyclical and high-beta sectors. There really hasn't been much that countered those arguments.
Now that stocks have rallied and bonds stagnated, their relationship has moved to extremes. Correlations among assets are never fixed and can move opposite to historical patterns for months or years. Even so, by the time the yield differential has reached the level it's at now, stocks have become less compelling. There are almost always exceptions, and we've seen that in some of the dates above. However, the "easy" bias toward stocks has become significantly less easy for those making asset allocation decisions.