Data &
Technology
Research
Reports
Report Solutions
Reports Library
Actionable
Strategies
Free
Resources
Simple Backtest Calculator
Simple Seasonality Calculator
The Kelly Criterion Calculator
Sentiment Geo Map
Public Research Reports
Free Webinar
Pricing
Company
About
Meet Our Team
In the News
Testimonials
Client Success Stories
Contact
Log inLoginSign up
< BACK TO ALL REPORTS

A divergence in new lows suggests a bounce

Dean Christians
2022-01-27
New lows contracted significantly as the S&P 500 closed at a new low, suggesting stocks can bounce.

Key points:

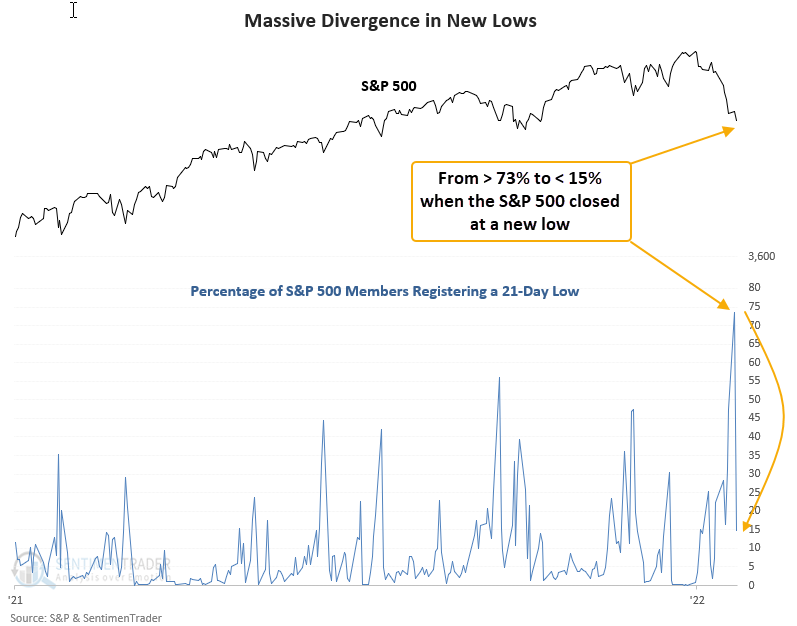
  • The number of S&P 500 members registering a 21-Day low surged above 73% on Monday
  • On Tuesday, the S&P 500 index closed at a new low, but 21-day lows were less than 15%
  • The S&P 500 has rallied 92% of the time after other signals

Measuring a divergence in new lows

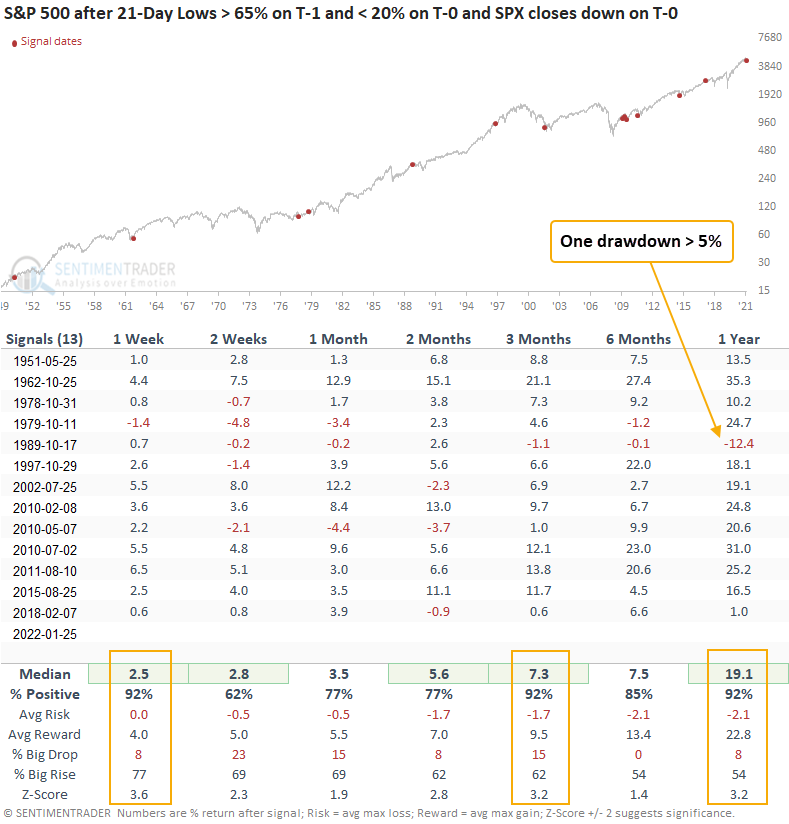
Let's assess the outlook for the S&P 500 index when the number of S&P 500 members registering a 21-day low >= 65% on T-1 and <= 20% on T-0. And, the S&P 500 index closes down on T-0. I adjusted the threshold levels to include more signals.

The S&P 500 rallied 92% of the time after other signals

This signal has triggered 13 other times over the past 71 years. After the others, S&P 500 future returns, win rates, and z-scores look excellent across all time frames. The study shows only 1 drawdown greater than 5% across all time frames.

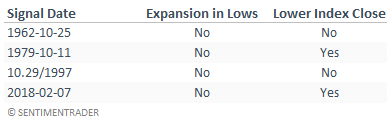
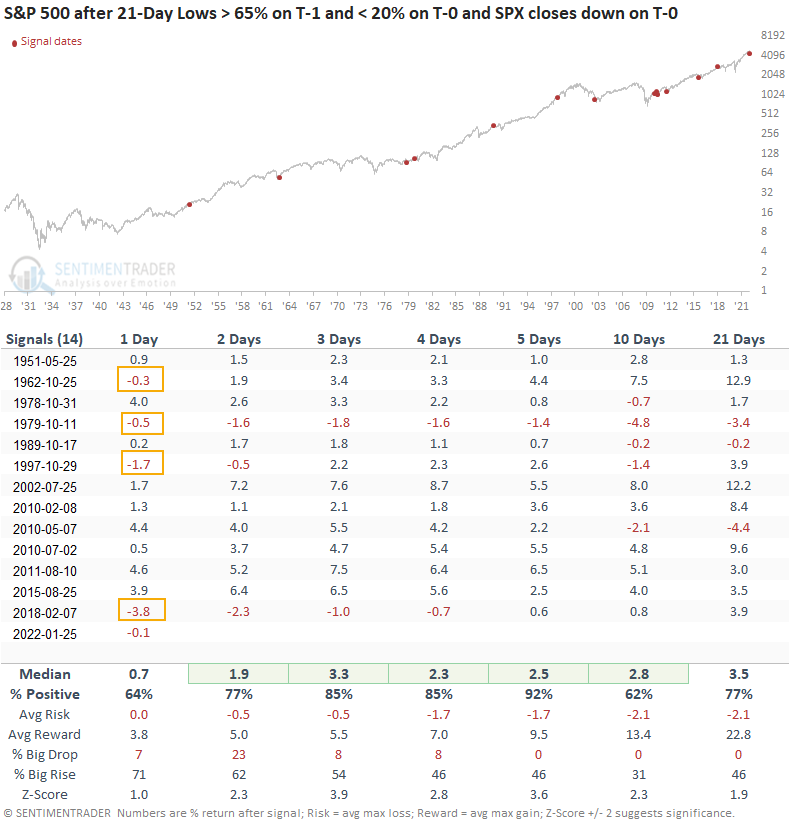
What happens when the S&P 500 closes down on the day after the signal

The short-term table shows 4 other instances with a negative return 1-day post the divergence signal. In all 4 cases, new lows did not expand above the maximum level achieved during the entire drawdown period. However, 2 of the instances show that the S&P 500 closed below the lowest close during the drawdown period. In 1979 and 2018, the S&P 500 declined by an additional 4.8% and 3.8%, respectively. Furthermore, the S&P 500 recaptured the signal date close within 31 days in 1979 and 5 days in 2018.

What the research tells us...

When new lows contract as an index closes at a new low, the improvement in market breadth creates a bullish divergence pattern. Similar setups to what we're seeing now have preceded rising stock prices with solid risk/reward profiles across all time frames. When it comes to divergence signals for new lows, all bets are off if lows expand beyond the maximum level achieved during the drawdown period.

Sorry, you don't have access to this report

Upgrade your subscription plan to get access
Go to Dasboard
DATA &
TECHnologies
IndicatorEdge
‍
BackTestEdge
‍
Other Tools
‍
DataEdge API
RESEARCH
reports
Research Solution
‍
Reports Library
‍
actionable
Strategies
Trading Strategies
‍
Smart Stock Scanner
‍
FREE
RESOUrCES
Simple Backtest
Calculator
Simple Seasonality
Calculator
The Kelly Criterion
Calculator
Sentiment Geo Map
‍
Public Research Reports
‍
Free Webinar
COMPANY
‍
About
‍
Meet our Team
‍
In the News
‍
Testimonials
‍
Client Success Stories
Pricing
Bundle pricing
‍
Announcements
‍
FAQ
© 2024 Sundial Capital Research Inc. All rights reserved.
Setsail Marketing
TermsPrivacyAffiliate Program
Risk Disclosure: Futures and forex trading contains substantial risk and is not for every investor. An investor could potentially lose all or more than the initial investment. Risk capital is money that can be lost without jeopardizing ones’ financial security or life style. Only risk capital should be used for trading and only those with sufficient risk capital should consider trading. Past performance is not necessarily indicative of future results.

Hypothetical Performance Disclosure: Hypothetical performance results have many inherent limitations, some of which are described below. No representation is being made that any account will or is likely to achieve profits or losses similar to those shown; in fact, there are frequently sharp differences between hypothetical performance results and the actual results subsequently achieved by any particular trading program. One of the limitations of hypothetical performance results is that they are generally prepared with the benefit of hindsight. In addition, hypothetical trading does not involve financial risk, and no hypothetical trading record can completely account for the impact of financial risk of actual trading. for example, the ability to withstand losses or to adhere to a particular trading program in spite of trading losses are material points which can also adversely affect actual trading results. There are numerous other factors related to the markets in general or to the implementation of any specific trading program which cannot be fully accounted for in the preparation of hypothetical performance results and all which can adversely affect trading results.

Testimonial Disclosure: Testimonials appearing on this website may not be representative of other clients or customers and is not a guarantee of future performance or success.