Products
SentimenTrader Trading Tools
‍
Backtest Engine
My Trading Toolkit
Correlation Analysis
Seasonality
Market Prediction
Indicators & Data API
‍
Proprietary Indicators & Charts
Market Data API
Strategies & Scanner
‍
50+ Trading Strategies
Smart Stock Scanner
Smart Option Scanner
Research Reports
‍
Research Solutions
Reports Library
Free Resources
Simple Backtest Calculator
Simple Seasonality Calculator
The Kelly Criterion Calculator
Sentiment Geo Map
Public Research Reports
Education
Sentiment Indicators
Technical Indicators
Pricing
Company
About
In the News
Testimonials
Client Success Stories
Contact
Log inLoginSign up
< BACK TO ALL REPORTS

A divergence in new lows bodes well for stocks

Dean Christians
2022-09-28
A bullish divergence pattern for the S&P 500 occurred on Tuesday when the percentage of issues at a 252-day low did not exceed the previous peak as the index registered a lower low. After similar divergences, the S&P 500 had a positive upward bias, especially in the near term.

Key points:

  • The S&P 500 fell below the lowest low in the last 100 sessions
  • At the same time, the percentage of issues at a 252-day low did not exceed the previous peak 
  • After similar divergences, the S&P 500 had a positive upward bias, especially in the near term
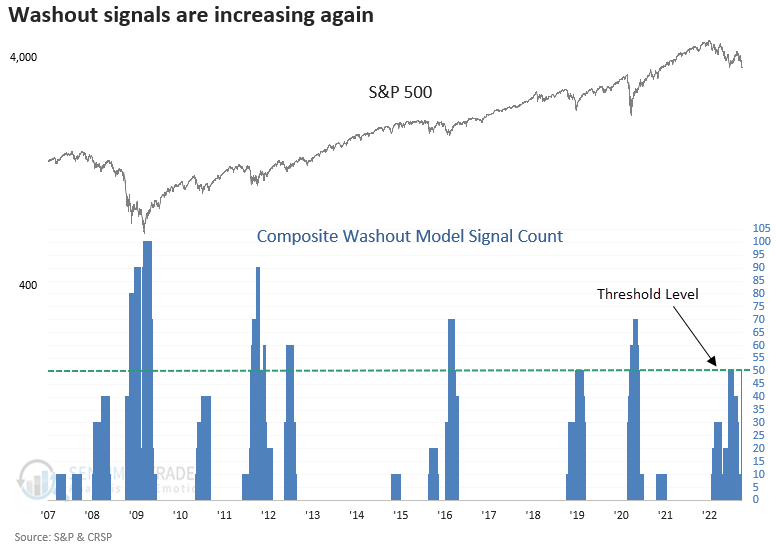
  • The Composite Washout Model count increased to 50%, with several new alerts

A divergence in new lows is a hallmark of a bear market bottom

The S&P 500 registered a lower low on Tuesday when it fell below the intraday low from June, which triggered a technical pattern known as a divergence. The setup occurs when an index and an indicator move in opposite directions or fail to confirm each other. 

The Composite Washout Model contains three models that measure a divergence between the S&P 500 and the percentage of issues at a 21, 63, and 252-day low.

Bear market bottoms are a process. The divergence between an index and the percentage of issues at a new low is one of the best ways to identify a potential counter-trend rally or a bearish to a bullish trend change.

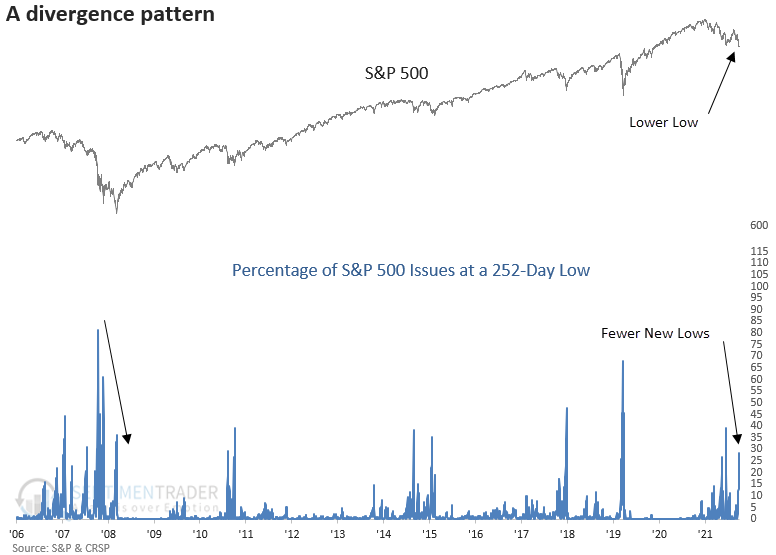
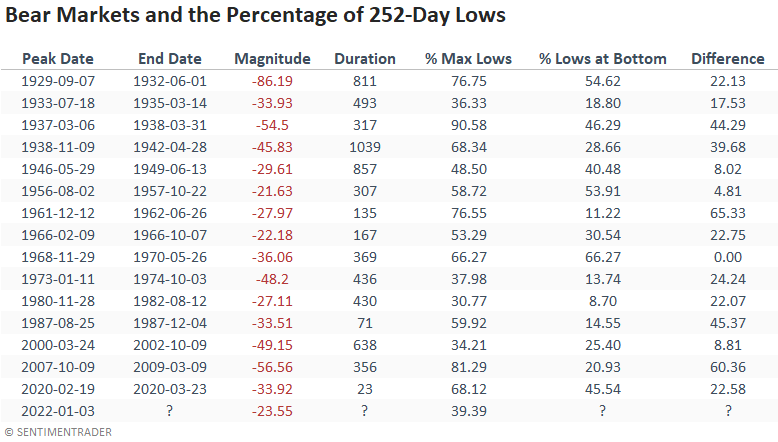
The highest level of 252-day lows, otherwise known as the maximum point of pain for index issues, typically occurs well before the final low in the index. The 1968-70 bear market is one of the rare exceptions when the maximum percentage of issues at a low coincided with the absolute low in the index.

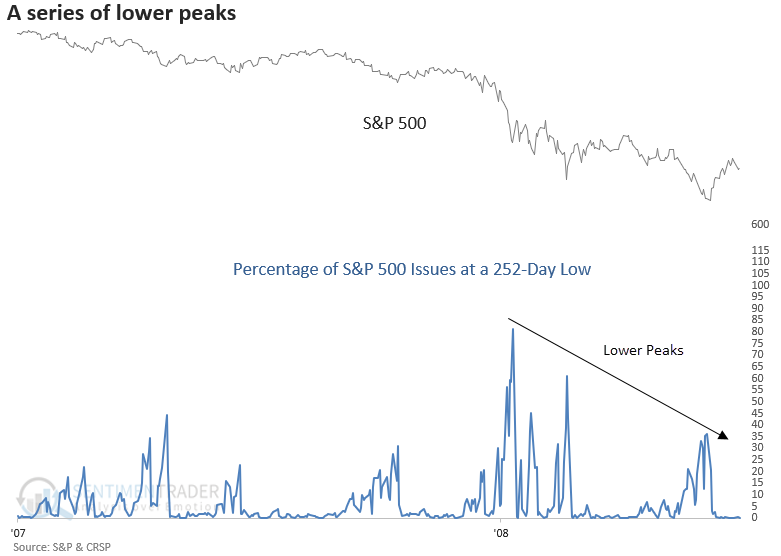
It's important to note that new lows can show a series of lower peaks in bear markets. For example, the internal low occurred in October 2008 when more than 80% of issues achieved a 252-day low. However, the index bottomed in March 2009, with only 20% of issues at a low.

Similar divergence patterns in new lows preceded positive returns 

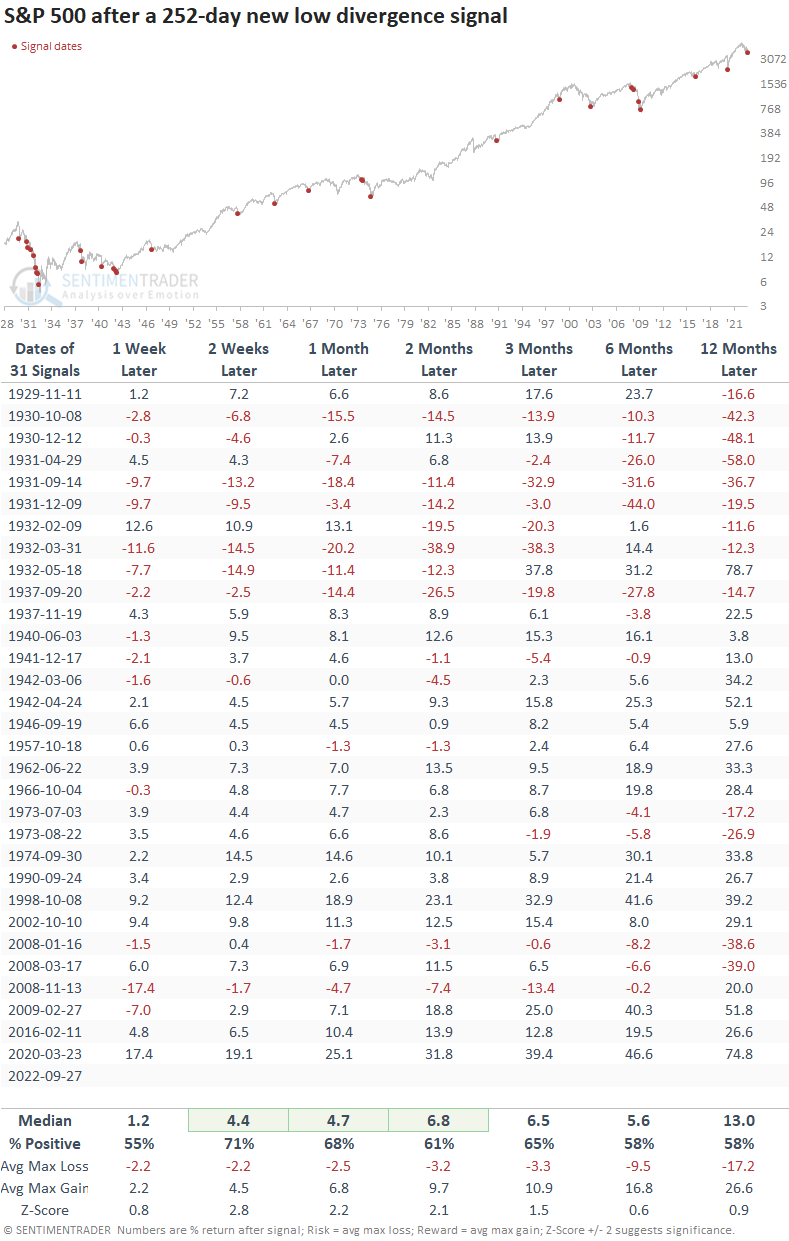
The new lows divergence signal shows favorable returns, win rates, and z-scores, especially in the first few months. As with most historical studies that include the 1929-32 bear market, the outlook improves dramatically post that period. 

I would also note that the signal occurred several times in brutal bear markets like 1973-74, 2000-02, and 2007-08. In most cases, the S&P showed a positive return at some point in the first month. 

Several Composite Washout Model members triggered an alert

Over the last five weeks, the relentless equity market decline created an oversold condition for several breadth-based indicators in the Composite Washout Model. On Tuesday, the composite count increased to 50%, with four new alerts. 

New Signals:

  1. 252-day Low Divergence
  2. 63-Day Low Divergence
  3. Breadth Washout
  4. Volume Washout

With the Composite Washout Model count increasing to 50%, a new signal will trigger if S&P 500 price momentum turns positive. 

What the research tells us...

The relentless decline over the last five weeks pushed the S&P 500 to a new cycle low. However, while the S&P 500 traded to a new low, several issues within the index failed to register a new 252-day low, creating what is known as a bullish divergence pattern. With several other members in the Composite Washout Model triggering an alert in conjunction with the divergence signal, the weight of the evidence is building for another counter-trend rally.

PRODUCTS
SentimenTrader
Trading Tools
Indicators & Data API
‍
Strategies & Scanner
‍
Research Reports
FREE
RESOUrCES
Simple Backtest
Calculator
Simple Seasonality
Calculator
The Kelly Criterion
Calculator
Sentiment Geo Map
‍
Public Research Reports
‍
Education
Sentiment Indicators
‍
Technical Indicators
‍
Pricing
Bundle pricing
‍
FAQ
‍
Announcements
‍
COMPANY
‍
About
‍
In the News
‍
Testimonials
‍
Client Success Stories
CONTACT
‍
General Inquiries
‍
Media Inquiries
‍
Financial Professionals Inquiries
‍
© 2026 Sundial Capital Research Inc. All rights reserved.
Setsail Marketing
TermsPrivacyAffiliate Program
Risk Disclosure: The information and tools provided are for research and analytical purposes only and are not intended as investment advice. Market analysis involves uncertainty, and outcomes may differ from expectations. Users should conduct their own due diligence and consider their individual circumstances before making any financial decisions. Past performance is not necessarily indicative of future results.

Hypothetical Performance Disclosure: Hypothetical performance results have many inherent limitations, some of which are described below. No representation is being made that any account will or is likely to achieve profits or losses similar to those shown; in fact, there are frequently sharp differences between hypothetical performance results and the actual results subsequently achieved by any particular trading program. One of the limitations of hypothetical performance results is that they are generally prepared with the benefit of hindsight. In addition, hypothetical trading does not involve financial risk, and no hypothetical trading record can completely account for the impact of financial risk of actual trading. for example, the ability to withstand losses or to adhere to a particular trading program in spite of trading losses are material points which can also adversely affect actual trading results. There are numerous other factors related to the markets in general or to the implementation of any specific trading program which cannot be fully accounted for in the preparation of hypothetical performance results and all which can adversely affect trading results.

Testimonial Disclosure: Testimonials appearing on this website may not be representative of other clients or customers and is not a guarantee of future performance or success.