
A different perspective on the Nikkei "Crash"

Key points
- The Nikkei Index lost -12.4% in one day on 2024-08-05
- The Nikkei also registered a 3-day decline of -19.4% on the same day
- Short-term selloffs of this magnitude have typically been followed by better price action - often in short-order
A one-day collapse in the Nikkei Index…
On 2024-08-05, the venerable Nikkei Index plunged -12.4% in a single day. The chart below shows all dates since 1970 when the Nikkei lost 7.9% or more in a single day.
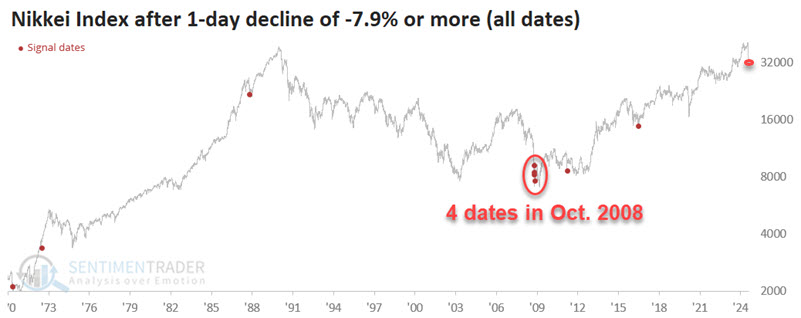
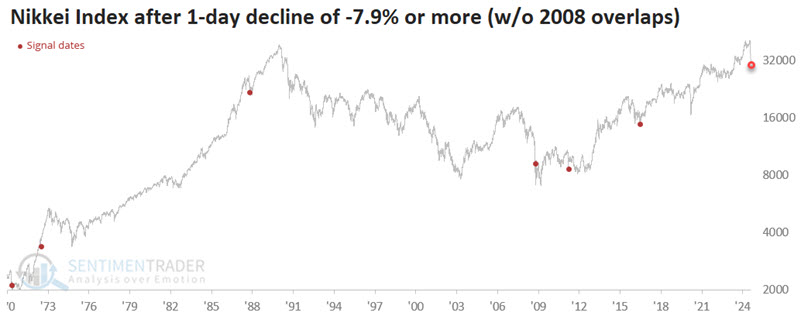
Note that four dates met these criteria in October 2008. Let's remove the overlapping dates for testing purposes. The new chart appears below.
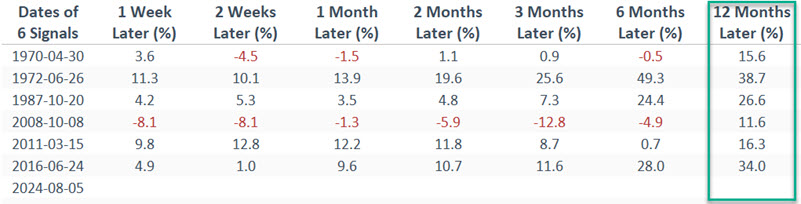
The table below displays subsequent Nikkei performance following the dates highlighted in the chart above.
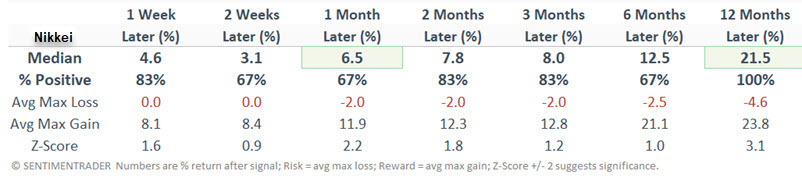
The table below summarizes subsequent Nikkei performance,
…also a three-day collapse in the Nikkei Index
On the close of trading on 2024-08-05, the Nikkei Index registered a 3-day decline of -19.4%. The chart below shows all dates since 1970 when the Nikkei lost 10% or more over a 3-day period.
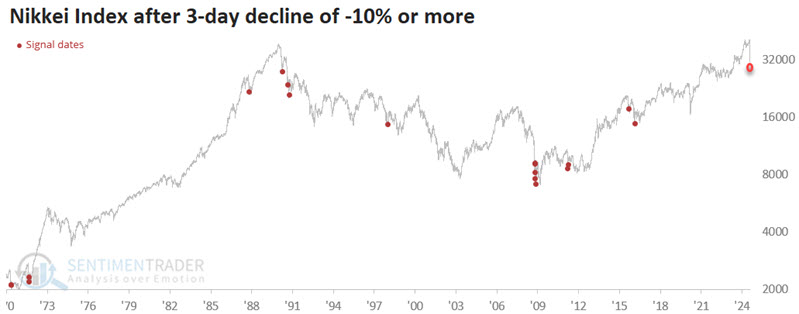
The table below displays subsequent Nikkei performance following the dates highlighted in the chart above.
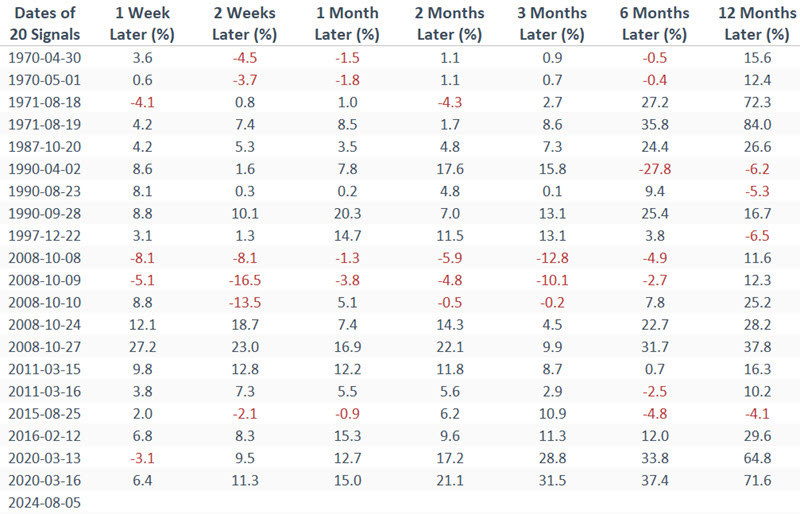
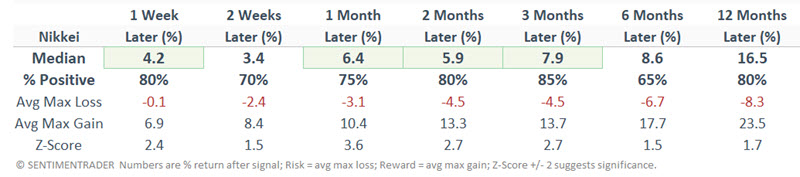
The table below summarizes the subsequent Nikkei performance.
Putting the two together
Now, let's put the two together into a simple strategy that applies the following rules:
- If the Nikkei Index registers a 1-day loss of -7.9% or more OR a 3-day loss of -10% or more, buy and hold the Nikkei for 12 months
- If a new signal occurs within those 12 months, then extend the holding period another 12 months
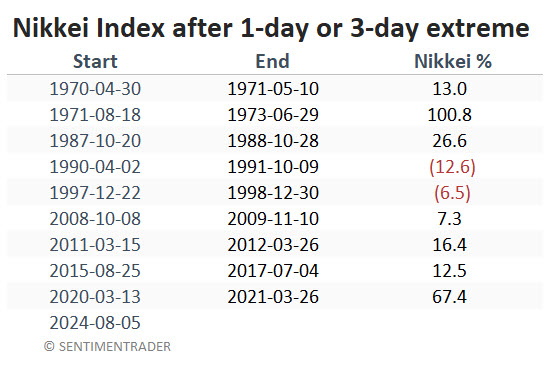
The chart below displays the hypothetical growth of $1 invested using this strategy.
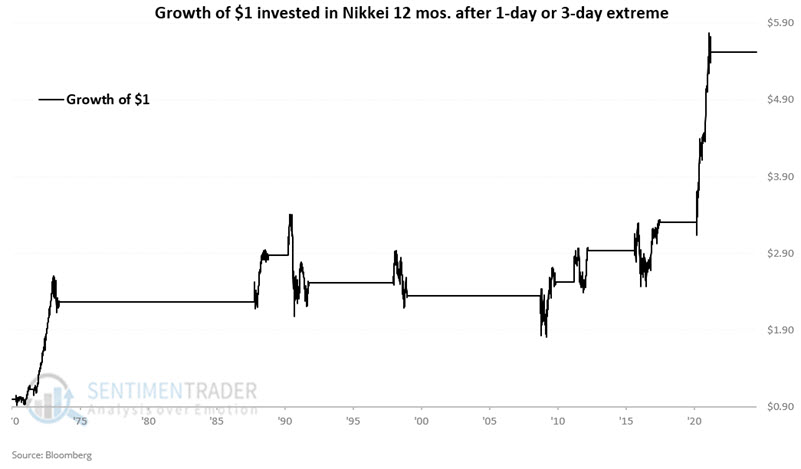
The table below displays the entry and exit dates using the rules above and the percentage change for the Nikkei Index during each favorable period.
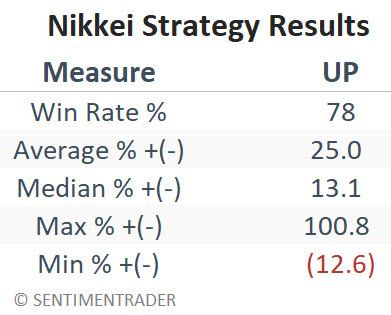
The table below summarizes the results of the holding periods above.
What the research tells us…
Is the message that investors should buy and hold the Nikkei Index through thick and thin over the next twelve months? Not really. The message is that the index suffered a selloff of such significant magnitude that historically, the decline may have essentially "cleared the decks" and set the stage for a subsequent advance. While there are never any guarantees, the message appears to be that investors and traders should look for opportunities to play the long side of the Nikkei Index in the year ahead.