
A deteriorating environment in the Asia-Pacific region

Key points:
- Several breadth and price momentum indicators triggered risk-off signals for the Asia-Pacific region
- After similar alerts, returns for an Asia-Pacific index were negative over the next few months
The weight of the evidence turns unfavorable for the Asia-Pacific region
In a recent note, I shared several trend-following sell signals for Chinese ETFs and stocks. At the time, the rest of the Asia-Pacific region still looked constructive. The favorable outlook didn't last long as several breadth and price momentum indicators triggered risk-off signals for the manufacturing-heavy area.
On Friday, every single Asia-Pacific country ETF closed at a 21-day low. The synchronized expansion in lows is troubling as it typically only occurs within the context of bear markets.
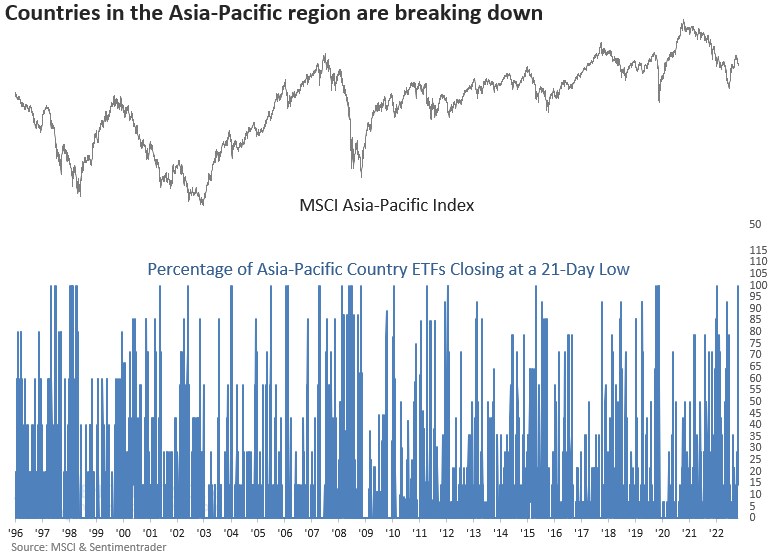
Similar spikes in new lows preceded negative returns
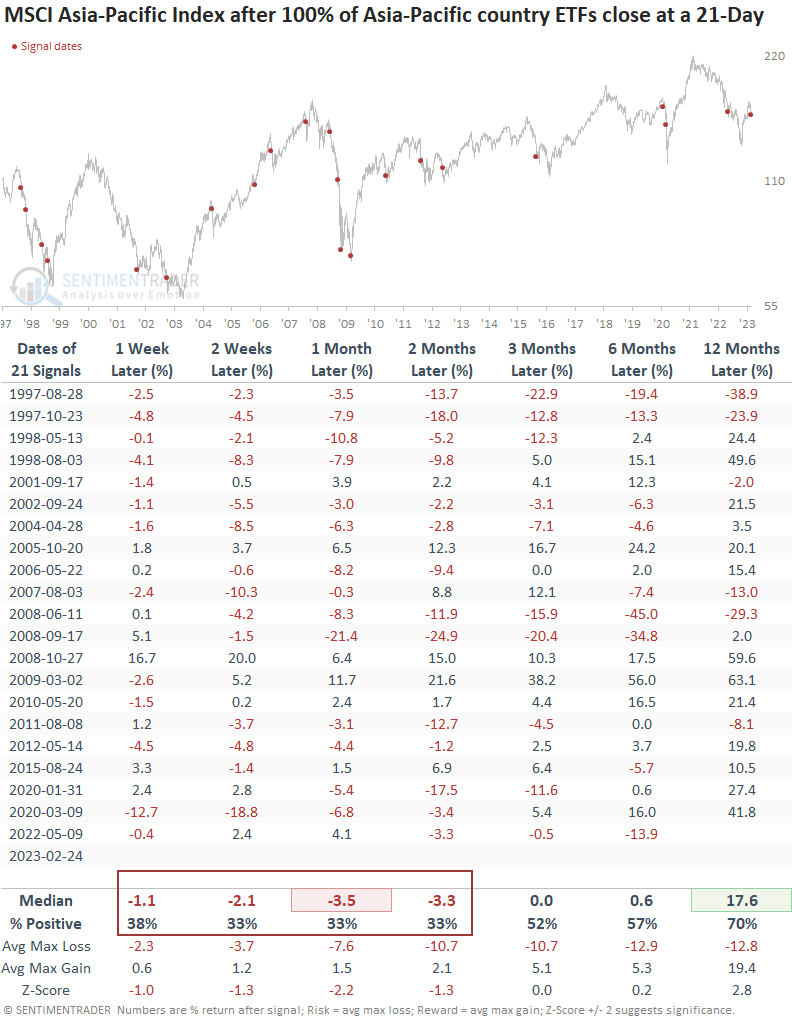
When every Asia-pacific country ETF closes at a 21-day low, the MSCI Asia-Pacific Index struggles over the next few months. The signal shows a loss at some point over that time frame in 19 out of 21 cases.
After a significant rally from October 2022, a pullback/consolidation makes sense.
Participation trends across several time frames turn adverse
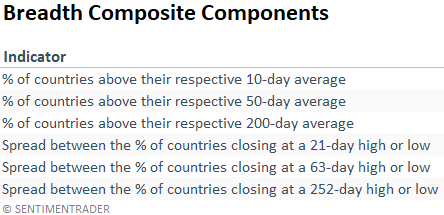
A breadth composite that measures participation trends for country ETFs in the Asia-Pacific region registered a risk-off signal.
Suppose I assess returns based on a bracket methodology. In that case, annualized returns look abysmal when the composite falls below zero, which is the case now.
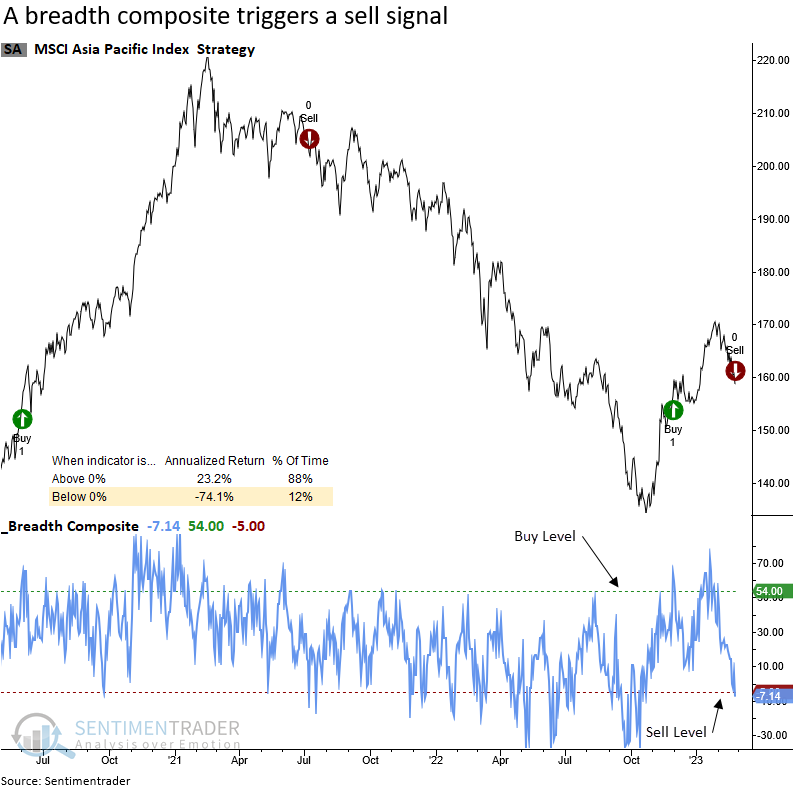
When I apply the breadth composite risk-off signals to an outlook table, returns are negative over the next month. The historical precedents show a loss at some point over that time frame in 20 out of 26 cases.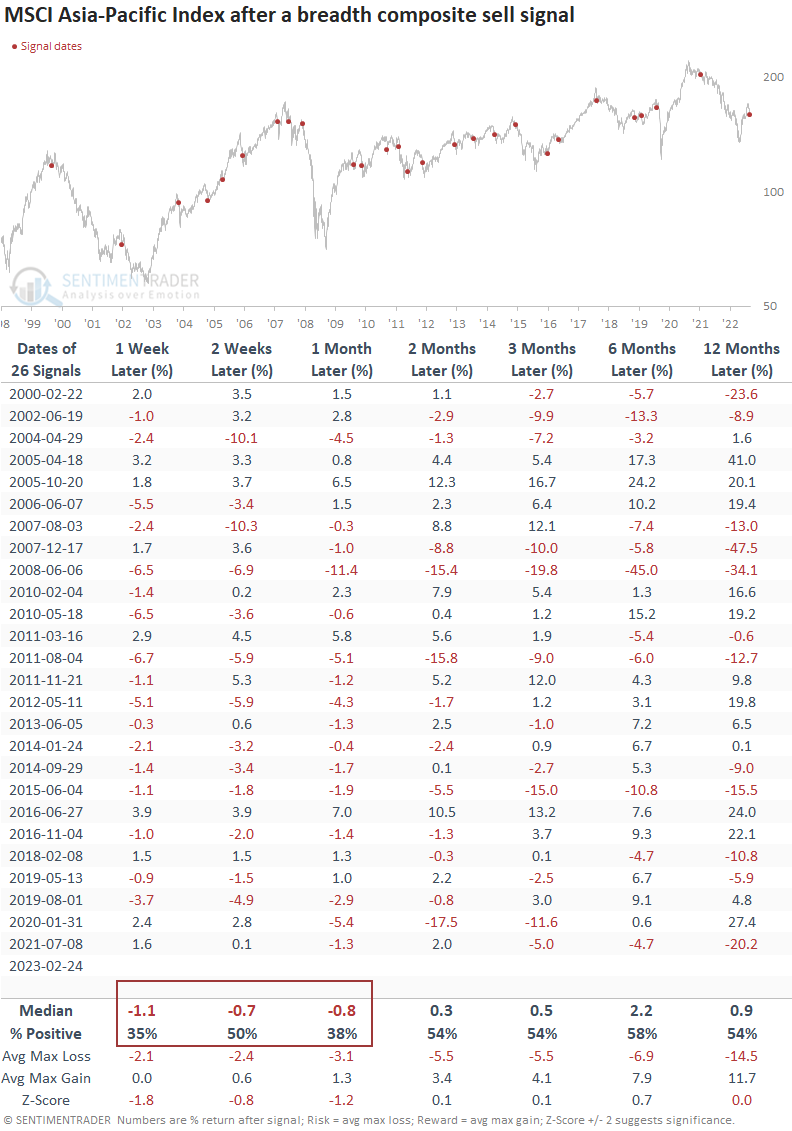
A composite that measures price momentum for Asia-Pacific country ETFs
The Relative Strength Index (RSI), a momentum indicator developed by J. Welles Wilder Jr., can be applied to individual stocks within an index or a basket of ETFs to create a composite similar to the often-mentioned percentage of issues above the 50-day average.
The calculation I use for the RSI composite is simple. Suppose the RSI indicator exceeds 70 for a stock or ETF. In that case, the composite considers the RSI trend positive until the RSI crosses below 34. When it falls below 34, the trend is negative until the RSI increases above 70. I apply the same calculation to all securities in an index or a basket of ETFs to measure the percentage of members on an RSI buy signal.
As an example, when the RSI for the S&P 500 crosses above 70 and remains above 34, the index shows an annualized return of 11.4%. In contrast, when the RSI crosses below 34 and remains below 70, the index annualizes at 4.5%. So, overbought conditions are bullish, not bearish.
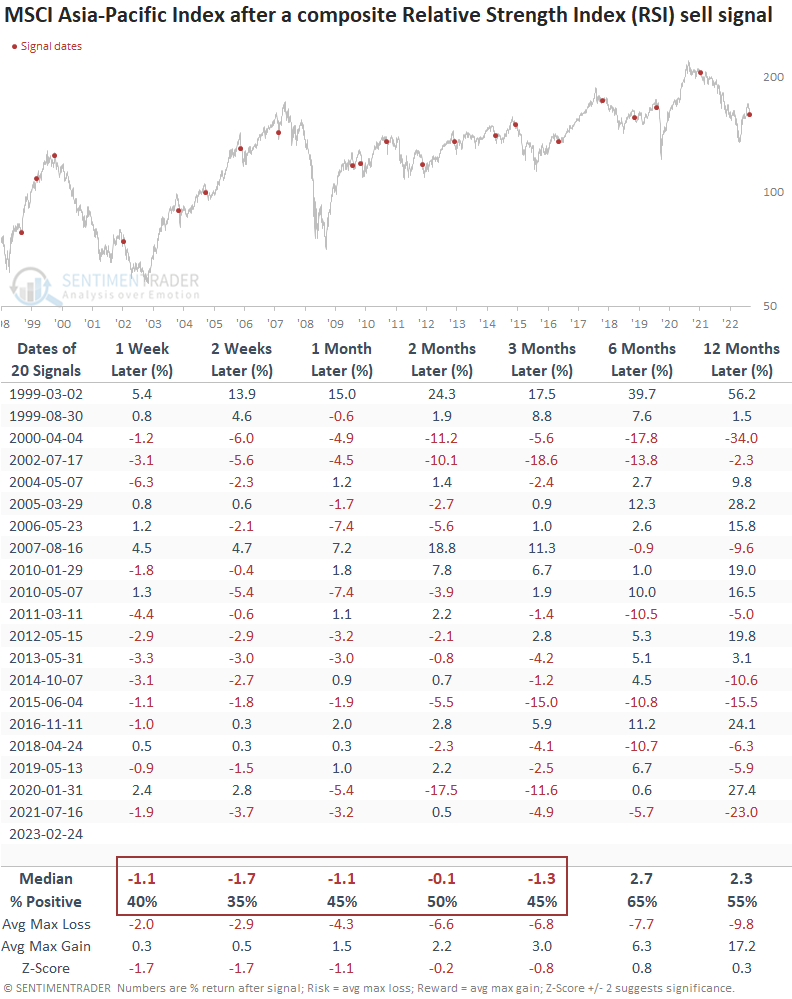
On Friday, the percentage of Asia-Pacific country ETFs on an RSI buy signal declined below 28%, triggering a risk-off alert. Similar to the breadth composite, an assessment of annualized returns looks unfavorable when the composite falls below 25%, which is the case now.
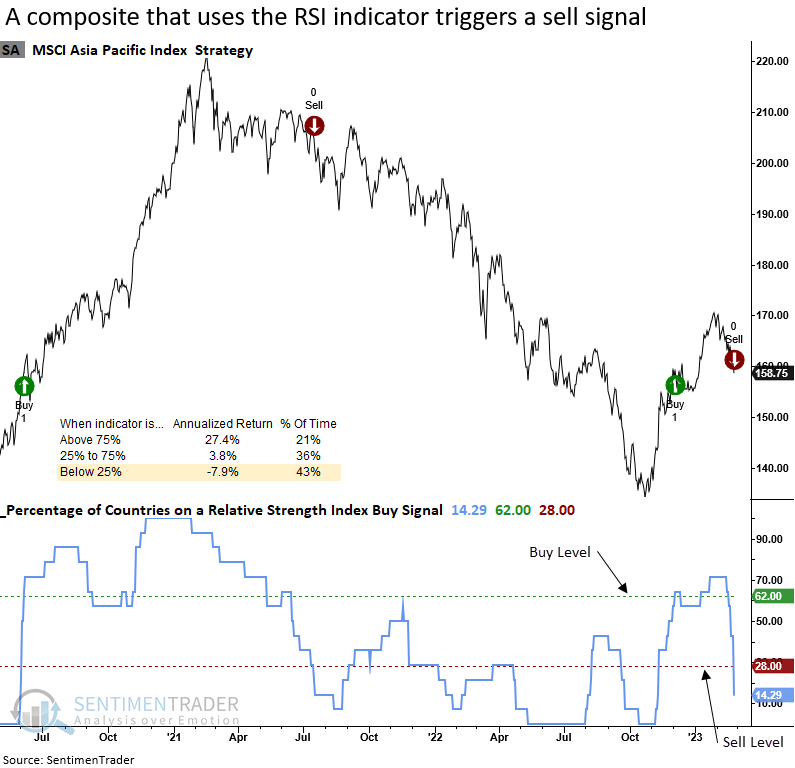
From a trading signal standpoint, when the composite crosses below 28%, the MSCI Asia-Pacific index looks unfavorable for the next three months. i.e., negative momentum begets more negative momentum.
What the research tells us...
After a significant rally from the low in October 2022, the Asia-Pacific region shows signs of fatigue. Several breadth and momentum indicators triggered risk-off signals last week. With the alerts pointing to an unfavorable outlook over the next few months, I would take a wait-and-see approach. We no longer have an environment where the tide lifts all boats.