
A delayed signal from SPY breadth - Part II

Key Points
- In my last piece, we looked at one way to play a signal from the SPY breath (% > 50-day avg) indicator
- In this piece, we will consider one simple change that may boost results significantly
The signal
As a quick review, a signal occurs when the percentage of stocks in the S&P 500 Index drops below 6.0. The chart below displays each time this has happened since 1999.
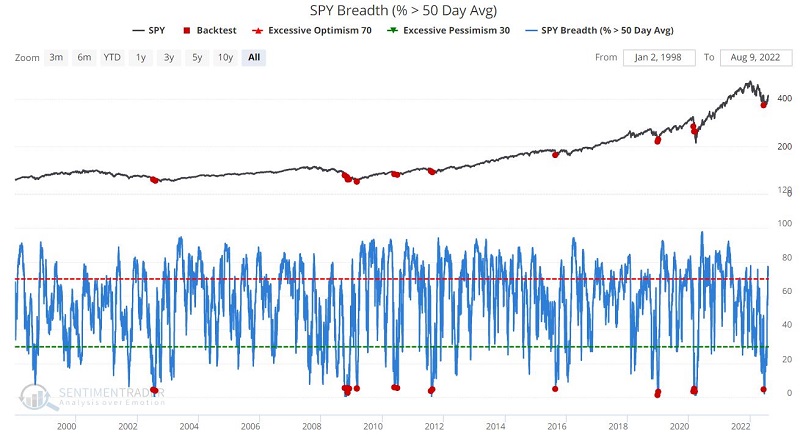
In the original article, we noted that results during the first two months often experience above-average volatility, but between 2 months and 12 months, returns are universally positive.
Our original trading approach
The trading approach analyzed in the previous article employed the following rules:
- An initial signal occurs when SPY Breath (50-day avg) drops below 6 for the first time in twelve months
- For the 1st two months after a signal, we remain flat
- For months 3 through 12, hold ticker SPY
- Following any new signal that occurs within twelve months of an initial signal, the holding period is extended for another twelve months
An alternative trading approach
The only thing different with this alternative approach is the index traded. Instead of trading an ETF that tracks the S&P 500 Index, we will trade an ETF that tracks the Nasdaq 100 index:
- An initial signal occurs when SPY Breath (50-day avg) drops below 6 for the first time in twelve months
- For the 1st two months after a signal, we remain flat
- For months 3 through 12, hold ticker QQQ
- Following any new signal that occurs within twelve months of an initial signal, the holding period is extended for another twelve months
Comparing results
The two tables below display a performance summary for SPY and QQQ following the signals in the first chart above.
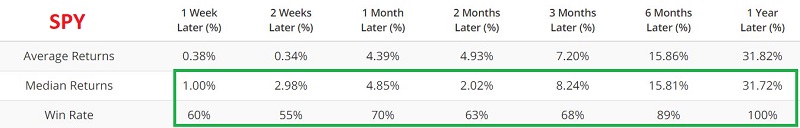
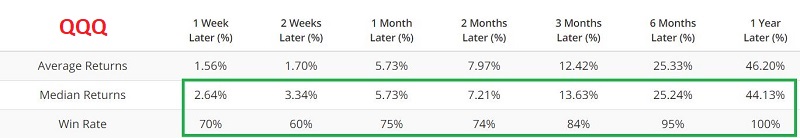
Note that QQQ performance has been better across every metric.
The first two months
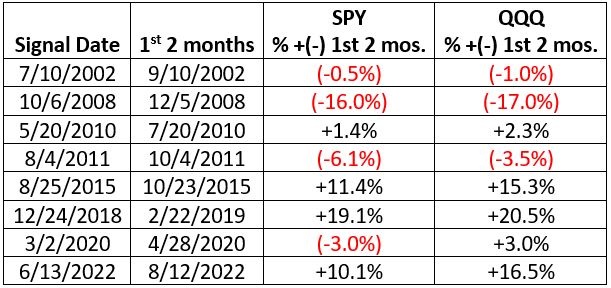
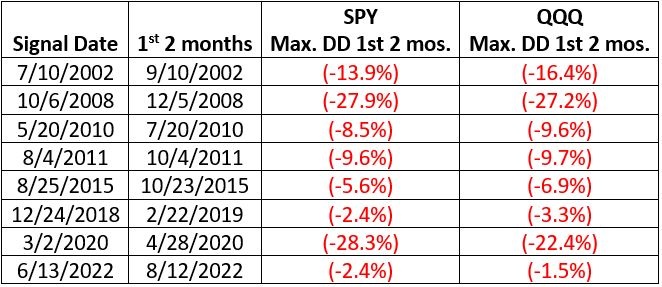
According to our rules, we are out of the market for the first two months after an initial signal. The tables below display the profit/loss that would have been missed and the drawdowns that would have been avoided by sitting out the first two months.
The table below displays the profit/loss for SPY and QQQ during the first two months after an initial signal.
The table below displays the maximum drawdown for SPY and QQQ during the first two months after an initial signal.
Months 3 through 12+
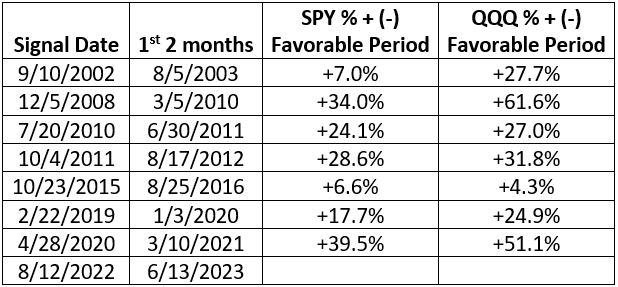
Our Favorable Period extends from two months after the initial signal through twelve months after the initial signal - unless another signal occurred within that period, in which case the favorable period begins two months after the initial signal and ends twelve months after the last overlapping signal.
The chart below displays the cumulative % + (-) for SPY and QQQ if held only during Favorable Periods.
The table below displays the maximum drawdown for SPY and QQQ during the Favorable Period.
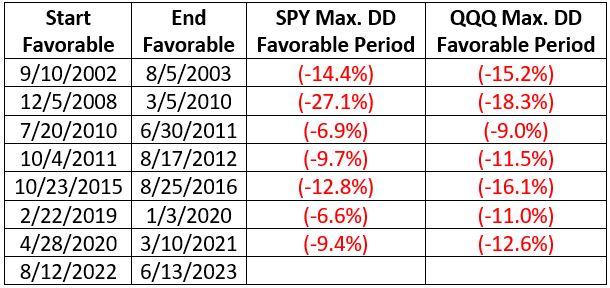
The tradeoff: QQQ experienced a larger drawdown during six favorable periods. However, in six of seven Favorable Periods, QQQ experienced a significantly larger gain than SPY.
How big is the difference? The chart below displays the cumulative % gain for SPY and QQQ held only during Favorable Periods.
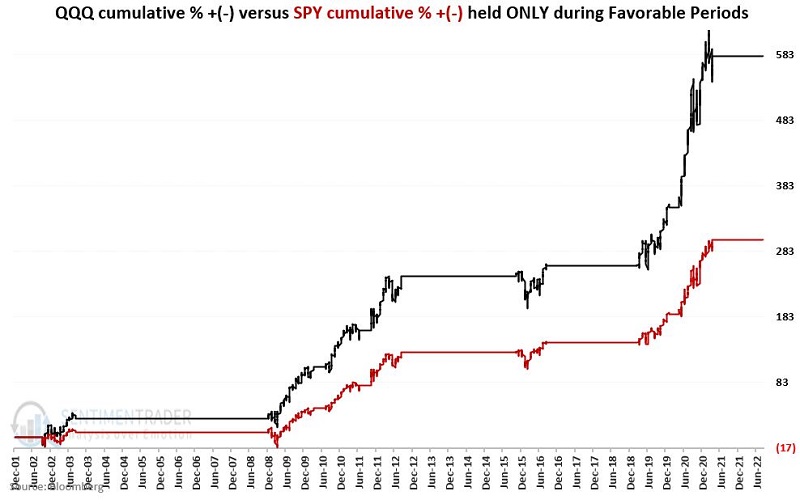
The cumulative hypothetical % +/- for QQQ is +580% versus +300% for SPY.
What the research tells us...
A deeply oversold condition often sets the stage for a meaningful market rally. However, as the stock market goes through the process of forming a bottom, it often thrashes about violently. By waiting a short time after an oversold indicator generates a signal, an investor may miss a lot of that volatility and jump in just as the upside reversal is beginning in earnest. The detailed results suggest that an investor may also increase performance by focusing on a slightly more volatile index (Nasdaq 100 via QQQ) rather than the S&P 500 Index via SPY.