
A delayed signal from SPY breadth

Key Points
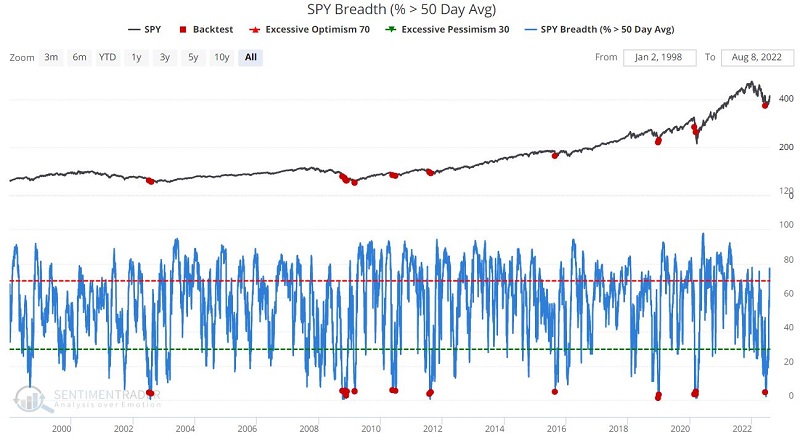
- The SPY Breath (% > 50-day avg) indicator reached an oversold level in June
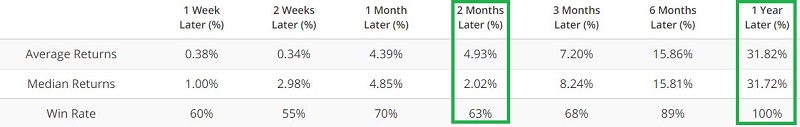
- Historically the first two months after such a signal has witnessed a lot of volatility and some significant drawdowns
- After the two-month mark, overall performance was decidedly favorable
The signal
A signal occurs when the percentage of stocks in the S&P 500 Index drops below 6.0. The chart and table below display historical results following all such signals - regardless of how close together they occur - using ticker SPY.
A trading approach
For our purposes:
- An initial signal occurs when SPY Breath (50-day avg) drops below 6 for the first time in twelve months
- For the 1st two months after an initial signal no position is held
- For months 3 through 12, hold ticker SPY
- Following any new signal that occurs within twelve months of an initial signal, the holding period is extended for another twelve months
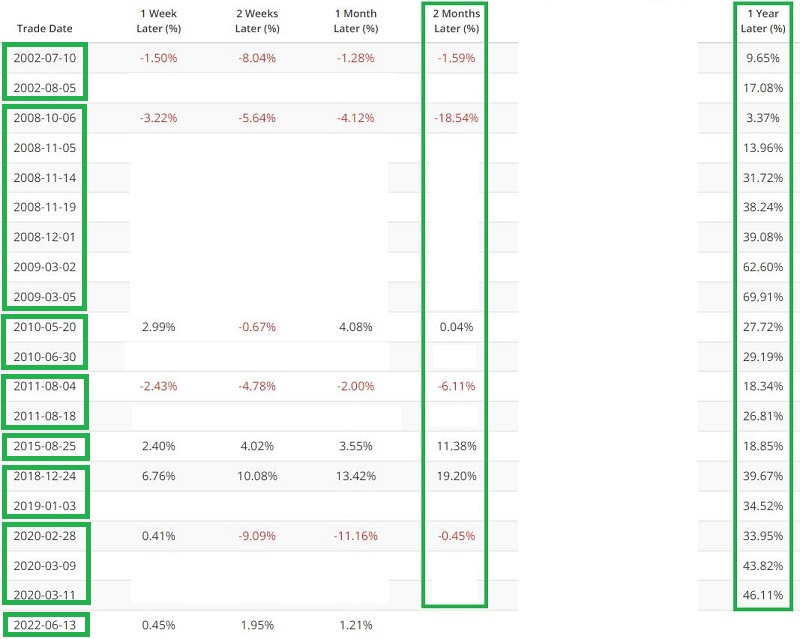
The table below displays the dates of each signal, including overlaps. Under "Trade Date," each green box contains the initial signal date and any subsequent overlapping signals (i.e., a new signal that occurs within twelve months of an initial signal). The "2 Months Later" column displays the return two months after the date of the initial signal. The "1 Year Later" column shows the 12-month return following each signal date, including overlapping signals.
Note that results during the first two months often experience above-average volatility, but returns are universally positive between two and twelve months.
Reminder: A Favorable Period begins two months after the initial signal and extends to twelve months after the date of the last overlapping signal.
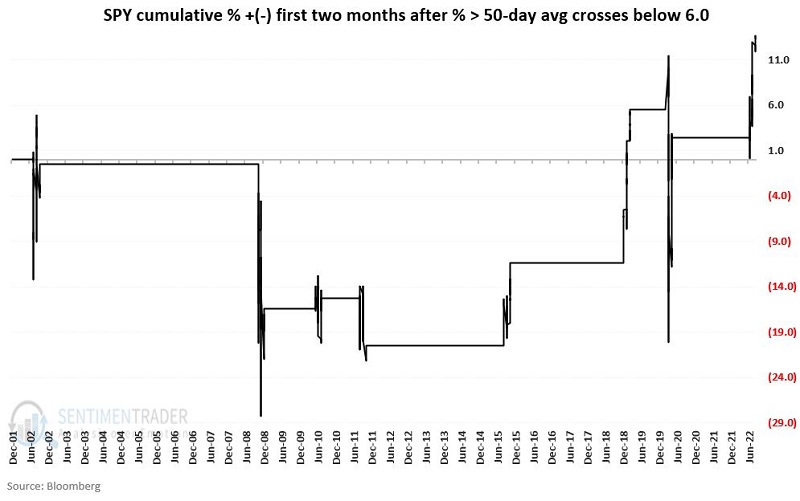
The first two months after an initial signal
The chart below displays the cumulative % + (-) for SPY if held only during the first two months after each new signal (not including overlaps).
The table below displays the % + (-) for SPY two months after the initial signal and the maximum drawdown incurred during those two months.
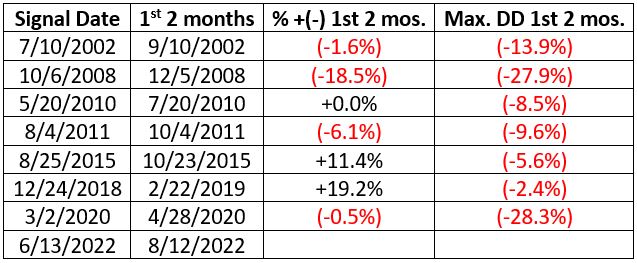
Note that profit or loss is a coin flip, but the average drawdown was -12.4%, and the median drawdown was -9.1%. Sitting out the first two months following a breadth signal avoided a lot of angst and volatility.
Months 3 through 12+
Our Favorable Period extends from two months after the initial signal through twelve months after the initial signal - unless another signal occurred within that period, in which case the favorable period begins two months after the initial signal and ends twelve months after the last overlapping signal.
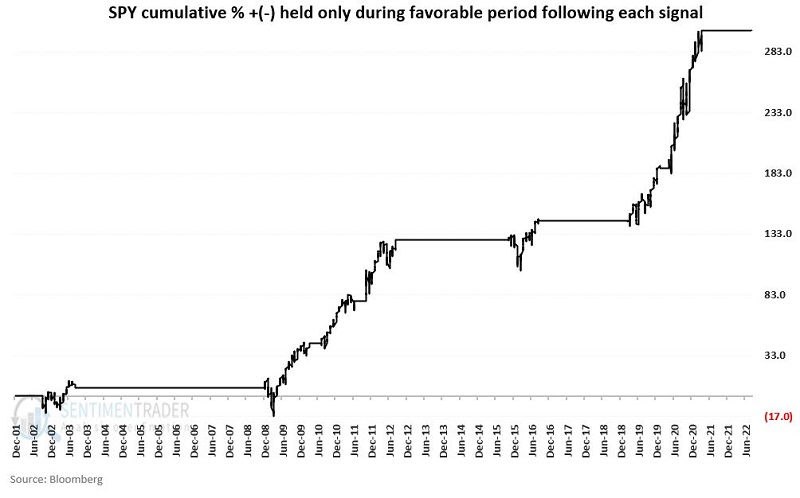
The chart below displays the cumulative % + (-) for SPY if held only during favorable periods.
The table below displays the performance for SPY during each Favorable period.
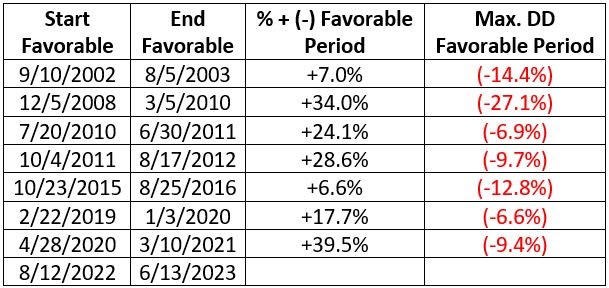
The most recent initial signal occurred on 6/13/2022. A new Favorable Period will begin at the close on 8/12/2022 and extend through at least 6/13/2023. If the SPY Breadth (50-day Avg) indicator drops below 6.0 before that date, the Favorable Period will be extended another twelve months from that date.
What the research tells us…
A deeply oversold condition exists when 94% or more of S&P 500 constituent stocks are below their respective 50-day moving averages at one time. This creates a potential buying opportunity for investors and, in the past twenty years, has invariably been followed by higher stock prices twelve months later (although there is no guarantee that this will always be the case ad infinitum into the future). However, as the stock market goes through the process of forming a bottom, it often thrashes about violently. When fear is generally at its peak, this extreme volatility can cause investors to stand aside or bail out completely, just as the market puts in a meaningful low. By waiting a short time after an oversold indicator generates a signal, an investor may miss a lot of that volatility and jump in just as the upside reversal is beginning in earnest.