Products
SentimenTrader Trading Tools
‍
Backtest Engine
My Trading Toolkit
Correlation Analysis
Seasonality
Indicators & Data API
‍
Proprietary Indicators & Charts
Market Data API
Strategies & Scanner
‍
50+ Trading Strategies
Smart Stock Scanner
Research Reports
‍
Research Solutions
Reports Library
Free Resources
Simple Backtest Calculator
Simple Seasonality Calculator
The Kelly Criterion Calculator
Sentiment Geo Map
Public Research Reports
Pricing
Company
About
In the News
Testimonials
Client Success Stories
Contact
Log inLoginSign up
< BACK TO ALL REPORTS

A day when everybody went in

Jason Goepfert
2020-03-25
The TICK shows that more than 60% of stocks traded on an uptick at the same time, a record high. Up volume on Tuesday was overwhelming.

Everybody in

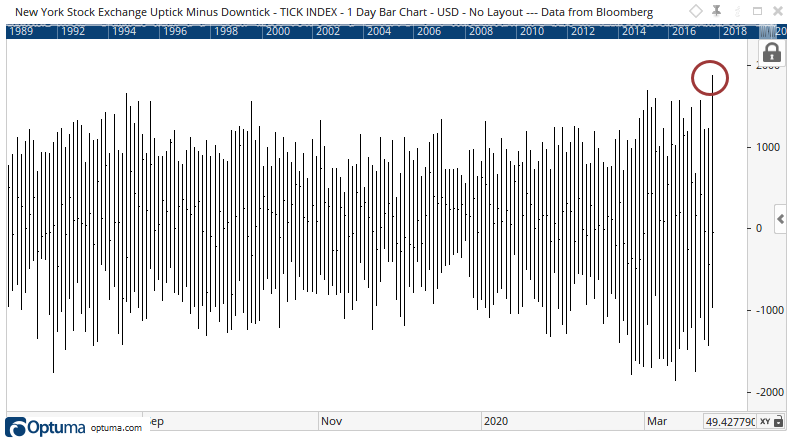
Earlier this month, we'd never seen selling intensity so heavy. In many respects, it was historic. One of those respects was the tendency to see more than half of the securities on the NYSE trade on a downtick at the same time.

At the open on Tuesday, we finally saw some potential of a switch in sentiment (or computer algorithms, at least). More than 1,800 securities traded on an uptick, a huge surge from recent sessions. That's more than 60% of the issues traded on that exchange.

A month after every one of the dates when this happened following a 52-week low, the S&P 500 showed a positive return. A few in 2008 had some extreme volatility, but showed at least a modest gain over the next month. A couple from July that year then quickly failed.

The most distressing part of this is that it also triggered four other times just this month, and every one of those have shown a loss over the next week. That pattern needs to change.


Other signs of a surge

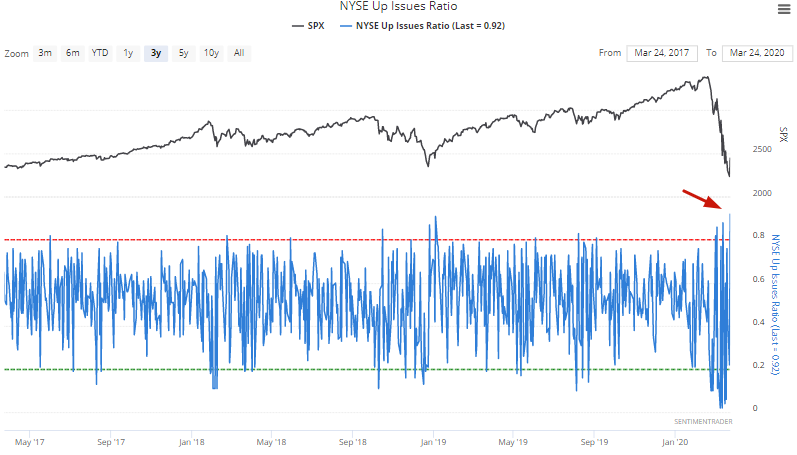
By the close on Tuesday, 92% of NYSE issues went up on one of the biggest 1 day rallies in market history. 

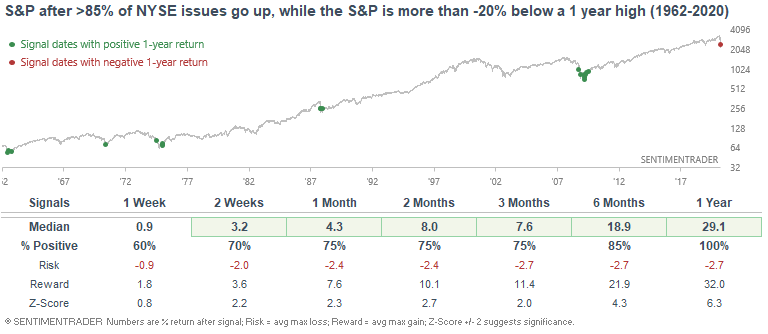
When this happened while the S&P was more than -20% below a 1 year high, the S&P had a very strong tendency to rally over the next few months and year. While this didn't always mark the exact bottom of a bear market, by then the worst of the selloff was over. 

This is an abridged version of our recent reports and notes. For immediate access with no obligation, sign up for a 30-day free trial now.

We also looked at:

  • What happens after a quick switch from a low to multi-day high
  • Up volume on Tuesday was overwhelming
  • The Dow went from a multi-year low to largest gain in multiple years
  • Price-to-book values are getting compelling around the world
  • World stocks have triggered a death cross
  • It's been a long time since stocks enjoyed back to back gains
  • This has been one of history's biggest clusters of 2% swings
PRODUCTS
SentimenTrader
Trading Tools
Indicators & Data API
‍
Strategies & Scanner
‍
Research Reports
FREE
RESOUrCES
Simple Backtest
Calculator
Simple Seasonality
Calculator
The Kelly Criterion
Calculator
Sentiment Geo Map
‍
Public Research Reports
‍
Pricing
Bundle pricing
‍
Announcements
‍
FAQ
COMPANY
‍
About
‍
In the News
‍
Testimonials
‍
Client Success Stories
CONTACT
‍
General Inquiries
‍
Media Inquiries
‍
Financial Professionals Inquiries
‍
© 2025 Sundial Capital Research Inc. All rights reserved.
Setsail Marketing
TermsPrivacyAffiliate Program
Risk Disclosure: Futures and forex trading contains substantial risk and is not for every investor. An investor could potentially lose all or more than the initial investment. Risk capital is money that can be lost without jeopardizing ones’ financial security or life style. Only risk capital should be used for trading and only those with sufficient risk capital should consider trading. Past performance is not necessarily indicative of future results.

Hypothetical Performance Disclosure: Hypothetical performance results have many inherent limitations, some of which are described below. No representation is being made that any account will or is likely to achieve profits or losses similar to those shown; in fact, there are frequently sharp differences between hypothetical performance results and the actual results subsequently achieved by any particular trading program. One of the limitations of hypothetical performance results is that they are generally prepared with the benefit of hindsight. In addition, hypothetical trading does not involve financial risk, and no hypothetical trading record can completely account for the impact of financial risk of actual trading. for example, the ability to withstand losses or to adhere to a particular trading program in spite of trading losses are material points which can also adversely affect actual trading results. There are numerous other factors related to the markets in general or to the implementation of any specific trading program which cannot be fully accounted for in the preparation of hypothetical performance results and all which can adversely affect trading results.

Testimonial Disclosure: Testimonials appearing on this website may not be representative of other clients or customers and is not a guarantee of future performance or success.