
A curious lack of new highs among sectors

Key points:
- Only one sector hit a record high along with the S&P 500 last week, an unusually low number
- Around 60% of S&P 500 stocks are above their 200-day moving averages, too, also a low number
- This lack of "oomph" among stocks and sectors is a minor warning sign, not consistent enough to be anything more
A drive to new highs led by...communications?
To the surprise of many, the most widely followed index in the world reached yet another record high last week. It was one of the quickest reversals from a two-month low to a record high since the index's inception.
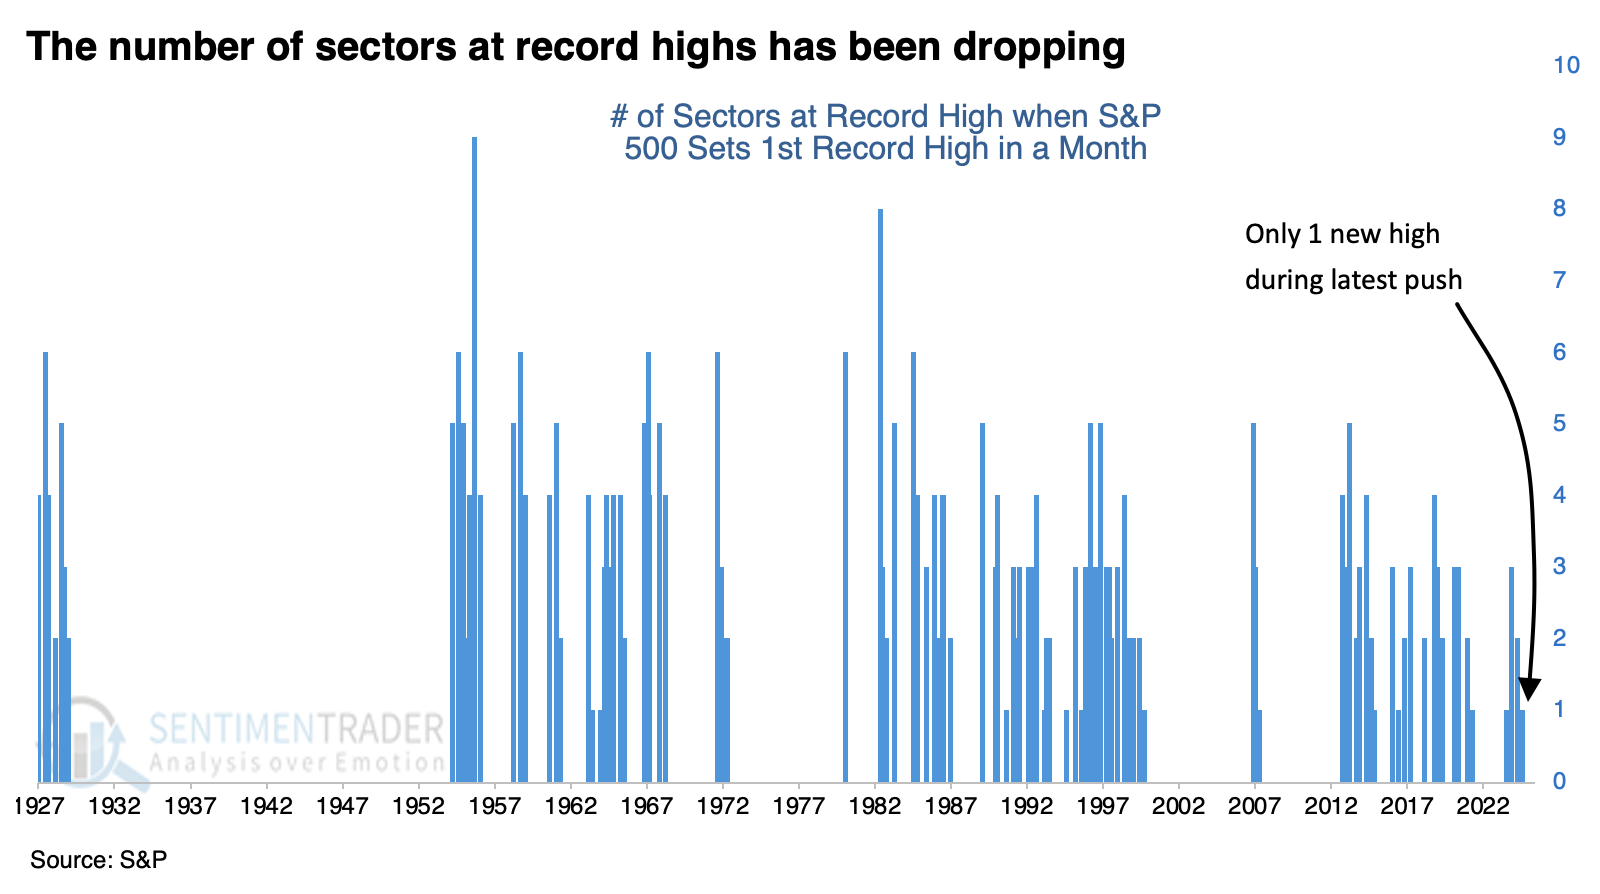
Even though breadth among stocks in the S&P 500 has been excellent during this latest run, most of its major sectors are still off their highs. Only the communications sector set a fresh record high along with the S&P. This uses total returns, including dividends.
The chart below shows how many sectors reached record highs along with the S&P 500. Usually, three or more sectors hit a high together, so the current lag is unusual.
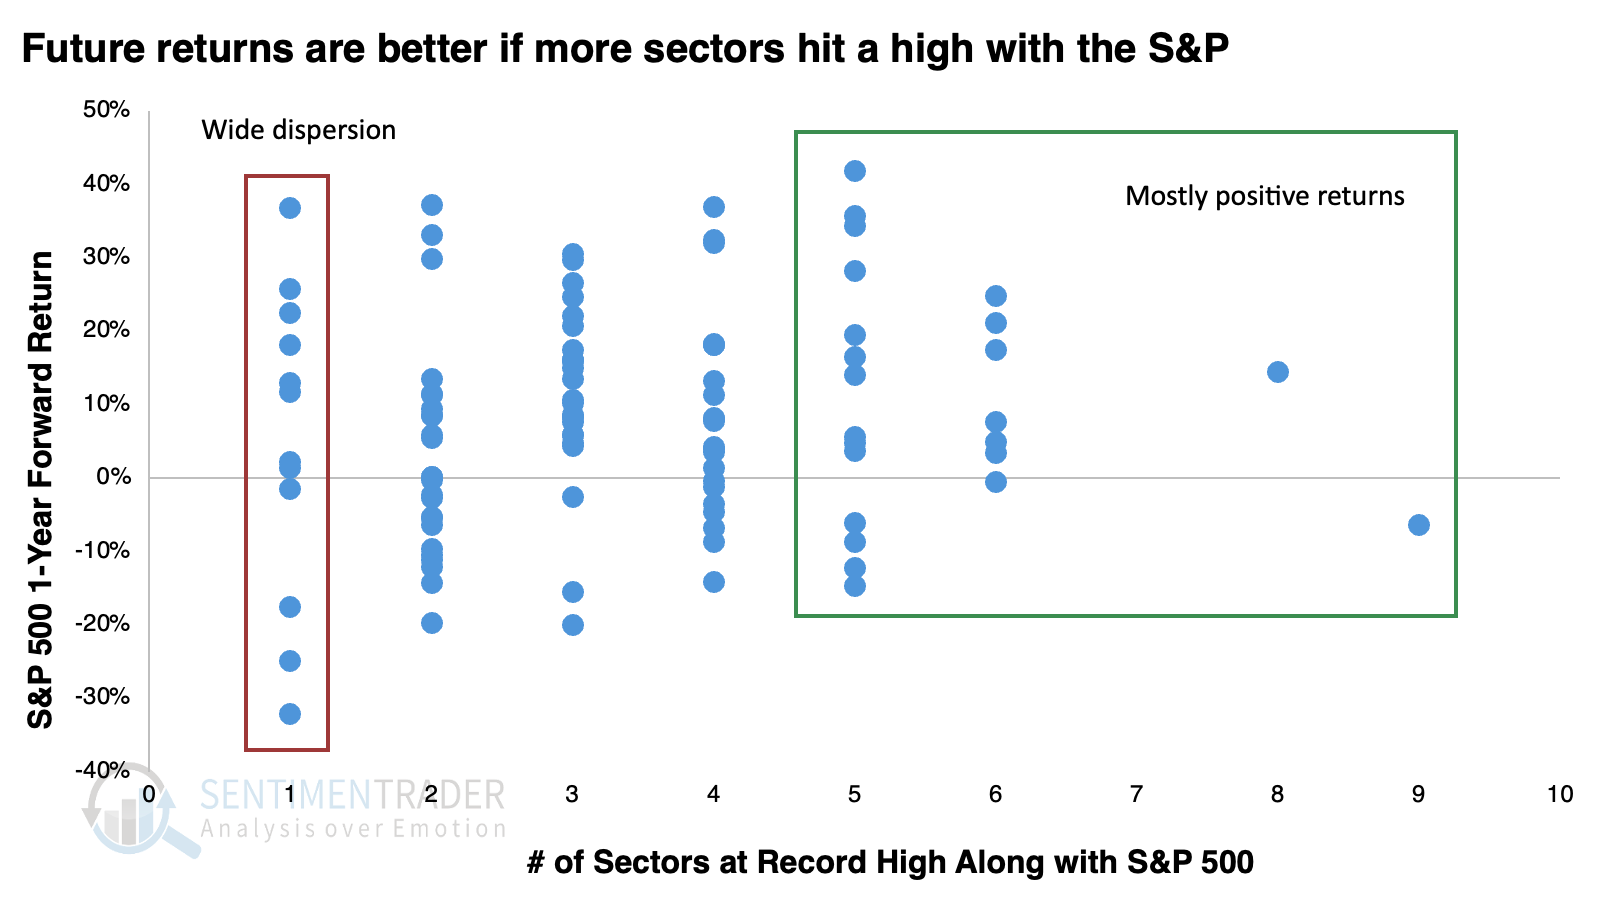
The scatter plot below shows the number of sectors hitting a record high along the x-axis, with the S&P 500's one-year forward return plotted on the y-axis.
When five or more sectors hit a record high along with the S&P, its forward returns tended to be positive. If there were losses a year later, they tended to be confined to correction territory. However, when only one sector hit a high along with the index, forward returns were much more dispersed, with some of the most negative returns.
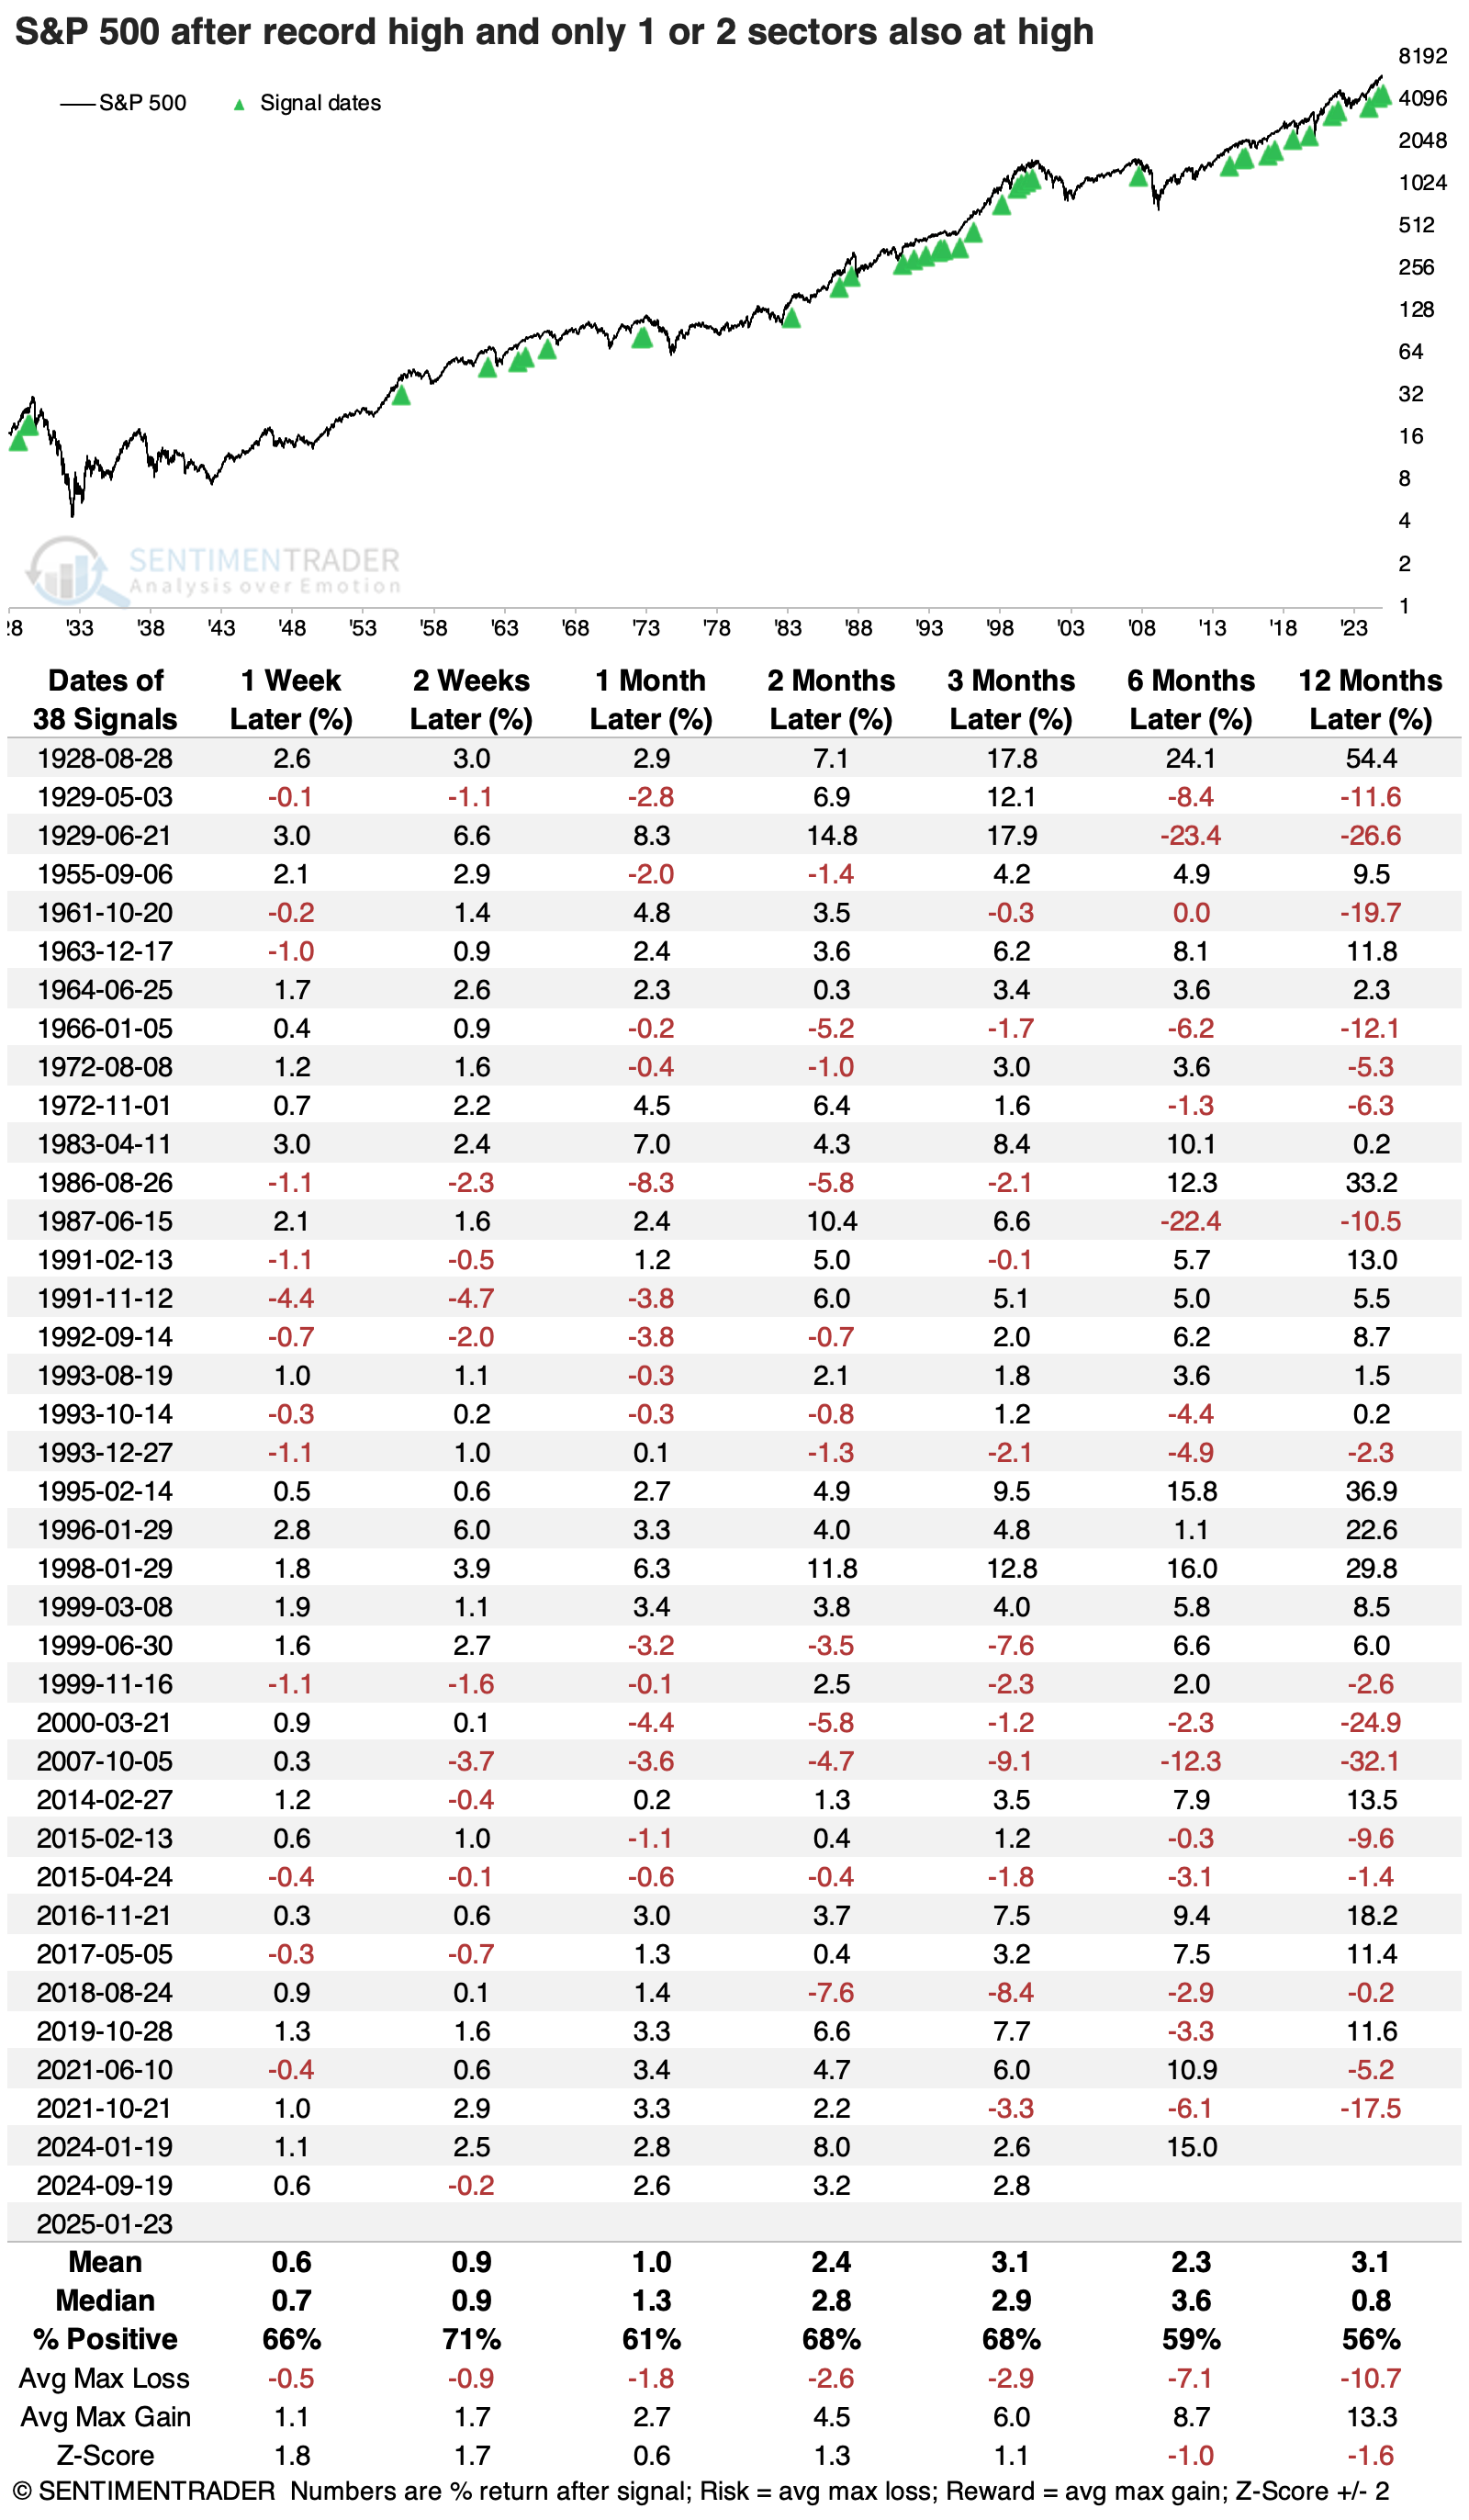
The table below shows the dates of these signals when only one sector reached a high. Half the signals have been triggered since the 2000 bubble peak, and since then, only the 2016 and 2024 signals neglected to see any material weakness. The November 2016 signal is worthy of note because it also coincided with President Trump's first election.
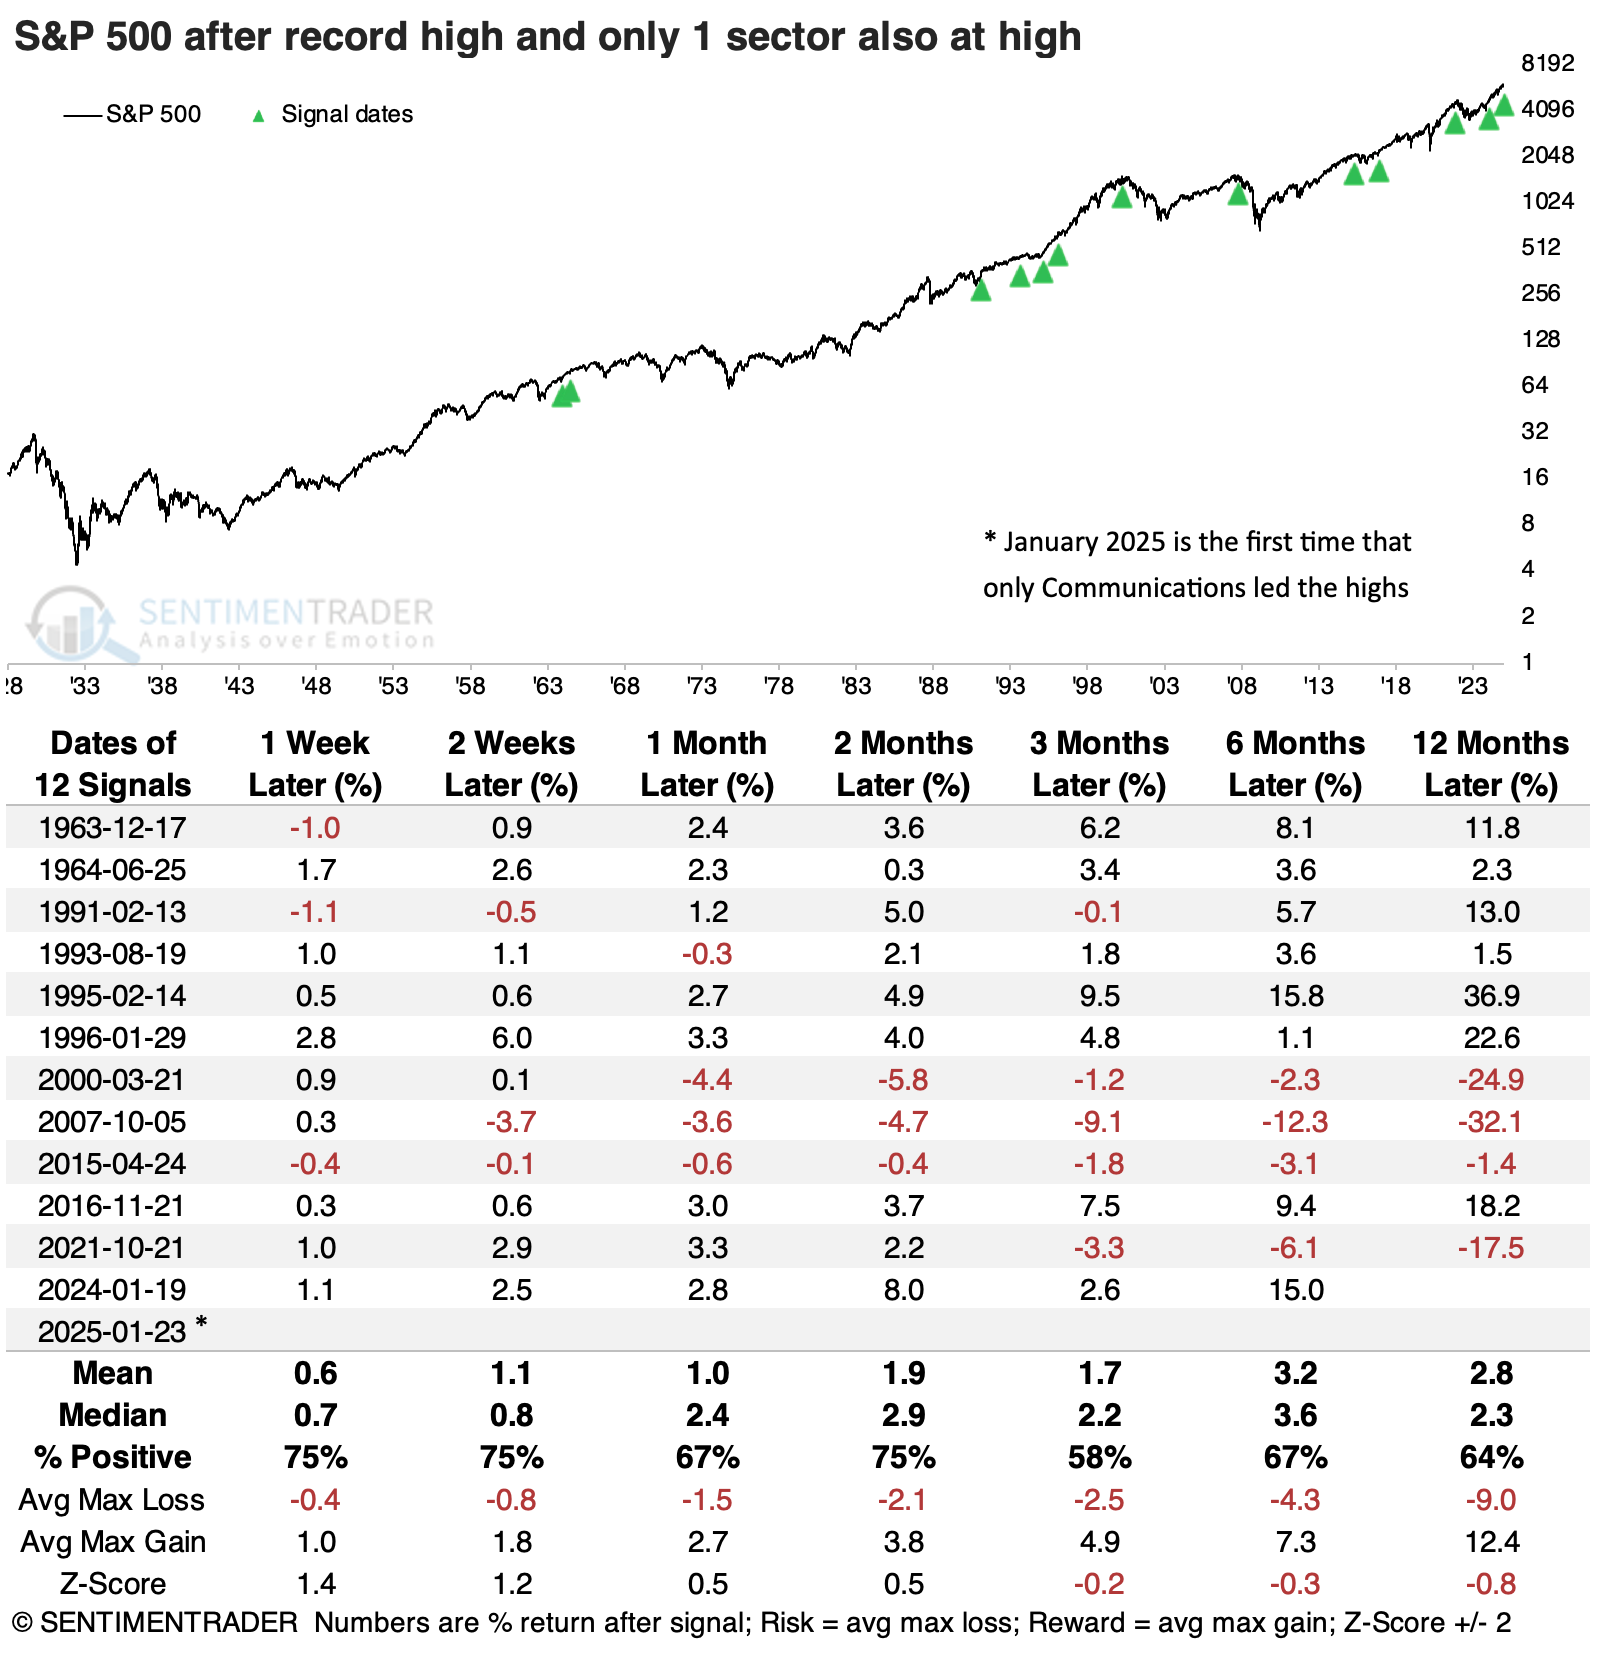
As noted in the chart directly above, the current signal is the only one when the communications sector was the only one hitting a high along with the S&P. Because of that, it's harder to have confidence in what is already a small sample size. So, the table below expands the sample by looking for times when two or fewer sectors reached a high.
This happened much more frequently, but the overall tone of forward returns was still pretty weak. One year later, the S&P 500 was positive only 56% of the time, its median return was barely positive, and the risk/reward wasn't anything to get excited about.
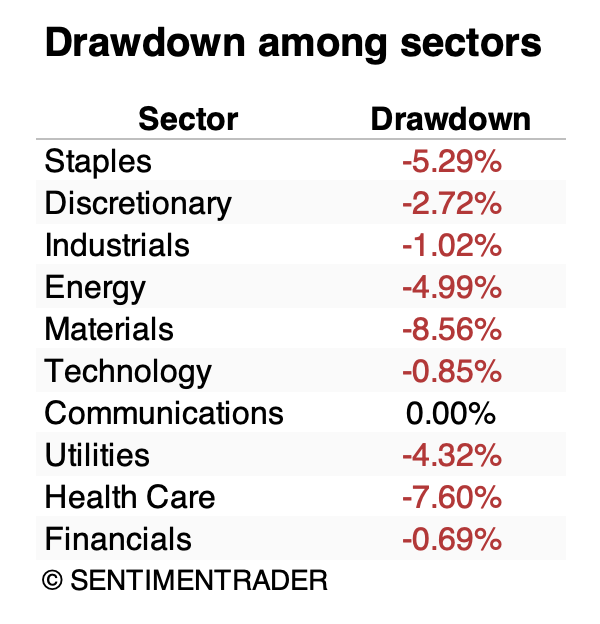
Sector drawdown correlations
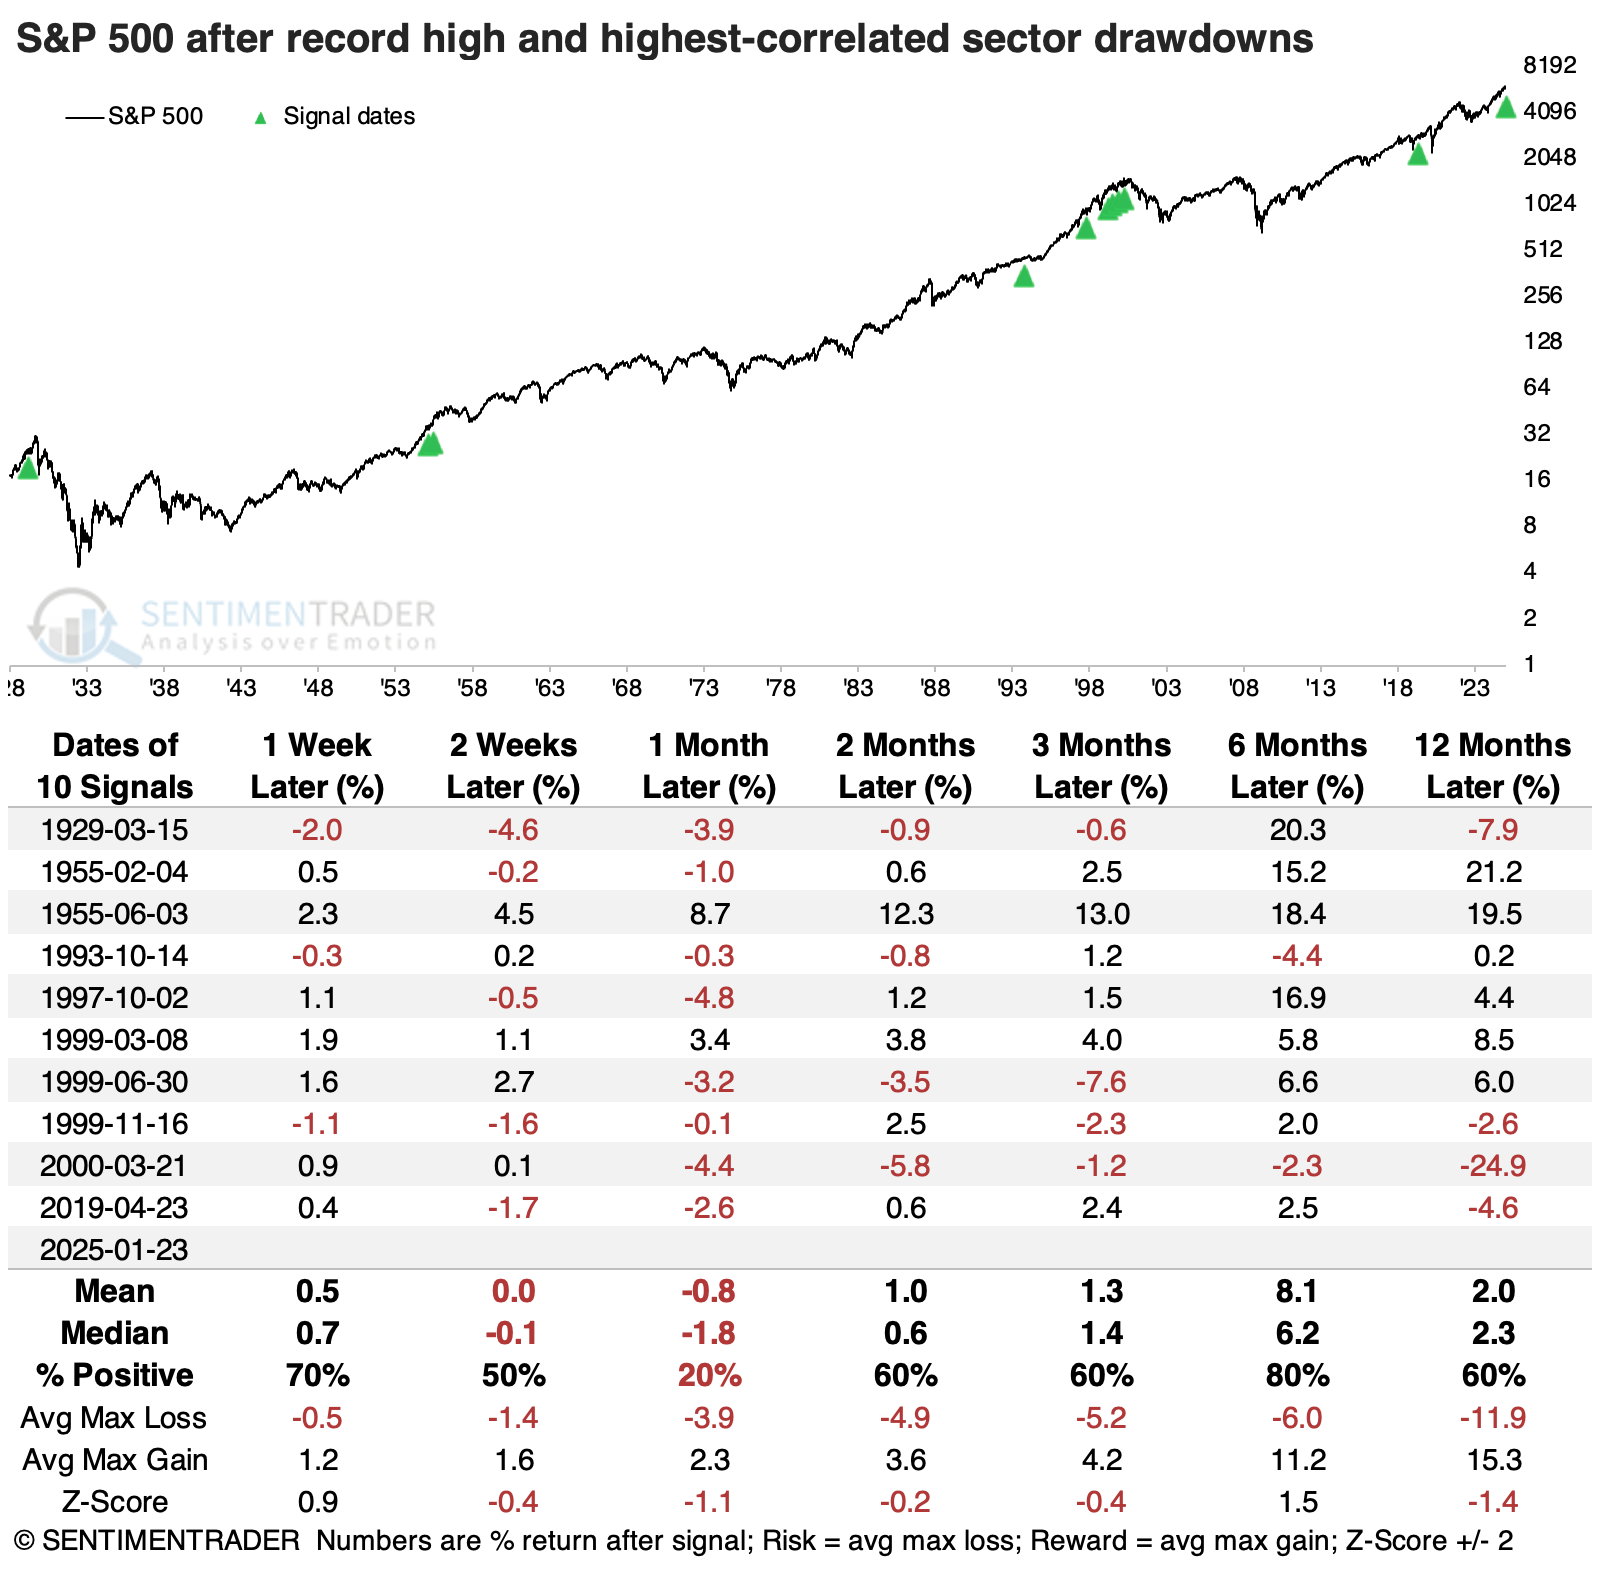
Because this was the first time the communication sector led, let's instead look at times when the S&P 500 reached a record high for the first time in a month and compare the drawdowns from record highs across sectors. Then, we'll look at the signals with the highest-correlated drawdowns among sectors to what we're seeing today.
The table below shows that the S&P's returns after these signals were, again, relatively poor. A month later, they were especially weak. Six months later, there were only two losses, but a year later, returns were well below random.
Another look at participation
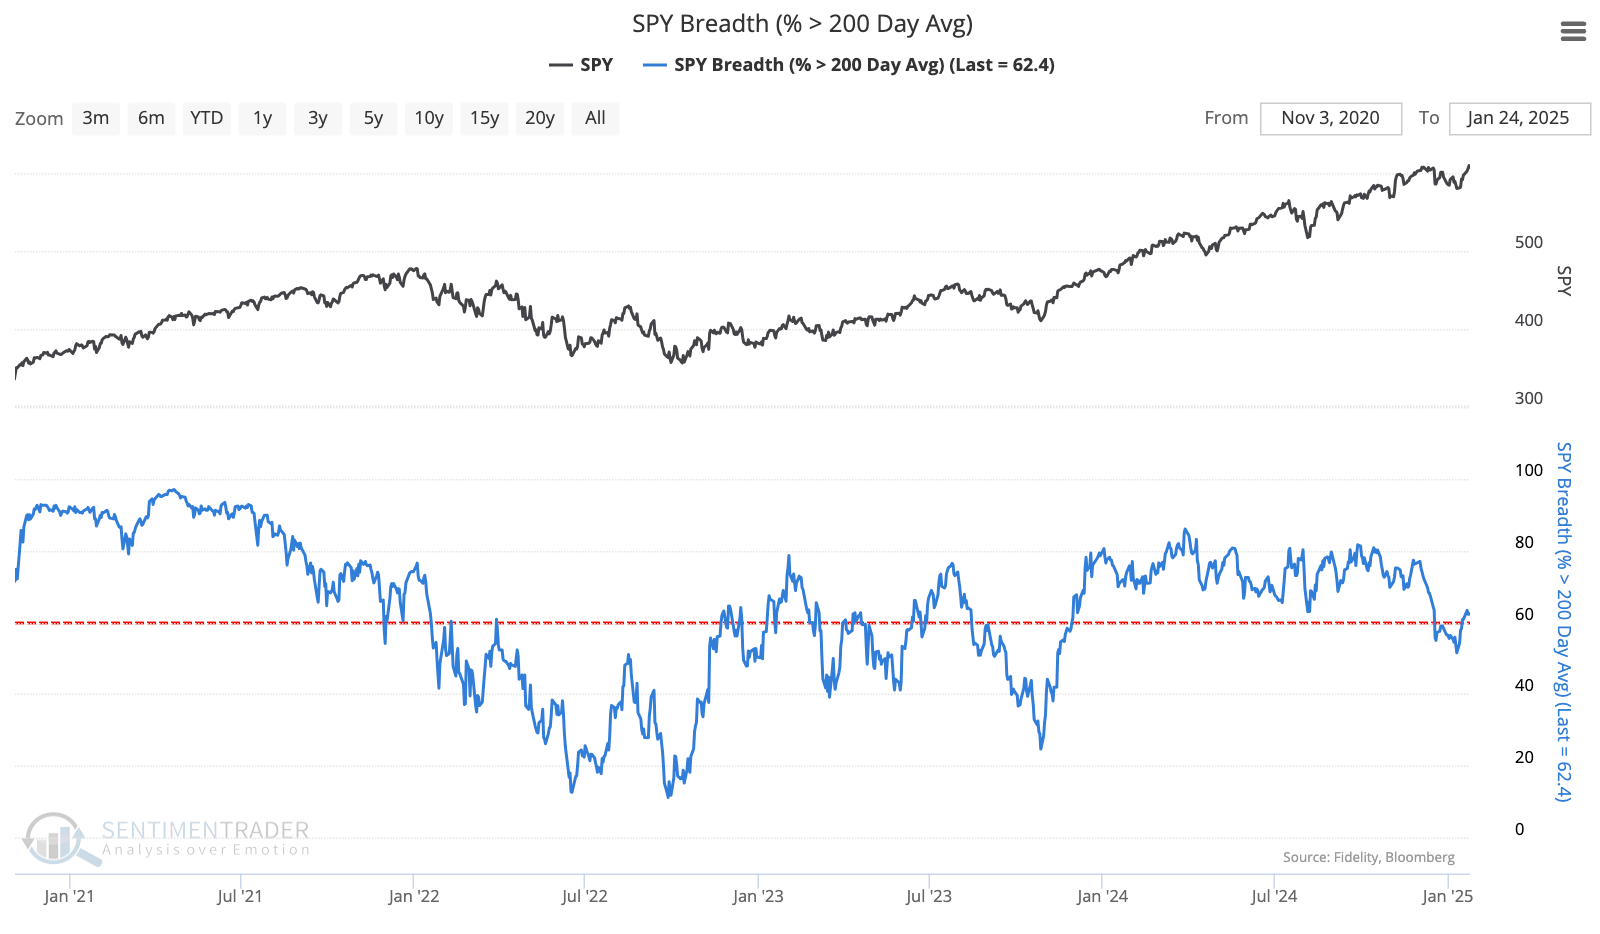
Last week, we saw that the market environment has flipped back to a healthy one, though it's precarious. One of those inputs is the percentage of S&P 500 stocks trading above their 200-day moving average, and it's hovering right around the 60% threshold that we use as the delineator.
Even with the index's push to record-high territory, this metric didn't surge much higher.
We use several sources for this data and some of them disagree. Some sources show that on January 23, when the S&P pushed to a new high, fewer than 60% of member stocks were trading above their long-term averages. For curiousity's sake, the table below shows other times the index pushed to a high with so few members along for the ride.
It wasn't a consistent signal that the rally was doomed to failure, but it also wasn't a ringing endorsement to jump on board. The S&P's returns across time frames were below average, especially on longer time frames, and it suffered a poor risk/reward skew. Other than the weird post-pandemic rally in 2020, the next nearest signals were near the peaks in 2000 and 2007.
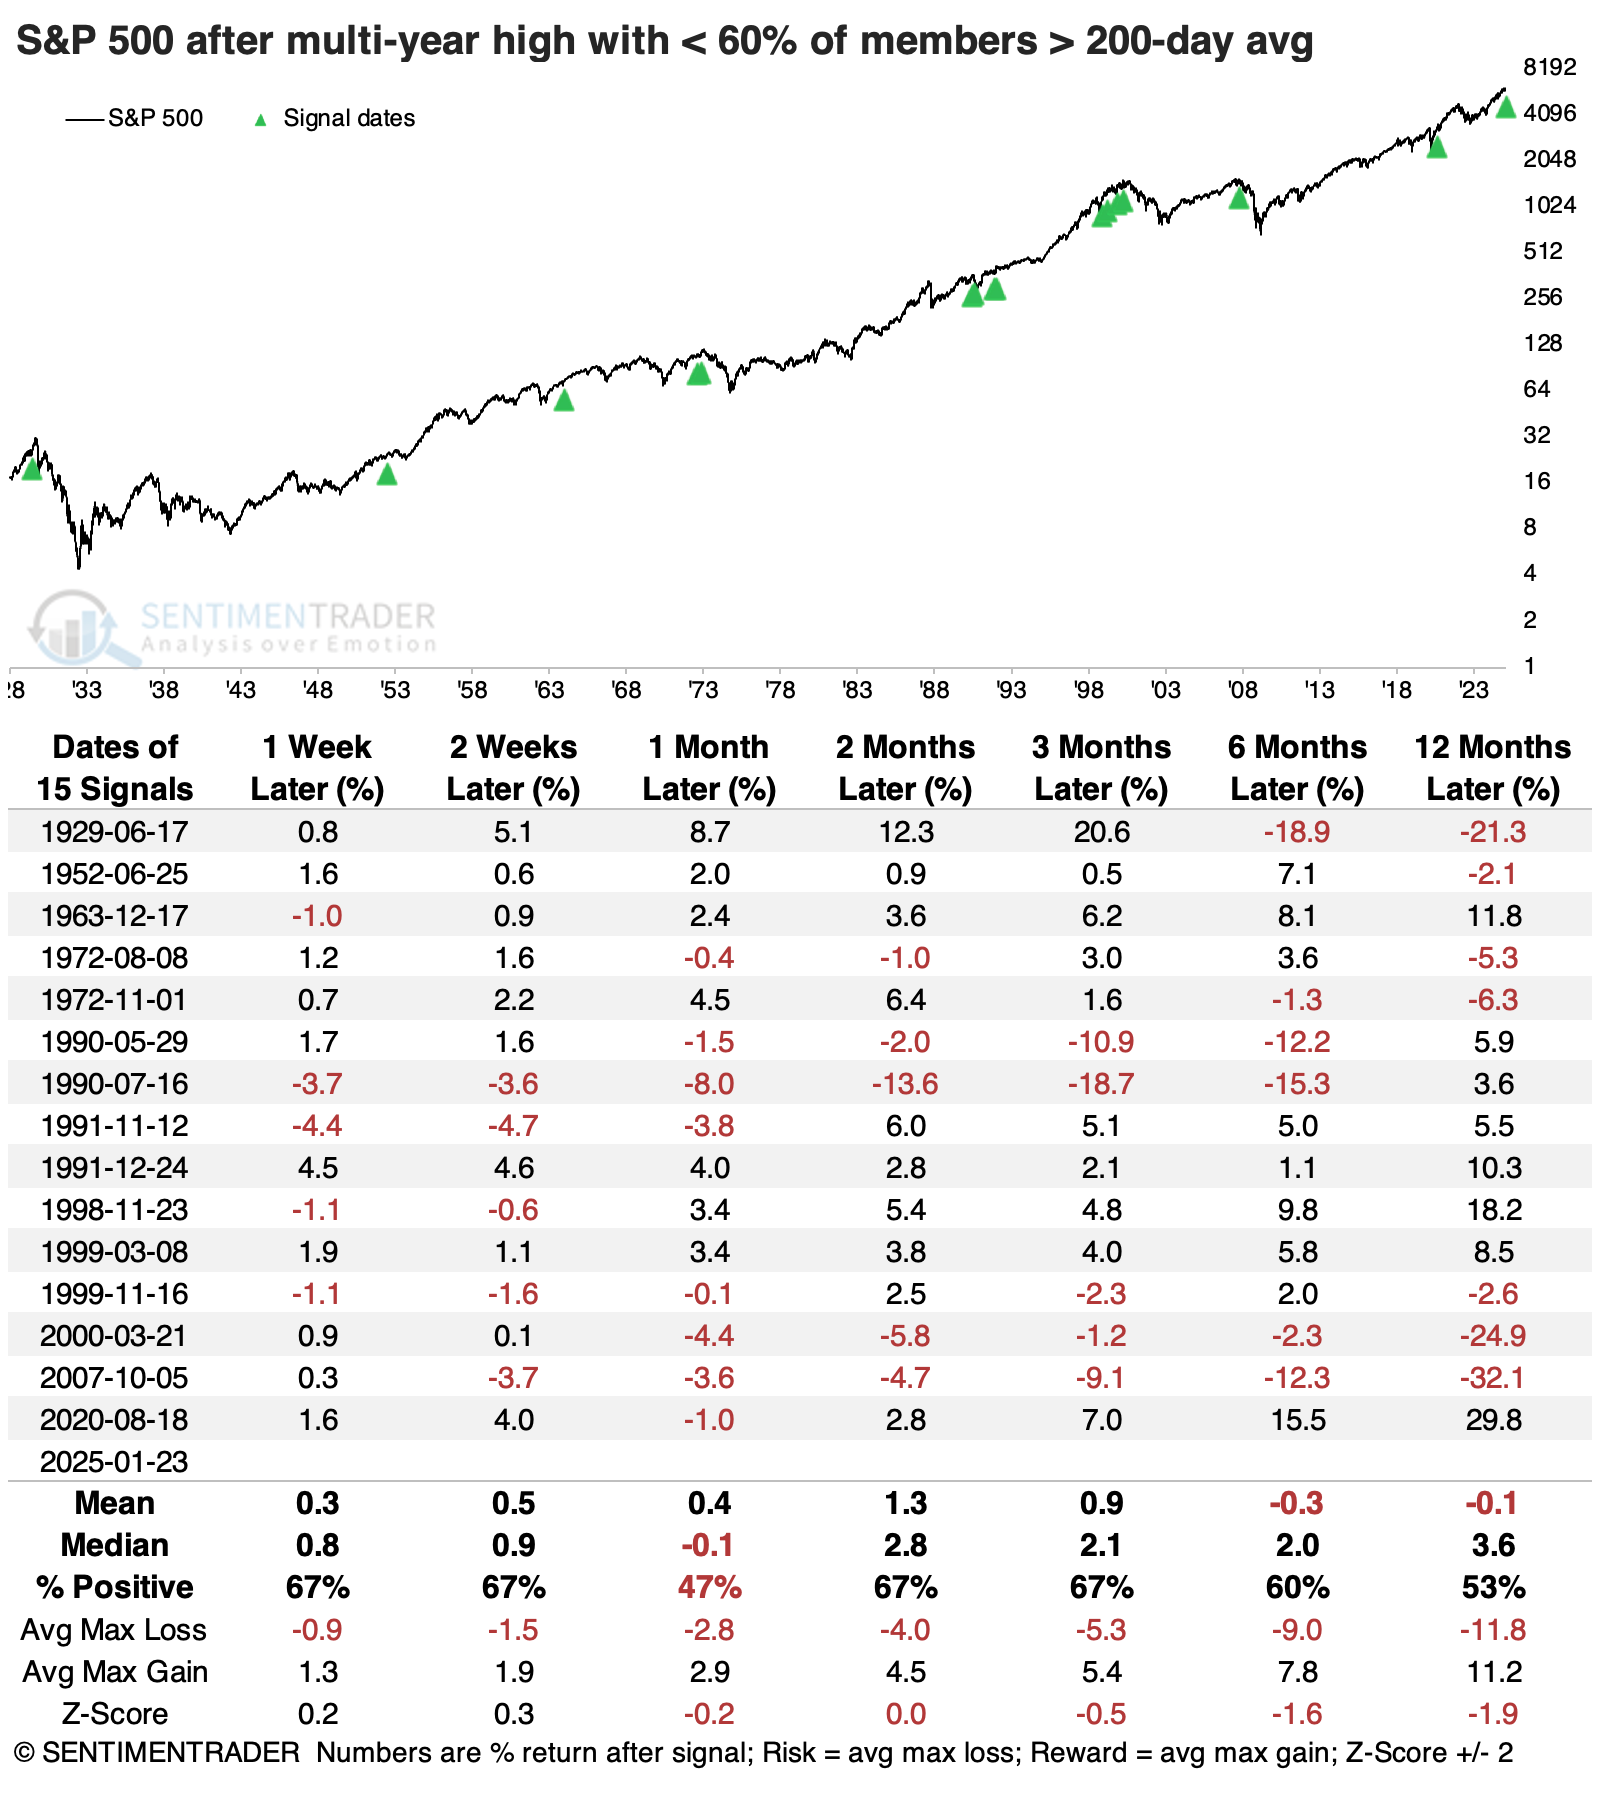
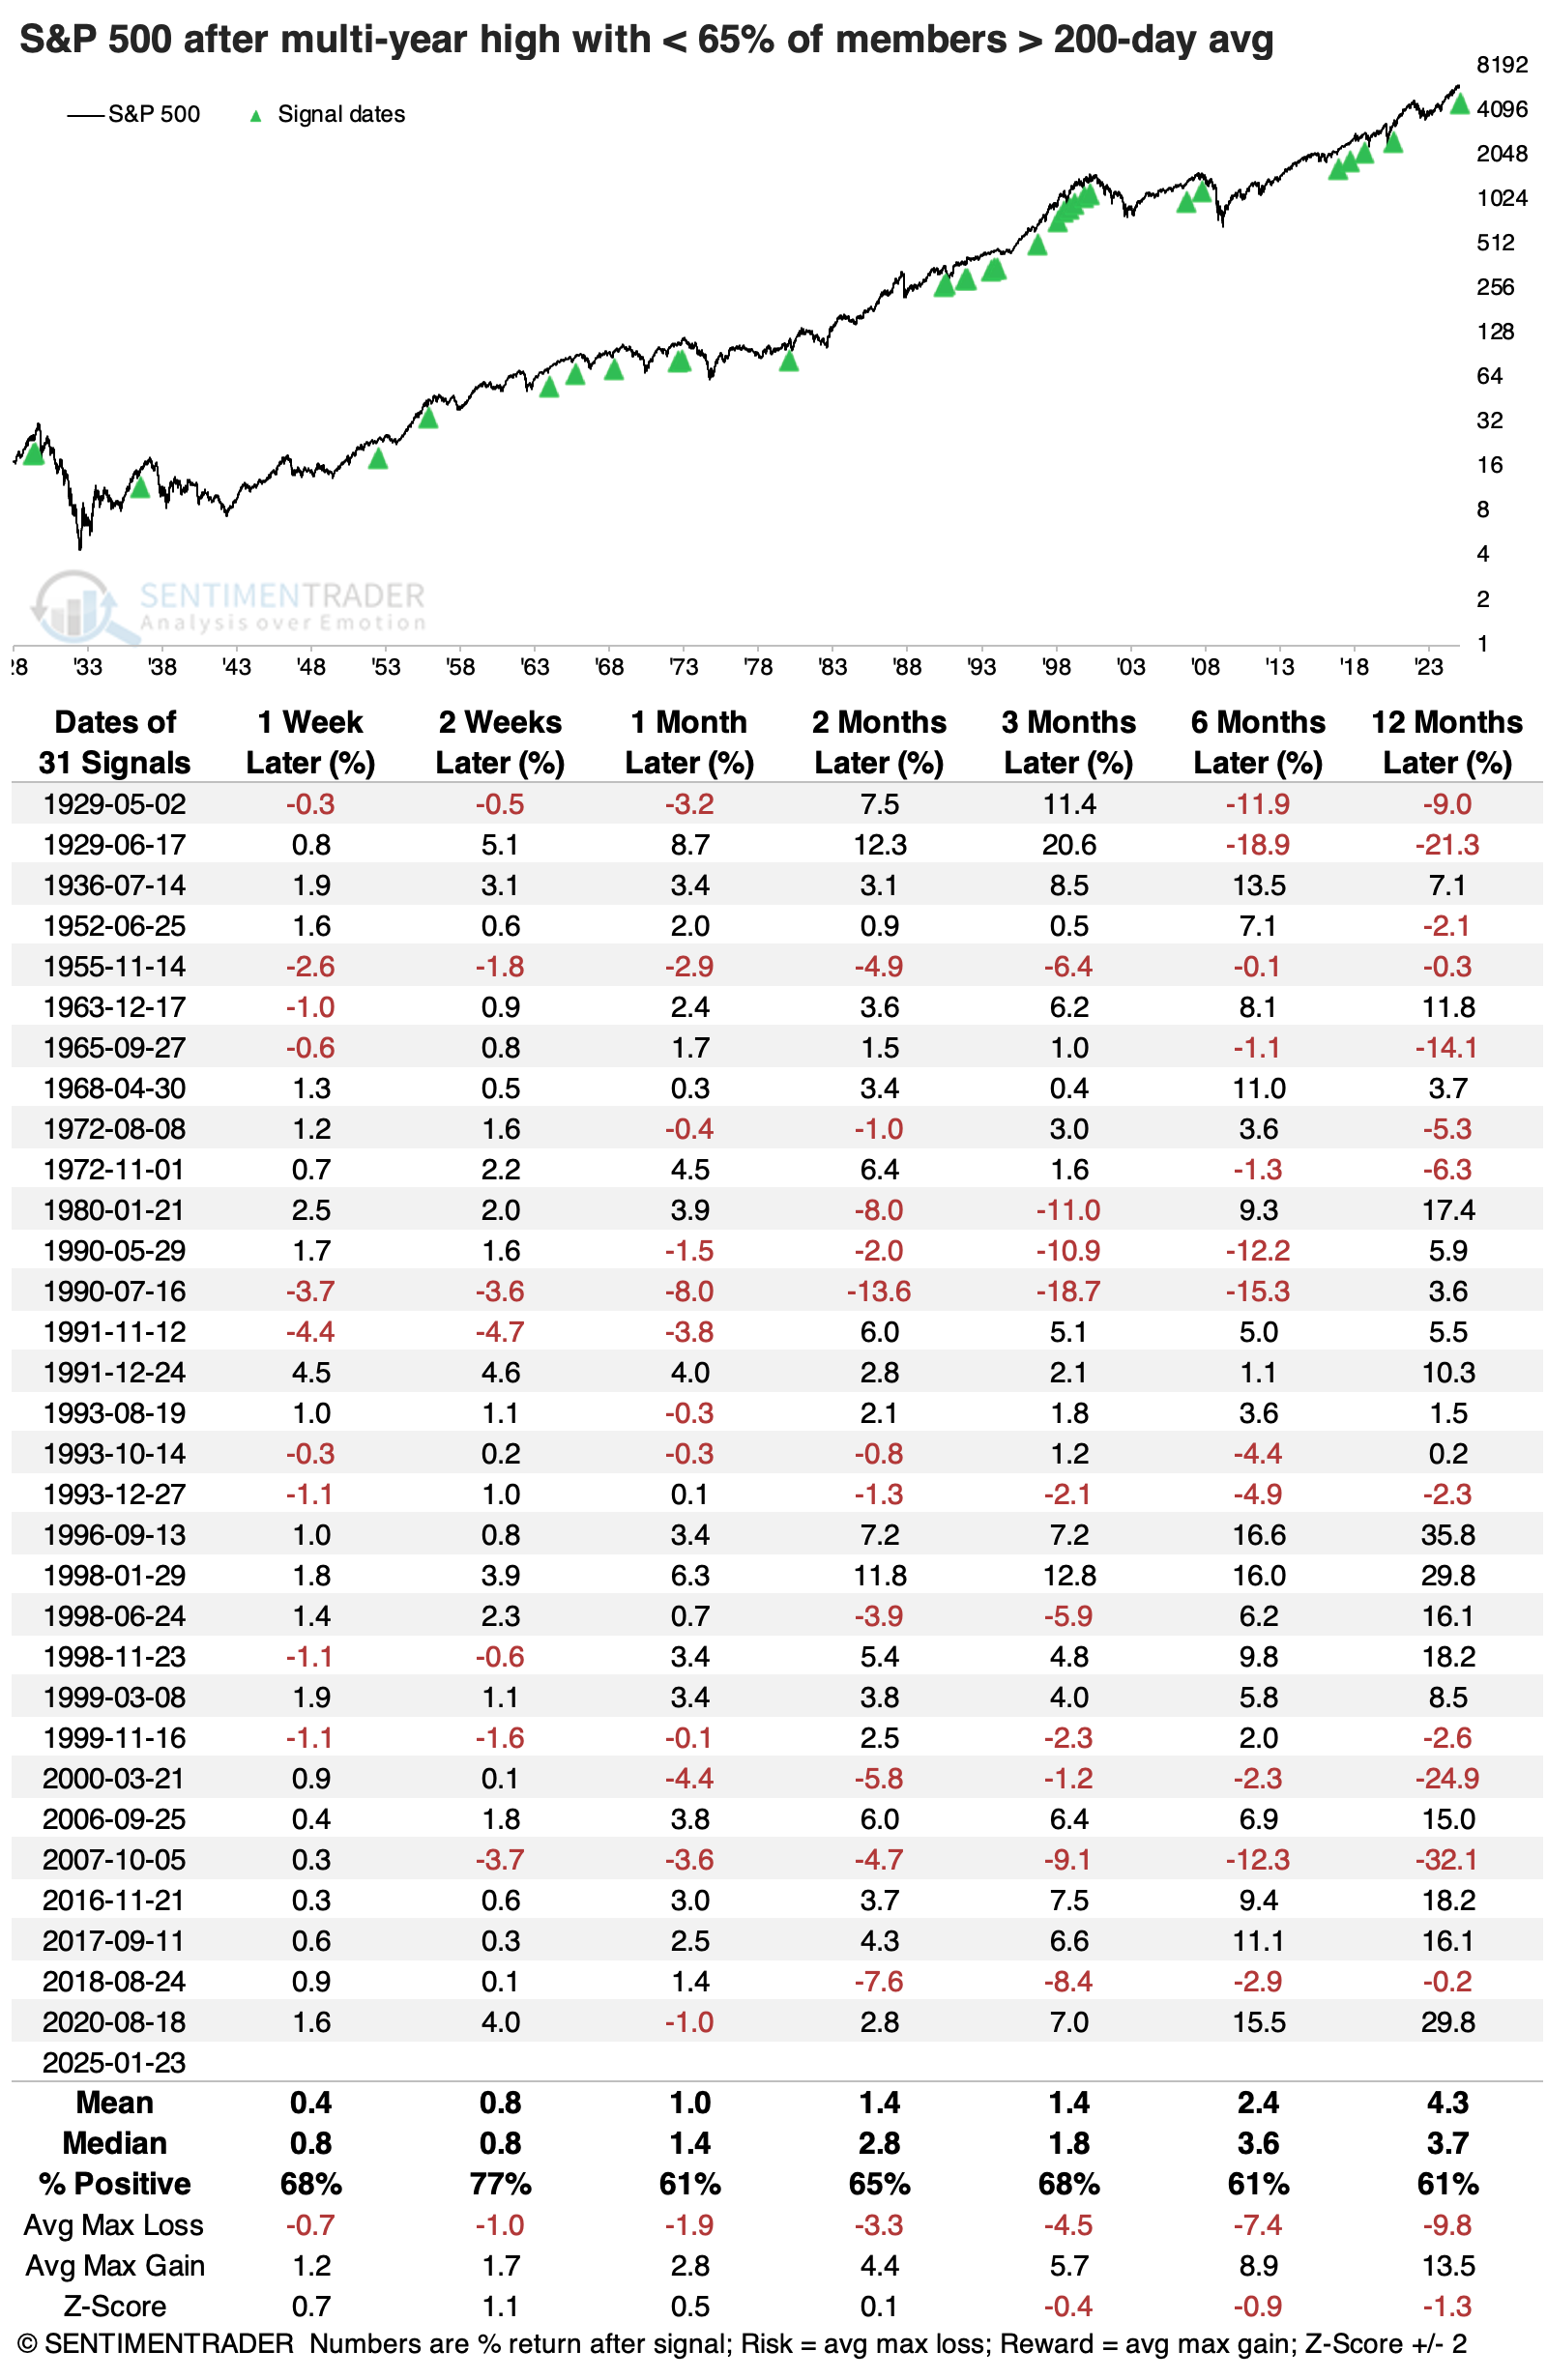
On the website, barely more than 60% of members were above their 200-day averages when the S&P hit a high on the 23rd, so the table below relaxes the threshold to 65% or fewer members. That generated significantly more signals and a better return profile, but long-term prospects were still not all that impressive.
What the research tells us...
We spent a lot of time looking at participation in the S&P 500 as the index ebbs and flows. This is not only because it's the world index with the most money following it but also because participation among stocks in the index has a long history of providing good clues as to whether we should trust the index or not.
We're seeing some mixed signals in that regard. Breadth on this latest push has been impressive - even historic. But it's only been a little over a week, and that hasn't entirely erased some of the weakness that has been evident since December. So, the index has pushed to a new high, but curiously few stocks and sectors have followed suit. There is not enough evidence to suggest we shouldn't trust the breakout, but it may be enough to suggest not jumping in with both feet simply because the index hit a high. Too few stocks have followed suit to suggest that's a high-probability move.