Products
SentimenTrader Trading Tools
‍
Backtest Engine
My Trading Toolkit
Correlation Analysis
Seasonality
Market Prediction
Indicators & Data API
‍
Proprietary Indicators & Charts
Market Data API
Strategies & Scanner
‍
50+ Trading Strategies
Smart Stock Scanner
Smart Option Scanner
Research Reports
‍
Research Solutions
Reports Library
Free Resources
Simple Backtest Calculator
Simple Seasonality Calculator
The Kelly Criterion Calculator
Sentiment Geo Map
Public Research Reports
Education
Sentiment Indicators
Technical Indicators
Pricing
Company
About
In the News
Testimonials
Client Success Stories
Contact
Log inLoginSign up
< BACK TO ALL REPORTS

A crucial signal to monitor in bear markets

Dean Christians
2022-06-30
News lows are a crucial market breadth indicator, especially in bear markets. A significant divergence in new lows has occurred near a bottom in all but one bear market since 1929. Let's review my new lows divergence model to assess what we might expect should a signal trigger.

Key points:

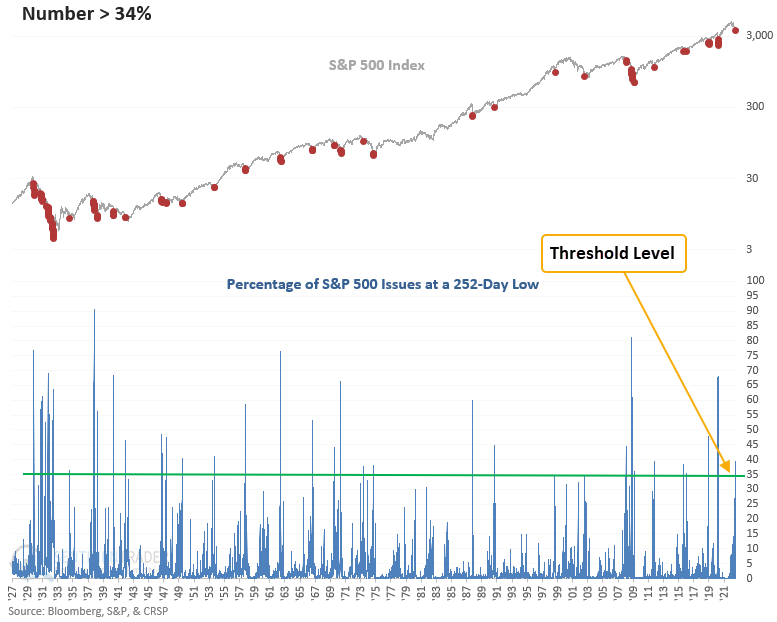
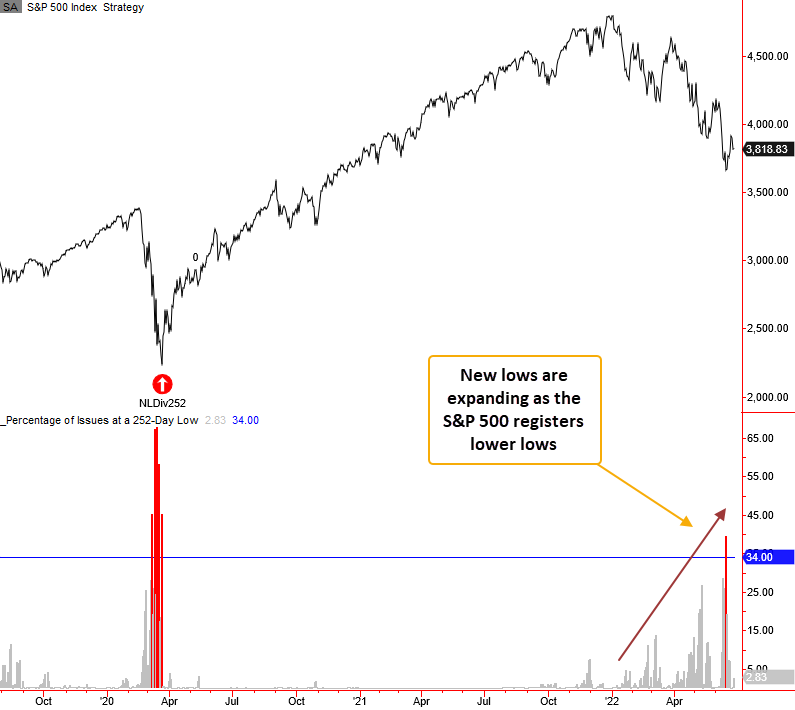
  • 252-day lows for S&P 500 issues surged above 39% on 6/16/22
  • With a cross above 34%, a model that identifies a divergence in new lows is locked and loaded
  • We now need to see a lower low in the S&P 500 with fewer issues registering a low

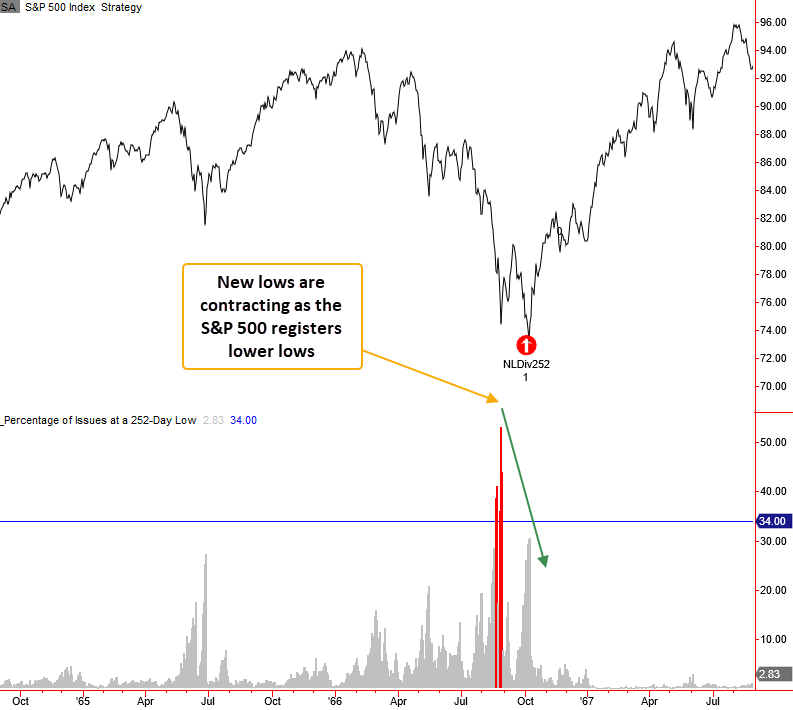
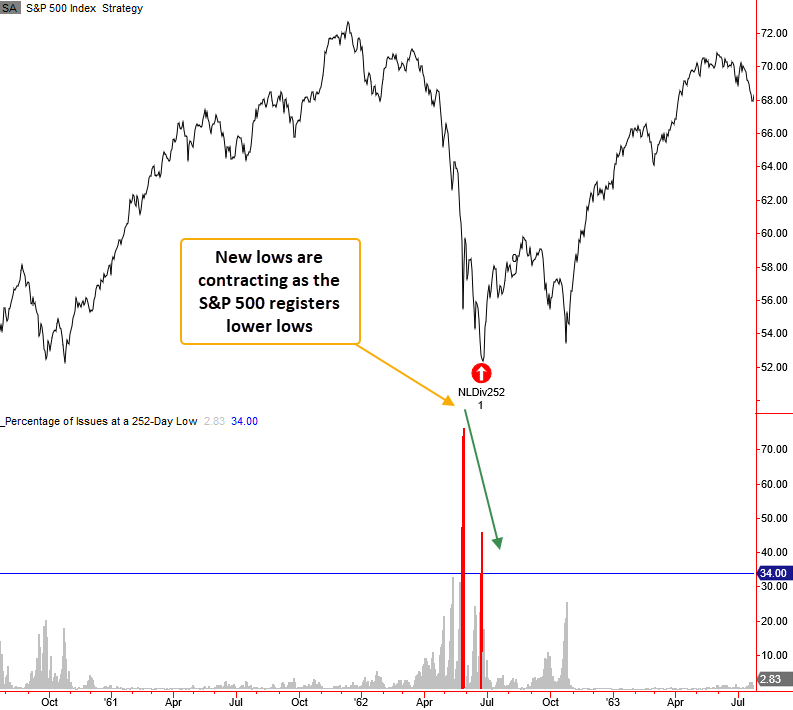
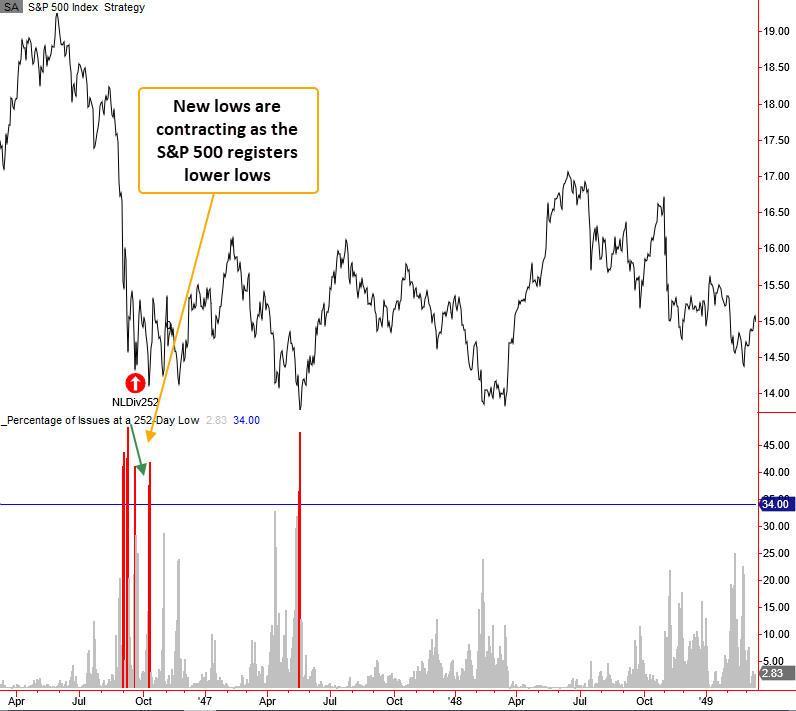
Historically, markets bottom when lows are contracting, not expanding

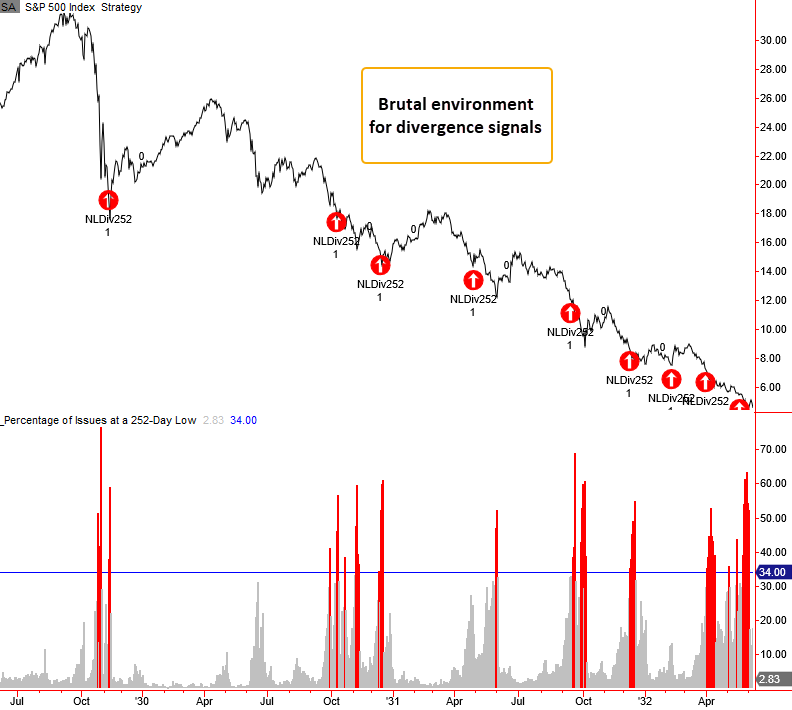
In my note on Wednesday, I shared a new signal from my TCTM composite washout model. The composite model contains 10 components, 3 of which seek to identify a divergence in new lows across multiple durations. As I stated in my note, it's somewhat troubling that 2/3 of the new low divergence components did not trigger a signal. Historically, meaningful market lows occur when fewer issues register a new low as an index records lower lows. Market participants call this a divergence. 

The new lows divergence model that I created requires the percentage of new lows to exceed a user-defined level before a signal can occur. In the case of the 252-day low model, it must exceed 34%. Once achieved, the model will trigger an alert if the percentage of lows is less than that level and the S&P 500 registers a lower low. I use a window of 5 to 100 days for the alert. i.e., a signal cannot occur outside of that window. 

Let's review the historical signal performance and charts for the 252-day divergence model. 

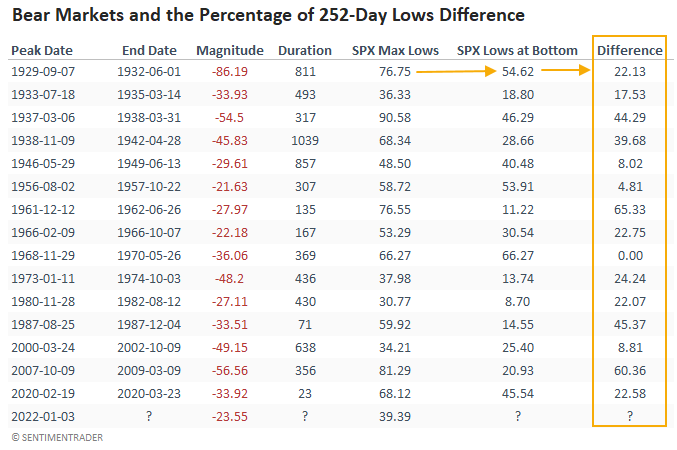
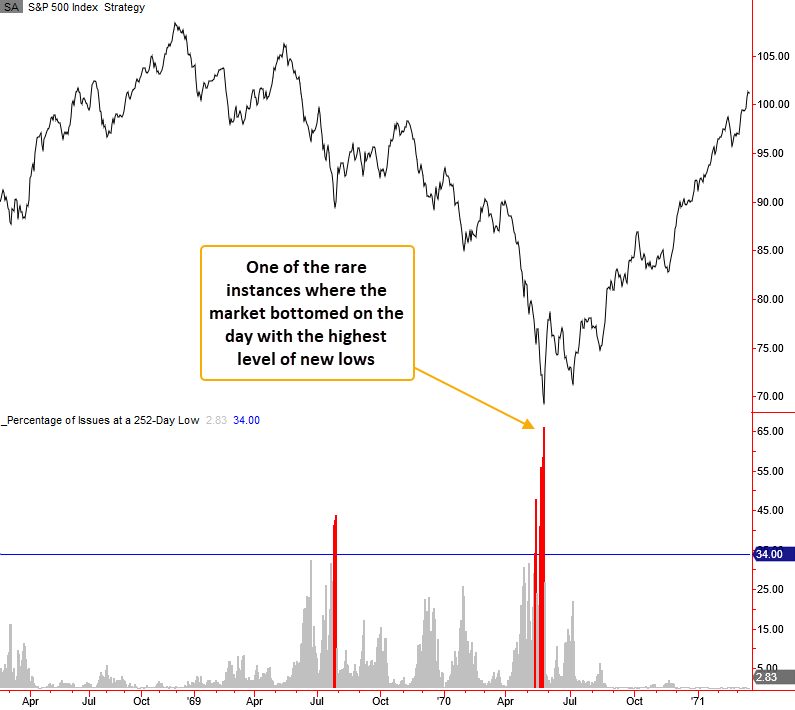
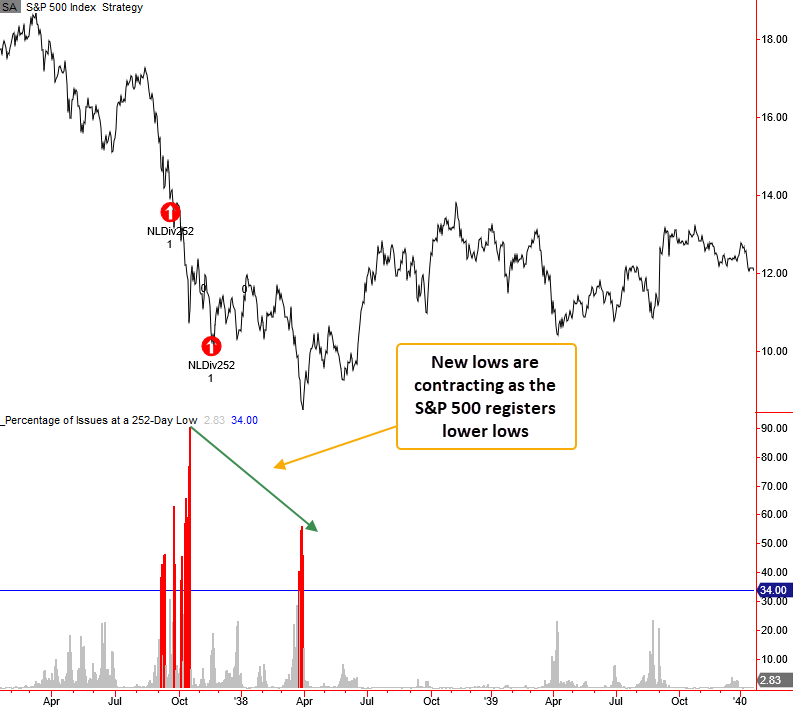
Suppose we compare the maximum percentage of 252-day lows in a bear market to the level at the final low in the index. In that case, we see a difference in all but one instance. Historically, markets bottom when lows are contracting.

New low divergence signals preceded positive returns

My divergence model generated a signal 31 times over the past 93 years. After the others, S&P 500 future returns, win rates, and risk/reward profiles look solid in the 2-8-week range. As with most historical analyses, the outlook improves after the 1929-32 bear market period. Since 1937, the 1-month time frame shows a positive return in 18 out of 21 instances. 

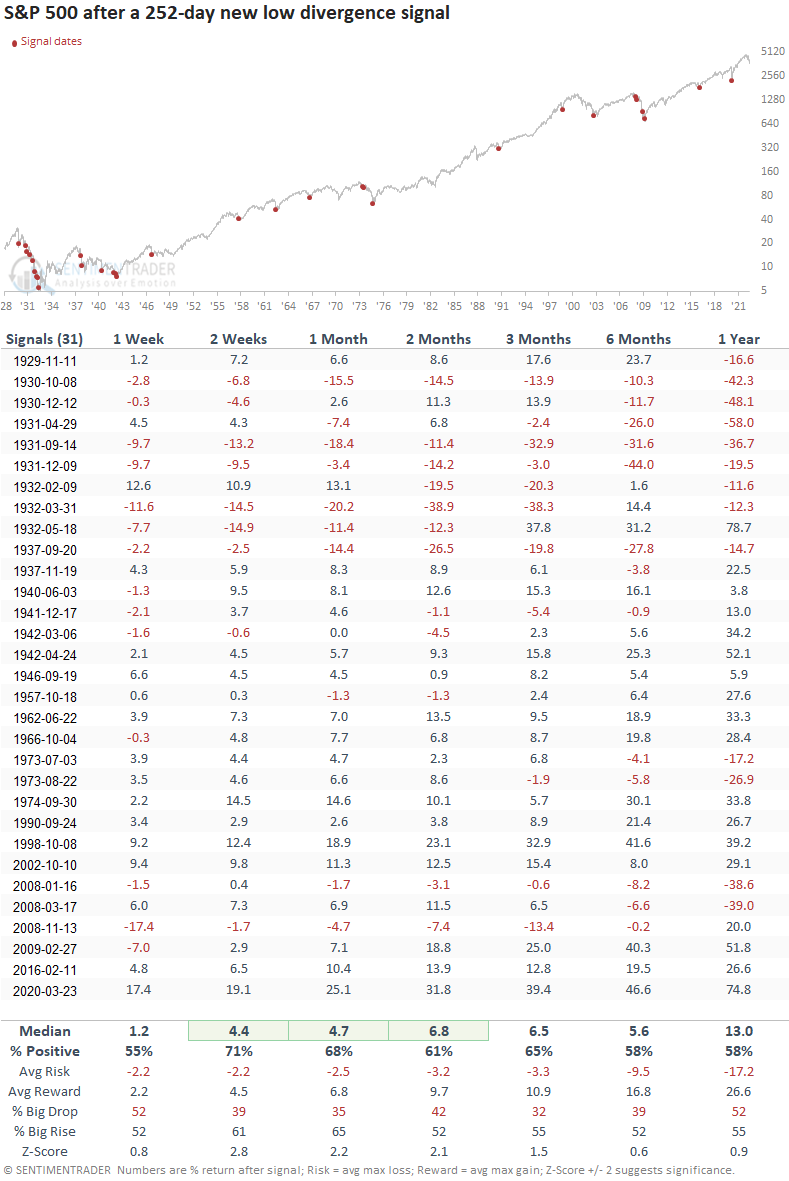
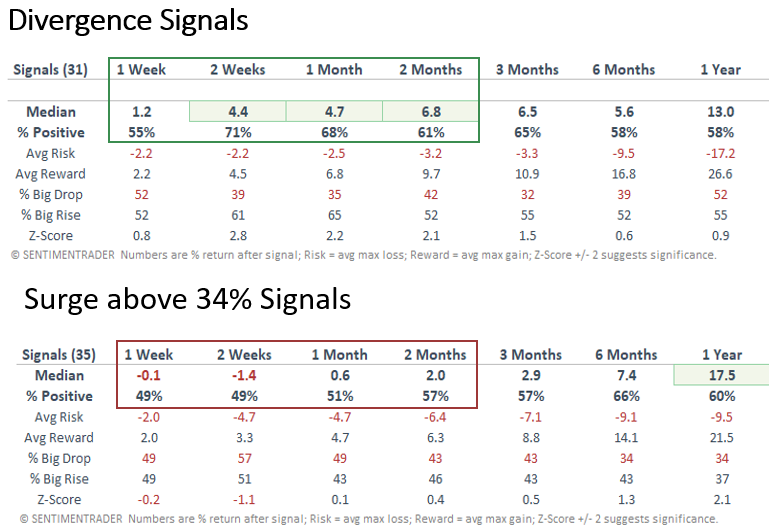
New low divergence signals provide a better near-term outlook

Suppose we compare the divergence signals to a signal that buys the S&P 500 when new lows expand above 34%, the hurdle rate used in the divergence signal. In that case, we see a significantly better outlook across short to medium-term time frames for divergence signals. So, one would be better off waiting for less downside participation from the individual index members. 

Let's zoom in and review some of the bear market signals/charts since 1929.

Current day chart example

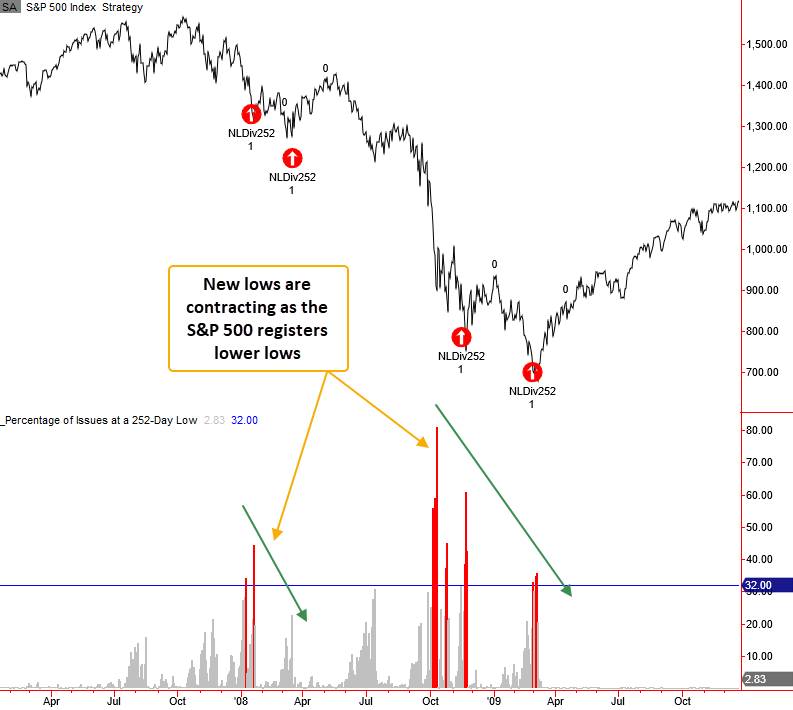
2007-08 bear market chart example

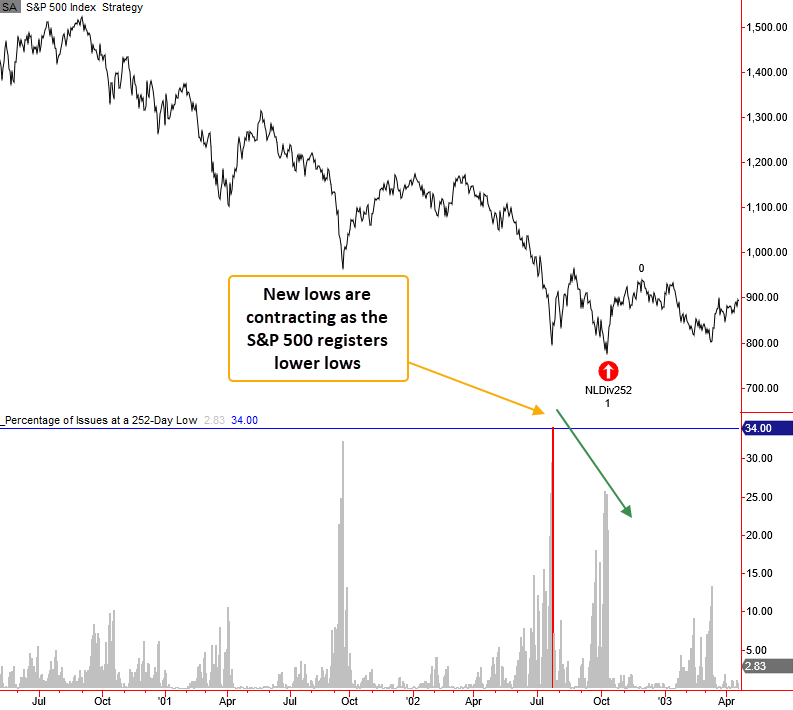
2000-02 bear market chart example

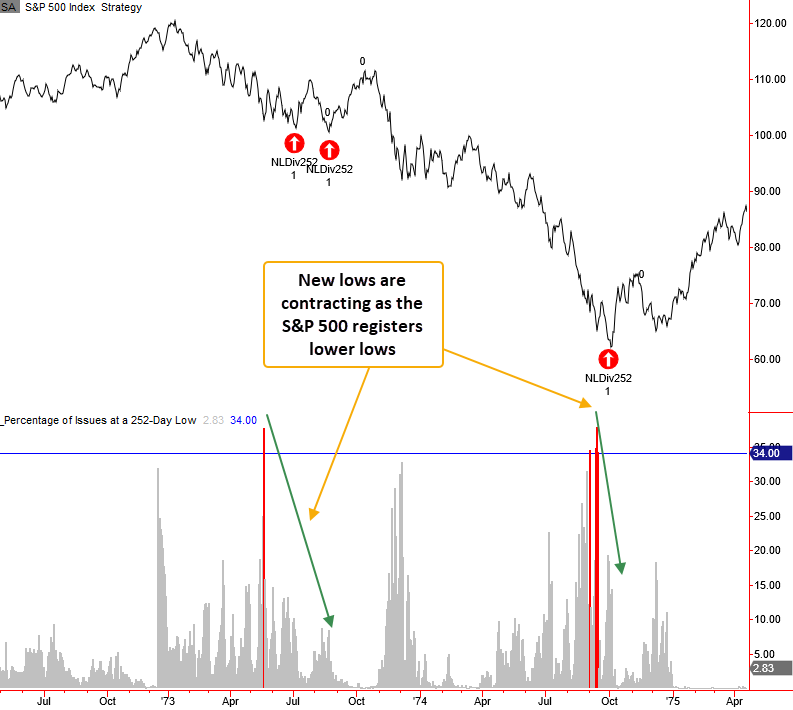
1973-74 bear market chart example

1968-70 bear market chart example

1966 bear market chart example

1962 bear market chart example

1946-49 bear market chart example

1937-42 bear market chart example

1929-32 bear market chart example

What the research tells us...

When the percentage of new lows in an index contracts as the index registers lower lows, the internal healing process creates a divergence setup that provides a better launch pad for a market rally. Stay tuned for a potential signal. 

PRODUCTS
SentimenTrader
Trading Tools
Indicators & Data API
‍
Strategies & Scanner
‍
Research Reports
FREE
RESOUrCES
Simple Backtest
Calculator
Simple Seasonality
Calculator
The Kelly Criterion
Calculator
Sentiment Geo Map
‍
Public Research Reports
‍
Education
Sentiment Indicators
‍
Technical Indicators
‍
Pricing
Bundle pricing
‍
FAQ
‍
Announcements
‍
COMPANY
‍
About
‍
In the News
‍
Testimonials
‍
Client Success Stories
CONTACT
‍
General Inquiries
‍
Media Inquiries
‍
Financial Professionals Inquiries
‍
© 2026 Sundial Capital Research Inc. All rights reserved.
Setsail Marketing
TermsPrivacyAffiliate Program
Risk Disclosure: The information and tools provided are for research and analytical purposes only and are not intended as investment advice. Market analysis involves uncertainty, and outcomes may differ from expectations. Users should conduct their own due diligence and consider their individual circumstances before making any financial decisions. Past performance is not necessarily indicative of future results.

Hypothetical Performance Disclosure: Hypothetical performance results have many inherent limitations, some of which are described below. No representation is being made that any account will or is likely to achieve profits or losses similar to those shown; in fact, there are frequently sharp differences between hypothetical performance results and the actual results subsequently achieved by any particular trading program. One of the limitations of hypothetical performance results is that they are generally prepared with the benefit of hindsight. In addition, hypothetical trading does not involve financial risk, and no hypothetical trading record can completely account for the impact of financial risk of actual trading. for example, the ability to withstand losses or to adhere to a particular trading program in spite of trading losses are material points which can also adversely affect actual trading results. There are numerous other factors related to the markets in general or to the implementation of any specific trading program which cannot be fully accounted for in the preparation of hypothetical performance results and all which can adversely affect trading results.

Testimonial Disclosure: Testimonials appearing on this website may not be representative of other clients or customers and is not a guarantee of future performance or success.