
A crucial indicator to watch in bear markets

Key points:
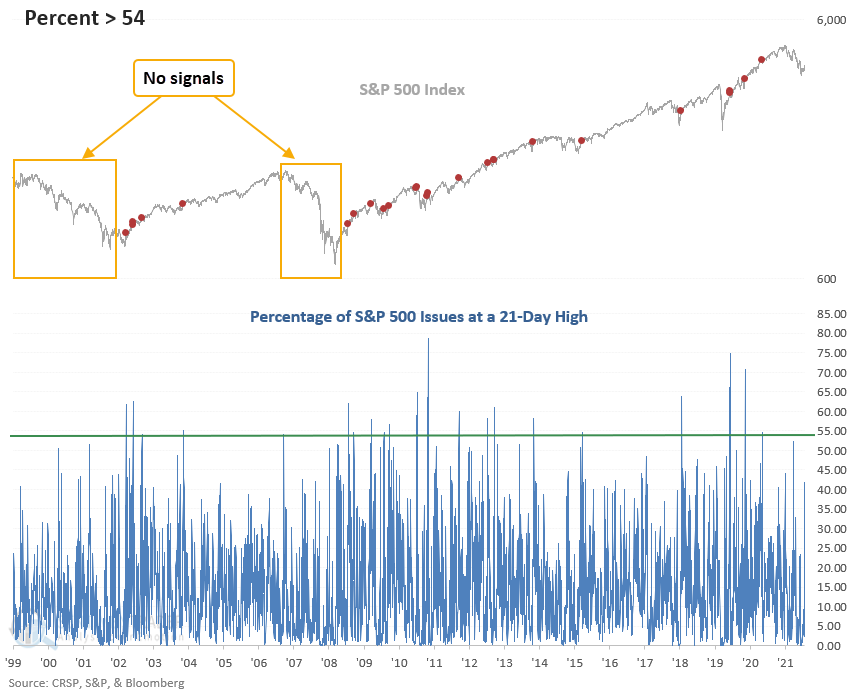
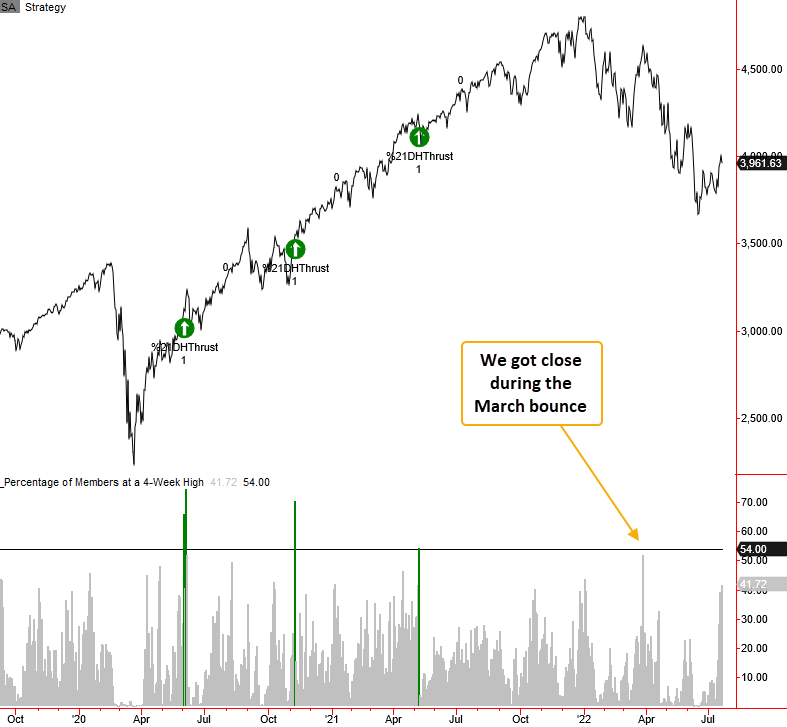
- The number of S&P 500 issues registering a 21-day high remains below a critical level
- A surge above 54% would trigger a TCTM composite thrust model component signal
- The S&P 500 rallied 72% of the time over the next year after all signals
- If I isolate bear market instances since 1950, the S&P 500 has rallied 100% of the time over the next year
A breadth signal that has an excellent modern-day track record in forecasting an end to a bear market
Today's note aims to review one of the components in the TCTM Composite Thrust Model, as its track record in forecasting an end to a bear market since 1950 is excellent.
You can follow this indicator on our website and save the signal to your favorites folder in the backtest engine. Backtest engine signals may show slightly different results as the data from today's study utilizes a separate database from the backtest engine.
The algorithm identifies when the number of S&P 500 members registering a 21-day high exceeds 54%. I screen out repeats by requiring the number to fall below 10% before a new signal can trigger again.
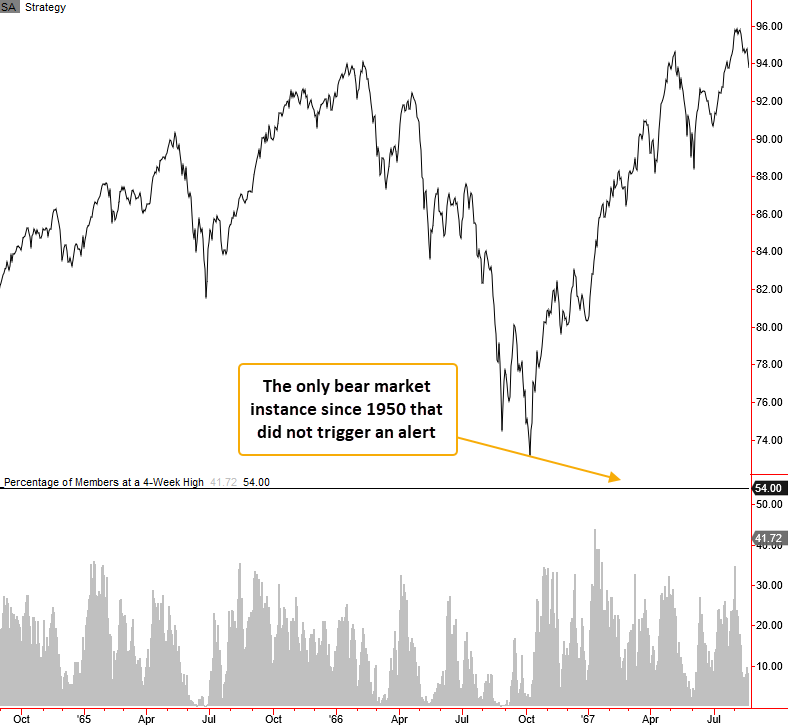
During bear market phases since 1950, the percentage of issues registering a 21-day high fails to increase above the threshold level for a signal. When it does exceed the threshold level, the alert has a perfect record since 1950, with only one non-signal after a bear market, which occurred in 1966.
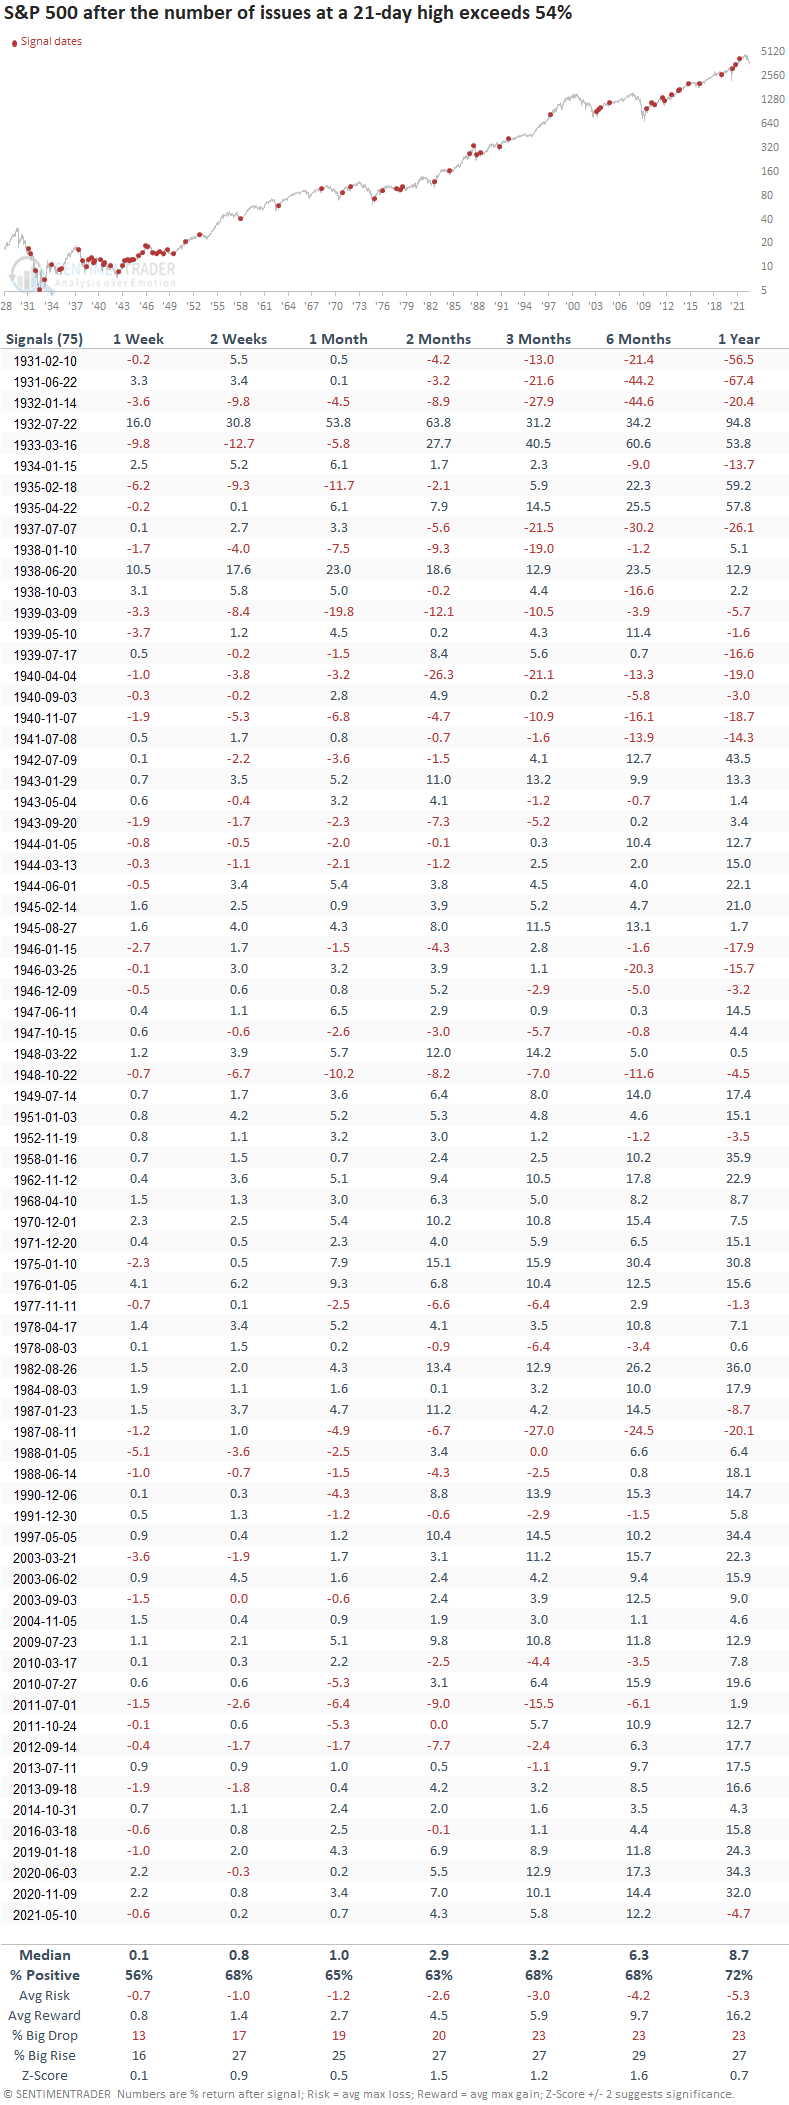
All signals since 1929
This model generated a signal 75 times over the past 91 years. After the others, S&P 500 future returns, win rates, and z-scores were better than historical averages across almost all time frames. Signals were more common during the volatile 1929-1949 period and more likely to produce an unfavorable whipsaw situation.
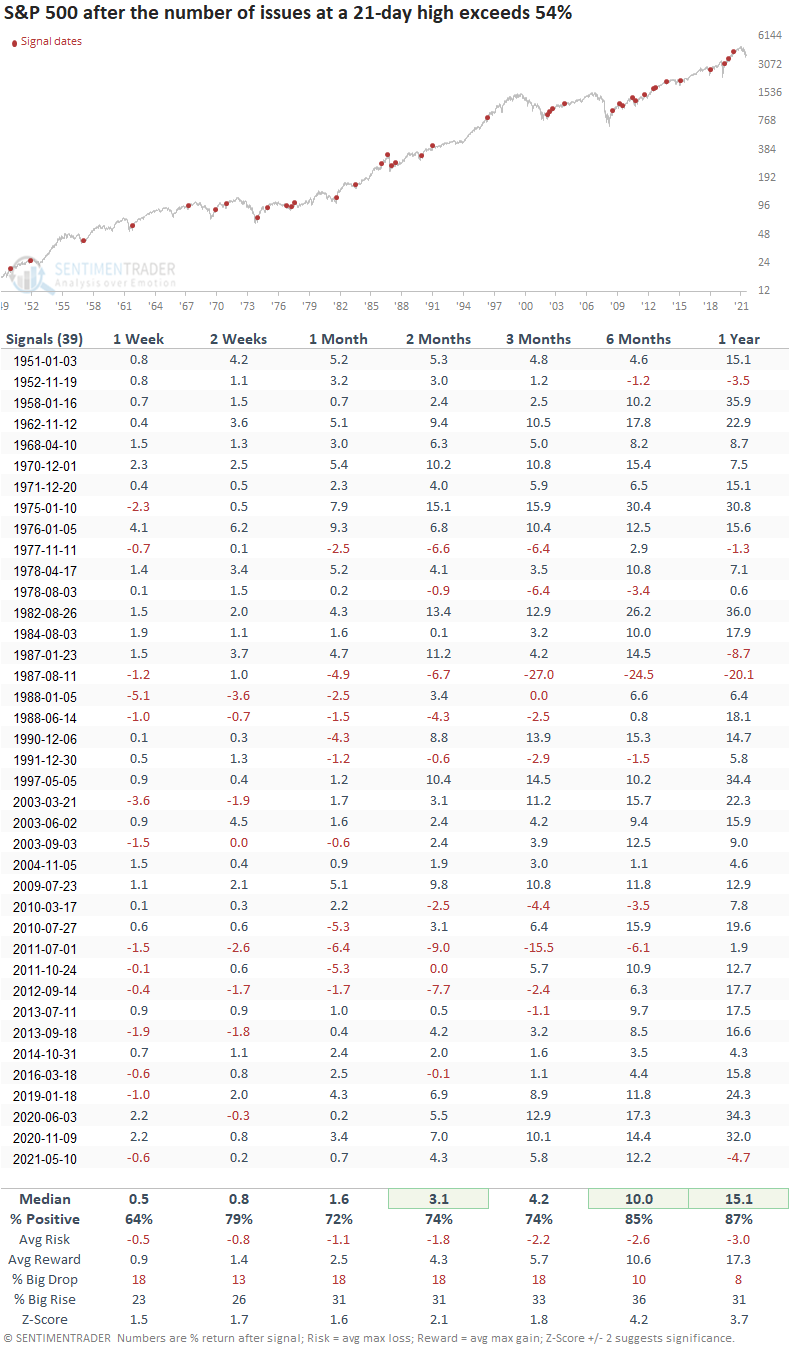
All signals since 1950
This model generated a signal 39 times since 1950. After the others, S&P 500 future returns, win rates, and z-scores show a noticeable improvement compared to all instances since 1929.
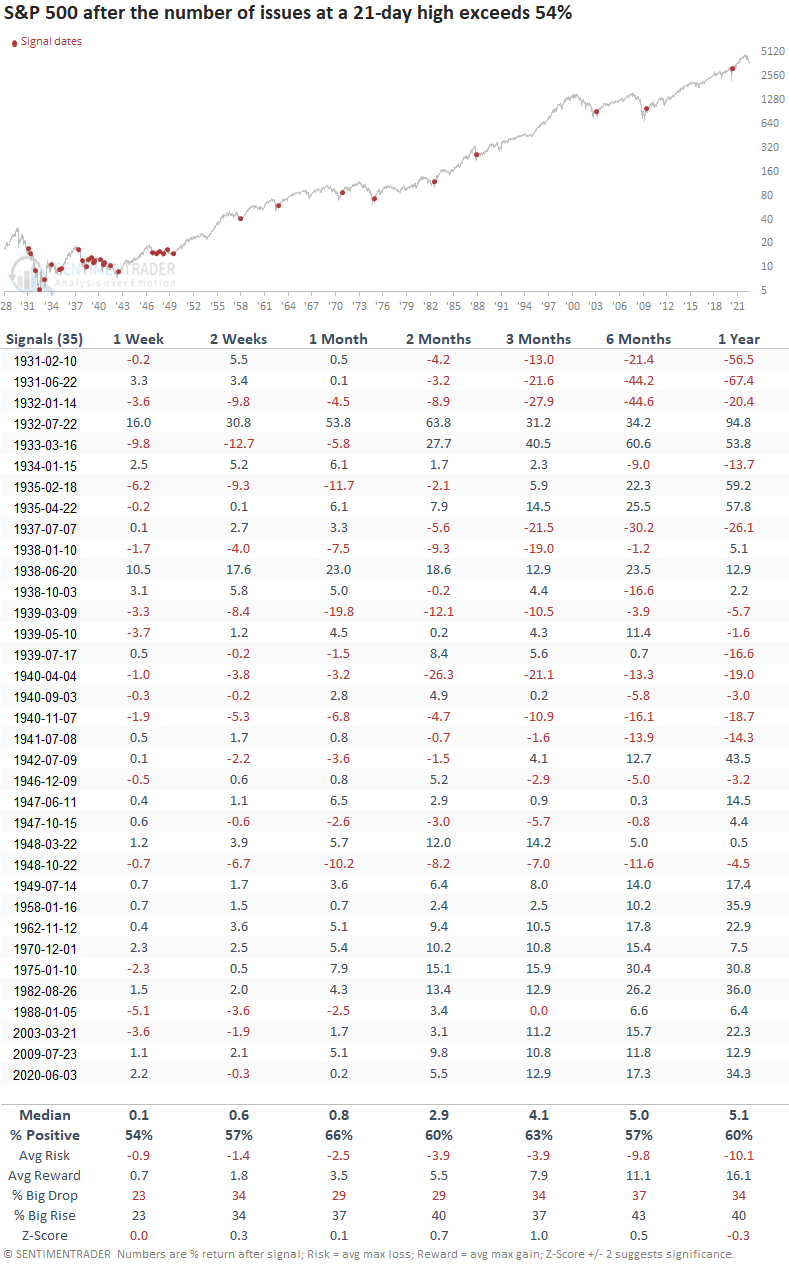
Signals associated with a bear market since 1929
If I isolate instances that occurred after the S&P 500 closed down 20%, the model generated a signal 35 times in the last 91 years. After the others, S&P 500 future returns and win rates were favorable, but z-scores look far less robust. Once again, the 1929-49 period impacted the results.
Signals associated with a bear market since 1950
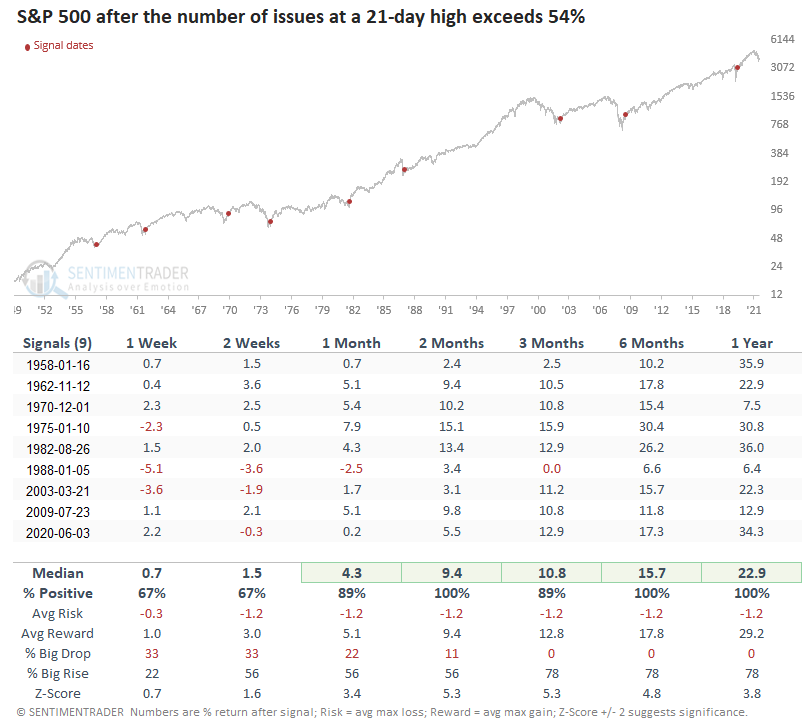
If I isolate bear market instances since 1950, the model generated a signal 9 times. After the others, S&P 500 future returns, win rates, and z-scores were excellent. The alert shows a perfect record 2, 6, and 12 months later.
Let's zoom in and review some of the bear market signals/charts since 1957.
Current day chart example
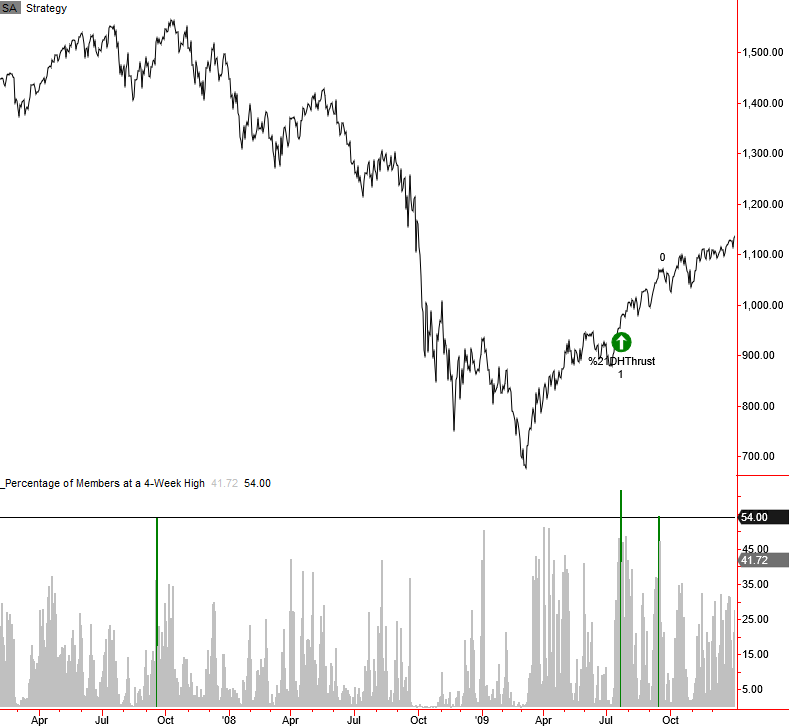
2007-08 bear market chart example
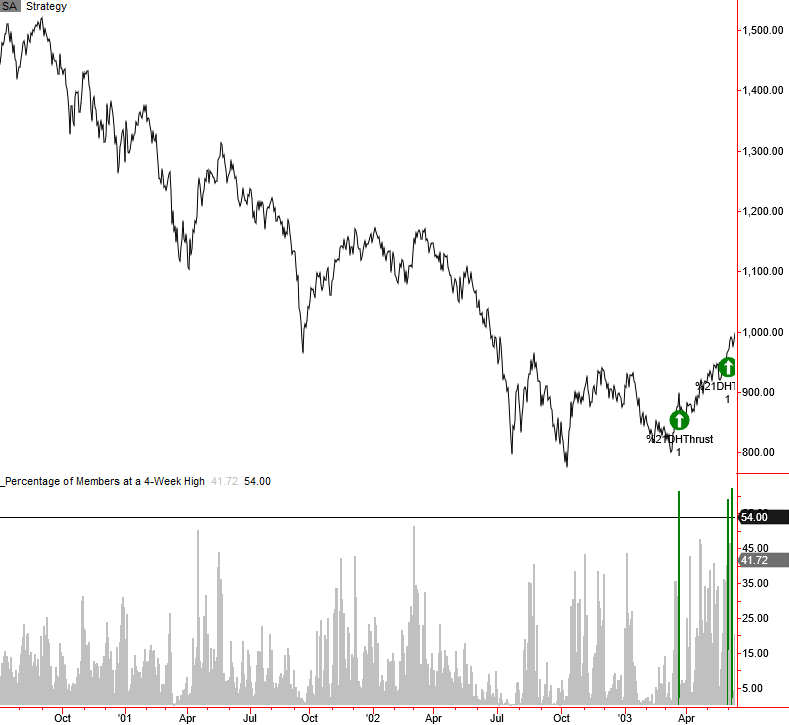
2000-02 bear market chart example
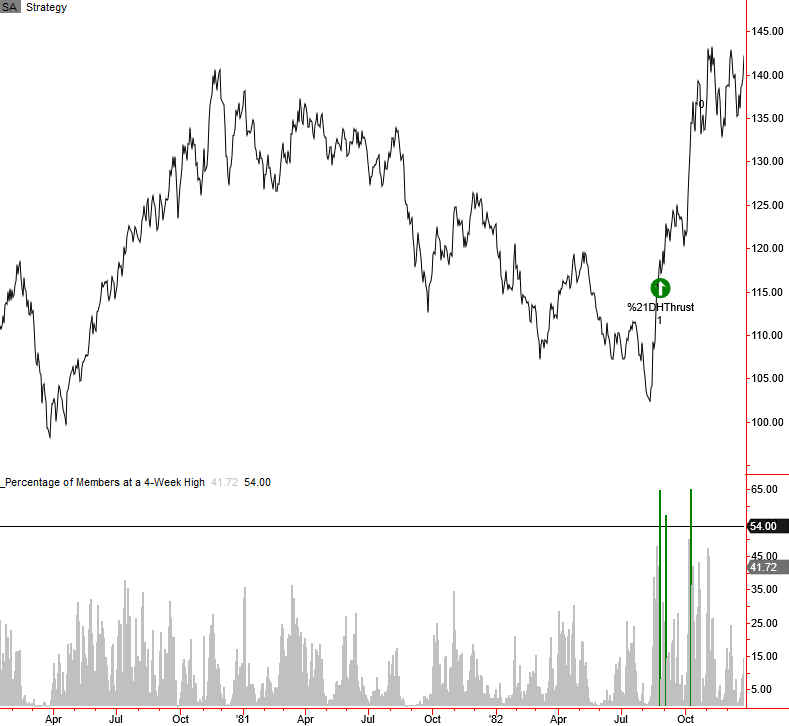
1980-82 bear market chart example
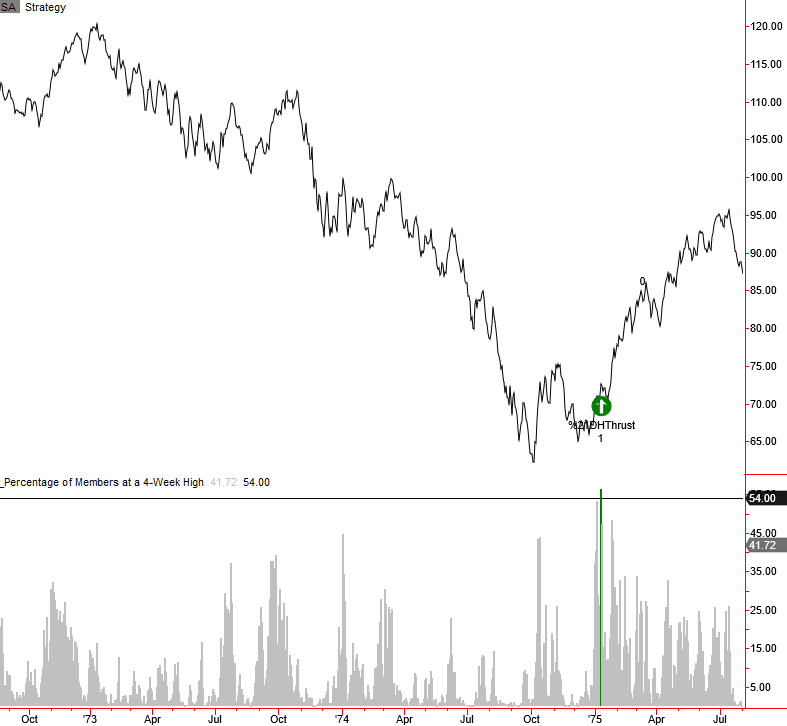
1973-74 bear market chart example
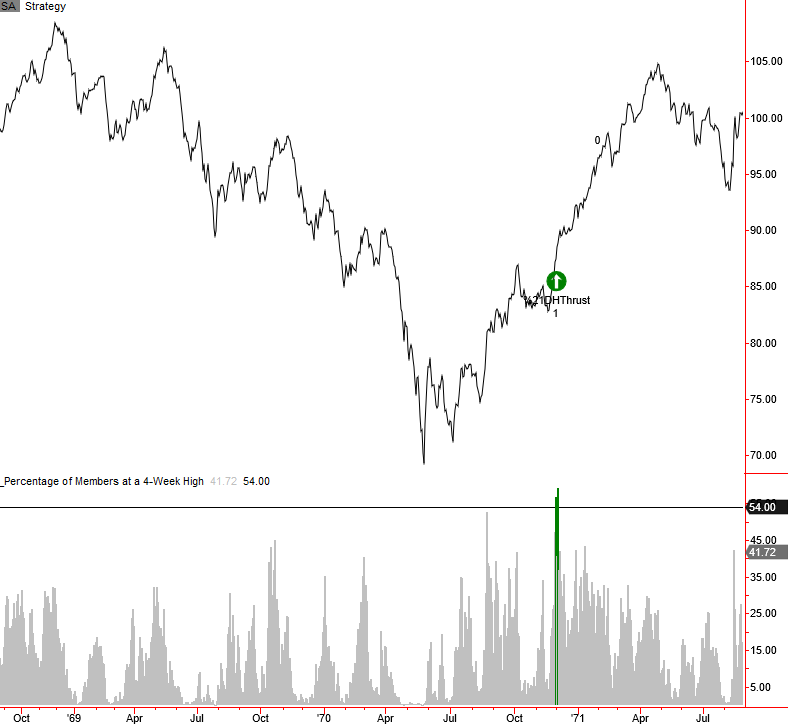
1968-70 bear market chart example
1966 bear market chart example
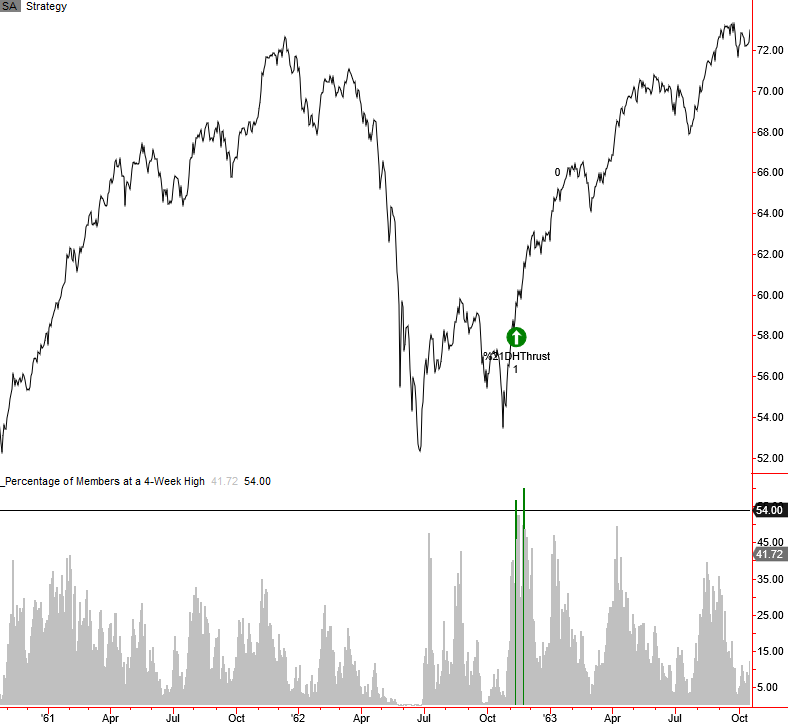
1962 bear market chart example
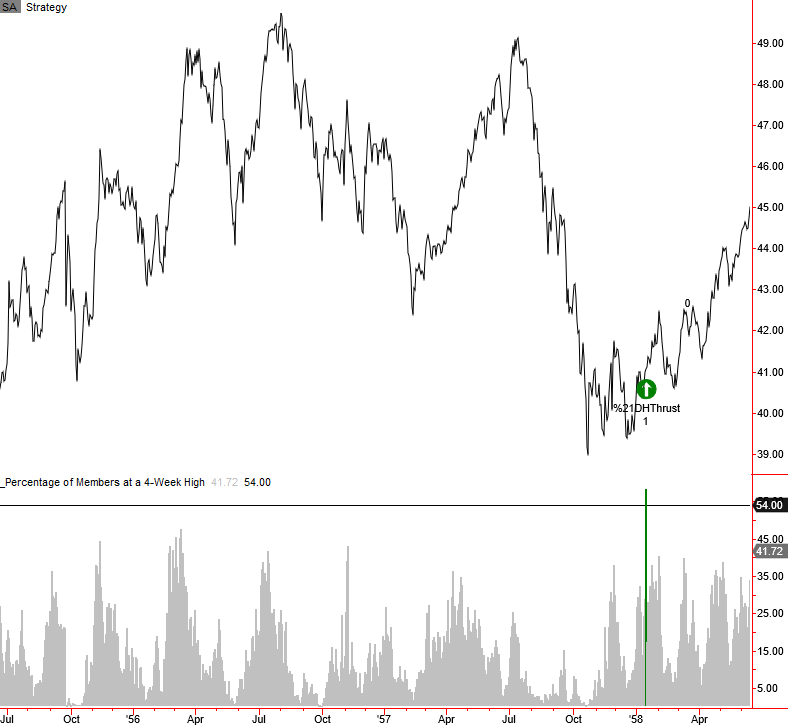
1956-57 bear market chart example
What the research tells us...
When the number of S&P 500 issues registering a 21-day high exceeds 54%, short-term breakouts amongst index members suggest broad participation, which typically leads to more upside in index prices. If we isolate bear market instances since 1950, the signal has a 100% win rate 2, 6, and 12 months later. And the model maintains a consistent track record with an alert in 9 out of 10 bear market cases in the modern era.