
A contrary take on economic data

Key points
- The Purchasing Managers Index measures the strength of the manufacturing sector
- The stock market is a barometer of overall economic activity
- Contrary to most interpretations, low PMI readings have been bullish for stocks
NOTE: Please check out our revitalized Intraday Minutes feature for real-time thinking and updates from the Sentimentrader analysts.
Stocks versus the PMI
We've repeatedly been told that the economy is not the stock market. And yet, many investors continue to confuse the two.
Both stocks and the Purchasing Managers Index (PMI) are economic indicators. The PMI measures the health and direction of the United States' manufacturing sector. It can range between 0 and 100, with a number over 50 citing expansion and under 50 noting contraction. Investors instinctively prefer a strong PMI, indicating a strong economy.
The stock market, however, tends to take a slightly different view. This is likely because the stock market is a discounting mechanism that anticipates changes forthcoming in the economy.
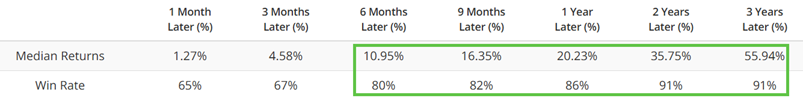
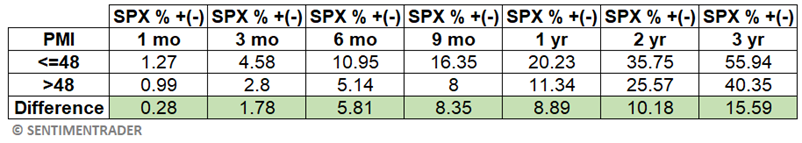
Let's look first at PMI readings of 48 or lower, representing only 20% of all months since 1990. Most investors instinctively expect below-average stock market performance following lower PMI readings. In reality, the S&P 500 performed strongly after these low readings, with a median gain of over 20% during the following year.
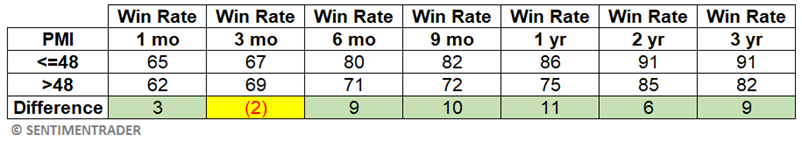
Now, let's consider stock market performance following all PMI readings above 48, representing 80% of all months. Even though returns following high PMI readings were positive, the S&P 500 showed a higher average return following low PMI readings than high ones and was more consistently positive.
Applying a systematic approach
While buying and selling stocks based solely on the PMI is not recommended, it can be helpful to know how to use our Backtest Engine, and understand the difference between viewing an indicator merely as weight of the evidence versus applying specific trading rules.
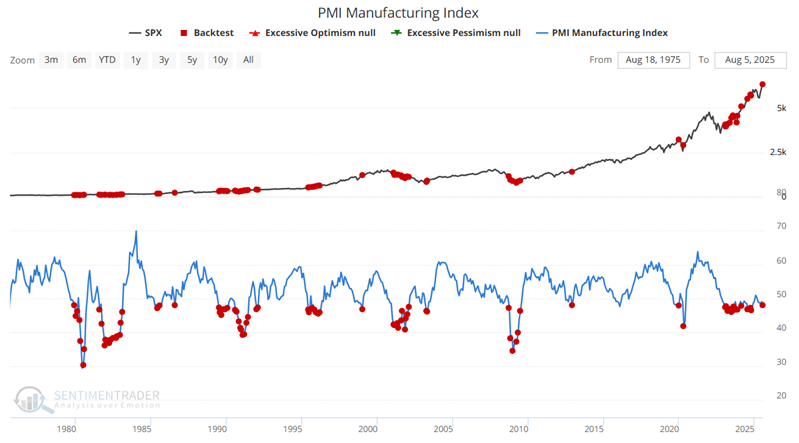
For our test, we go to Backtest Engine 2.0 and invest in the S&P 500 Index for twelve months when the PMI is 48 or below for the first time in twelve months. To run this test yourself, click here.
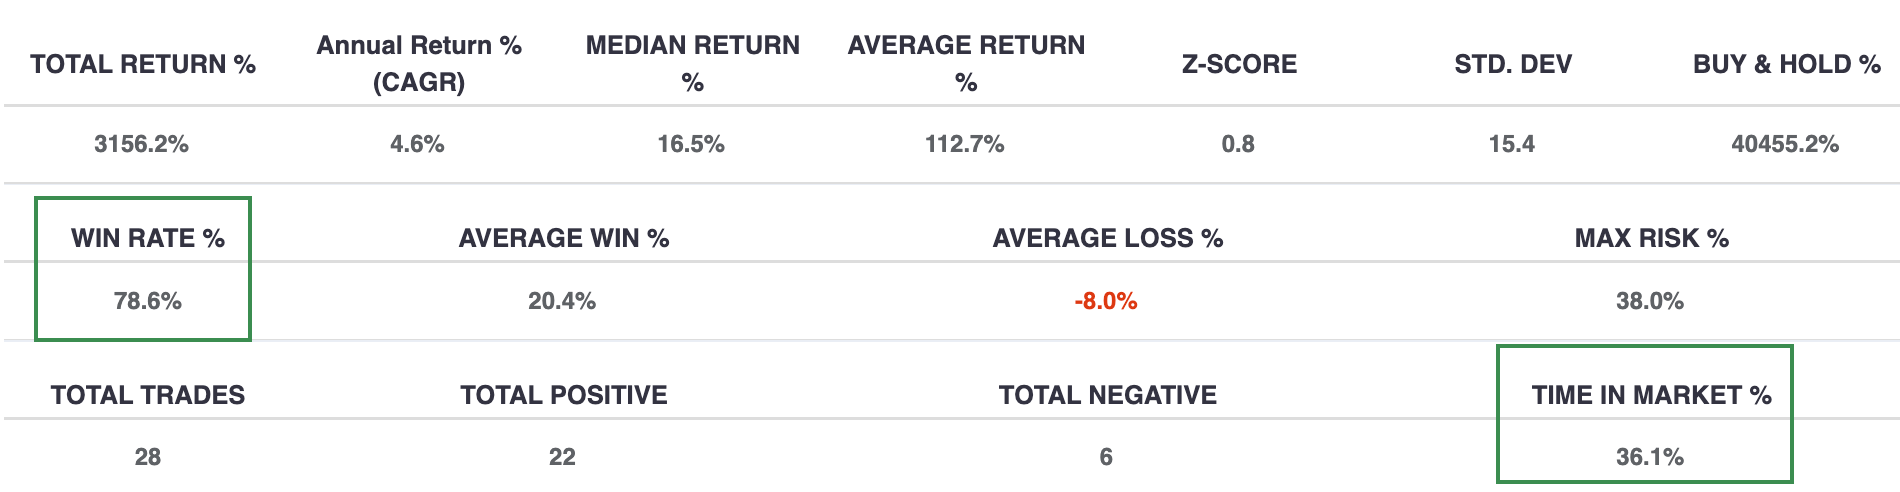
The entry and exits are highlighted below. This strategy has been in the market 36% of the time with a 79% win rate.
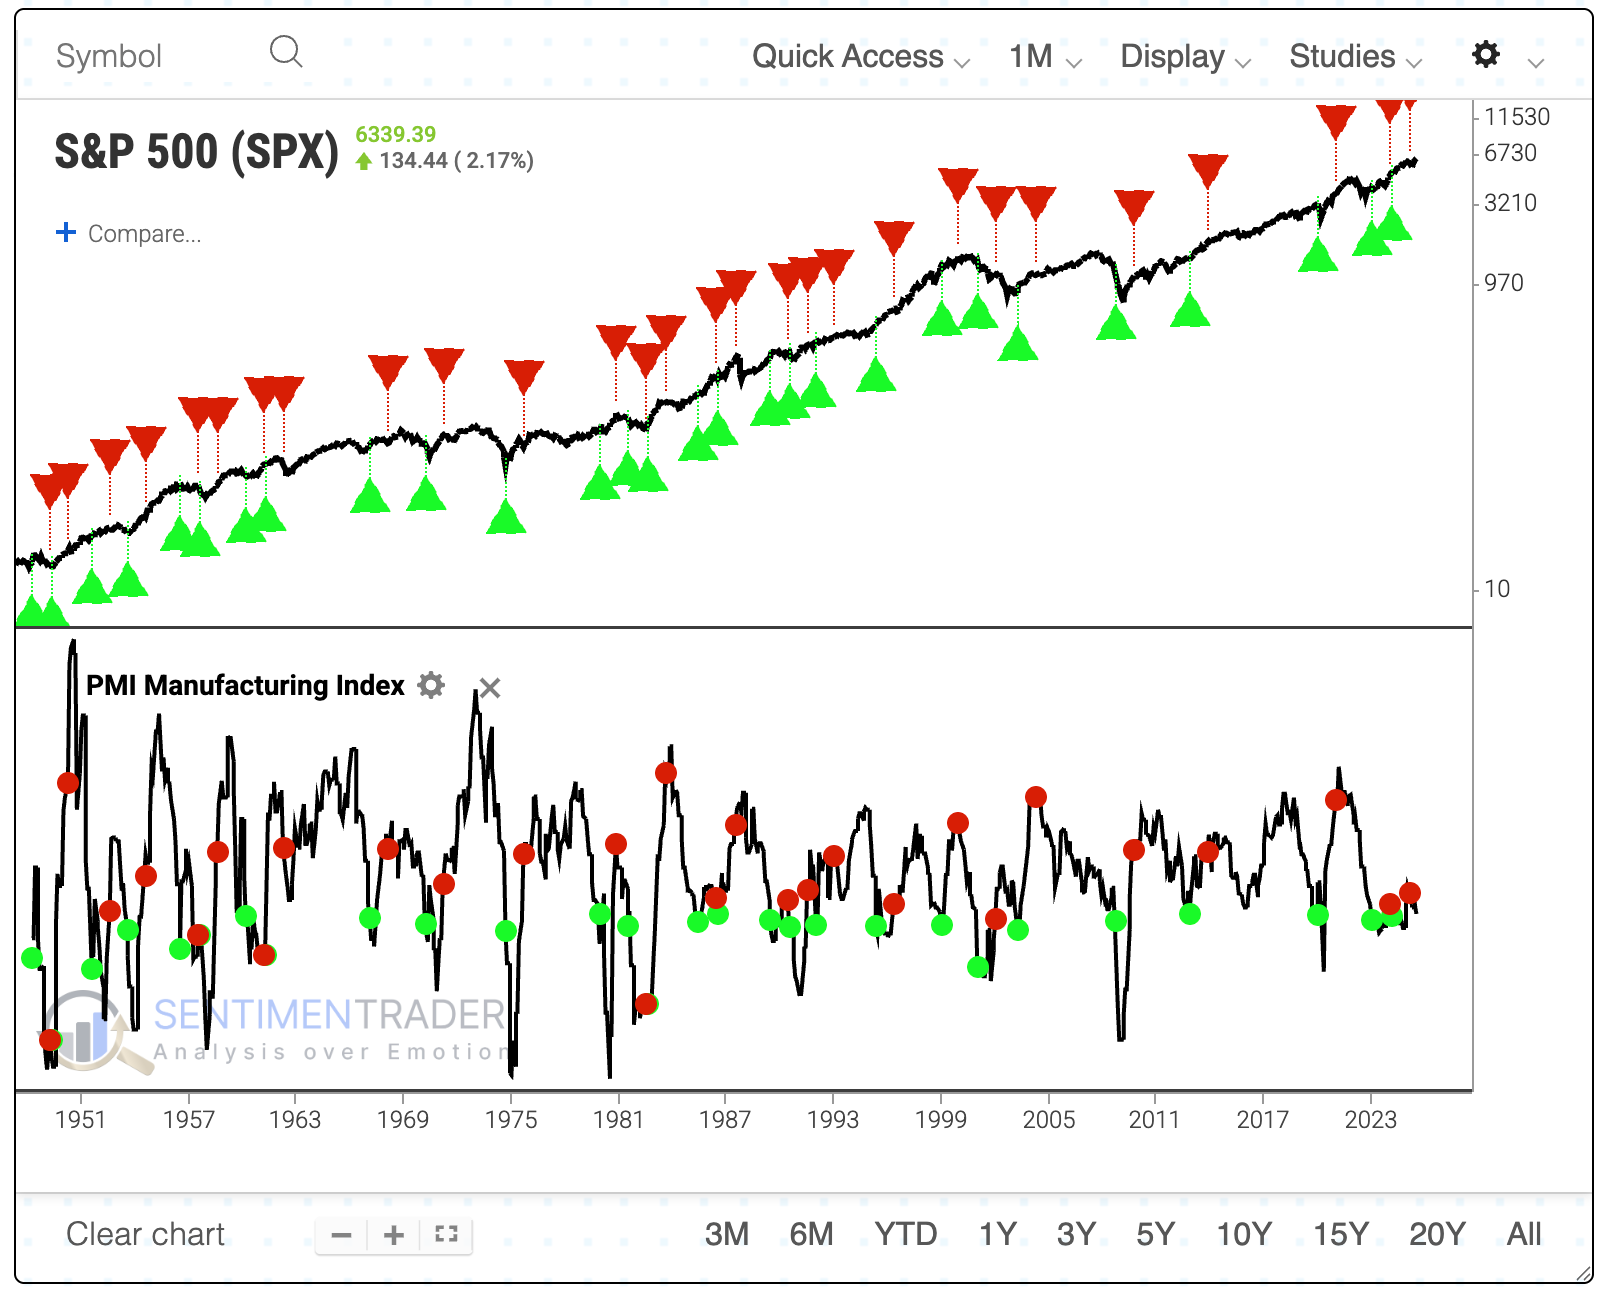
The drawdowns in the equity curve tended to be relatively muted, with exceptions in 2002, 2008, and 2020. This suggests that, except for periods of extreme economic turmoil, the stock market typically looked ahead of the low PMI readings and anticipated better times.
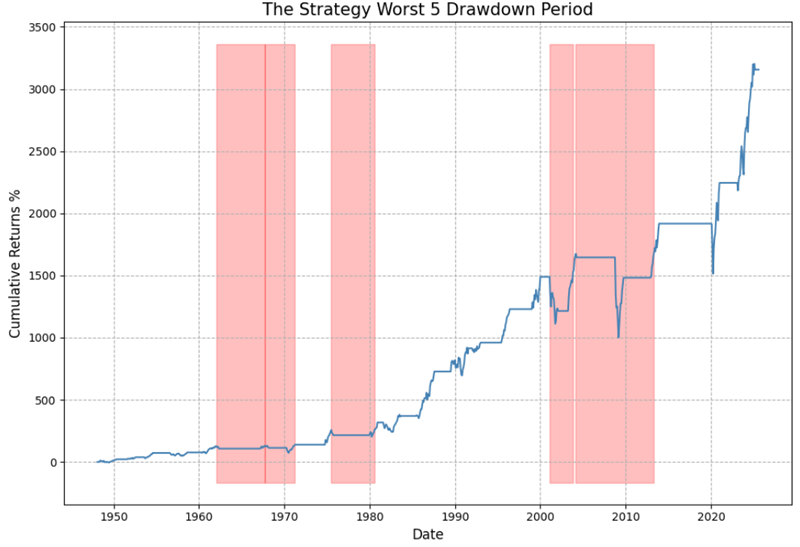
When analyzing any trading strategy, one key consideration is how much of a decline a trader would have to endure to obtain the ultimate result.
The table below highlights four trades that experienced a sizeable loss before bouncing back to show a gain (1970, 1990, 2019) or a significantly smaller loss (2008) over the following year. Each declined at least 14% within the year before bouncing back, showing that even some "successful" signals involved some pain.
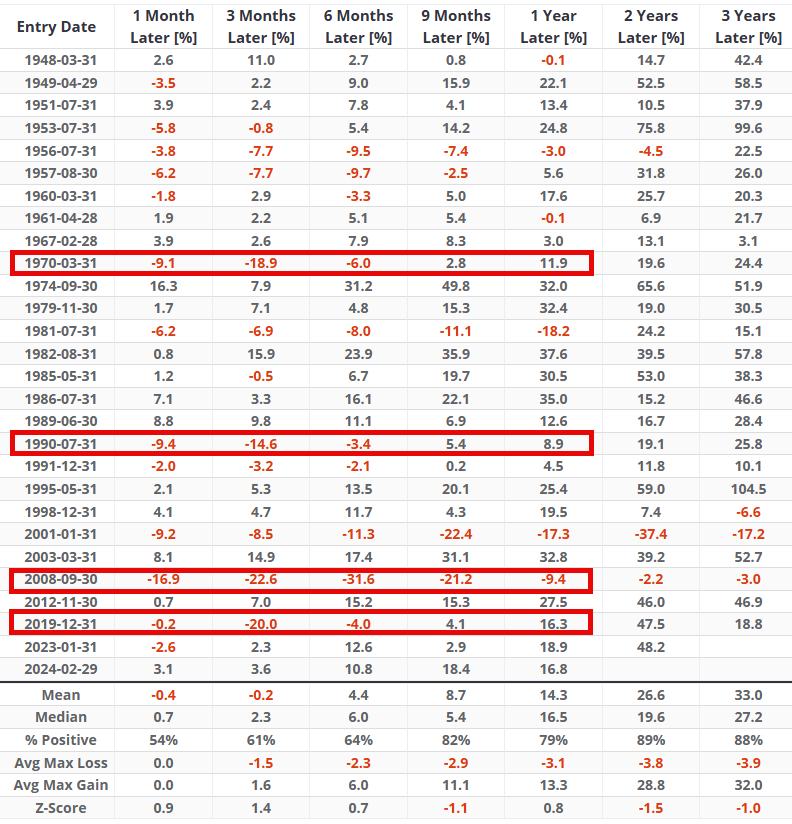
There are no hard-and-fast rules for deciding whether or not to place a stop-loss order and how much to risk per trade. The point is that this information can help a trader set realistic expectations regarding what to expect from their strategy.
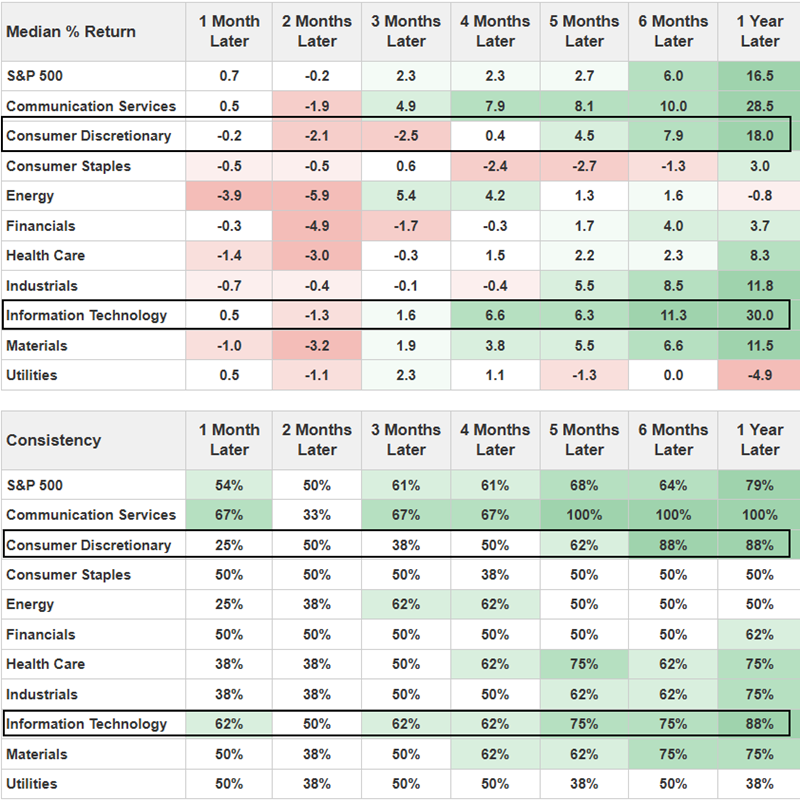
Another consideration for any system that generates trading signals is what to trade. After these PMI signals, consumer discretionary and technology both showed higher win rates and median returns than the S&P 500. Again, this suggests that investors looked ahead and anticipated a rebound in consumer and business spending. Communication services results are based on a shorter history.
What the research tells us...
The PMI is primarily a contrarian indicator for stocks. Low readings typically occur later in an economic slowdown or turndown. As the stock market anticipates a positive reversal of fortune, stock prices tend to rise.
The latest readings have been low, suggesting a poor economic environment. However, such low readings have historically preceded not only positive stock returns but also above-average ones.