
A Contrarian Setup in Long-Term Treasuries

Key points
- With the Fed cutting interest rates, there is a natural tendency to be bullish on bonds
- That said, the Fed has a great deal of influence on short-term interest rates, but not nearly as much on long-term rates
- Two factors - seasonality and high-yield bond breadth could weigh on long-term treasuries in the near-term
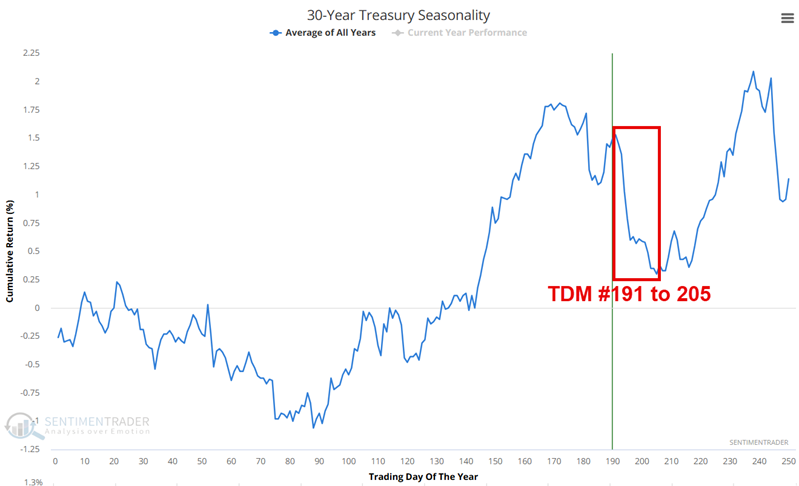
T-bonds enter one of the weakest seasonal periods of the year
The charts below show the Annual Seasonal Trend for the 30-year treasury bond futures contract and highlights the period extending from the close on Trading Day of the Year (TDY) #91 through TDY #205. For 2025, this period extends from the close on September 29th through the close on October 17th.
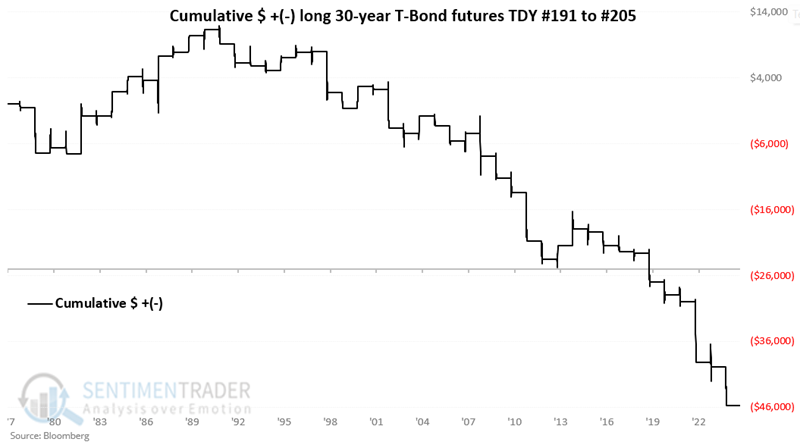
The chart below displays the hypothetical cumulative dollar gain/loss achieved by holding a long position in t-bond futures only during this seasonal period every year since 1978.
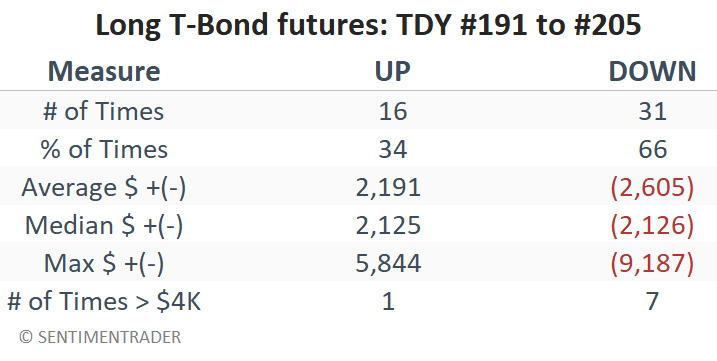
The table below summarizes the results.
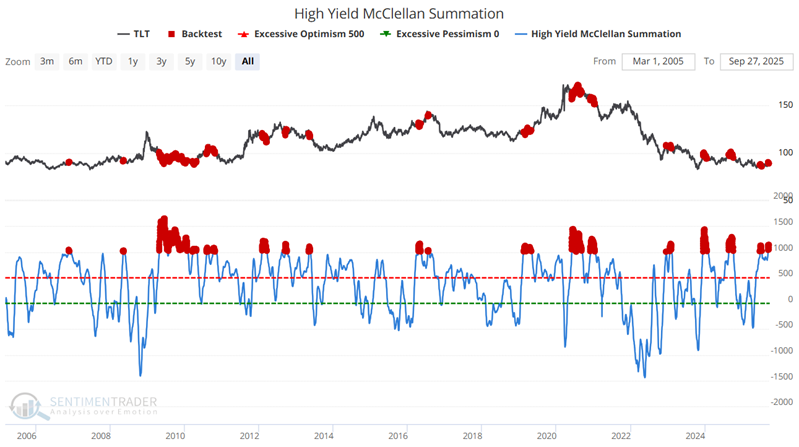
A warning sign from high-yield bonds
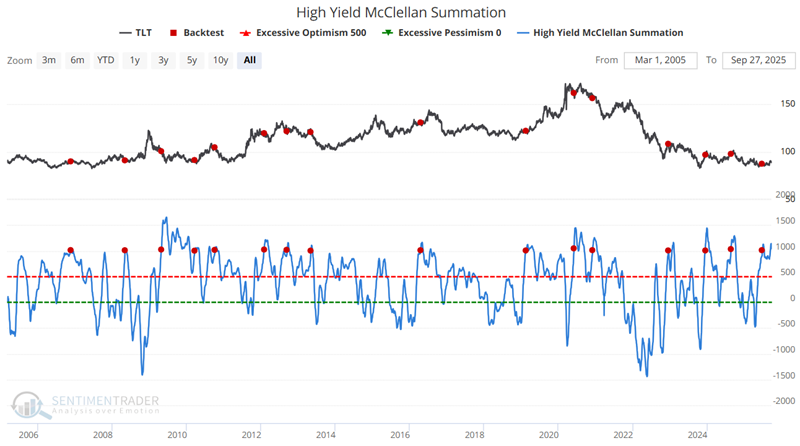
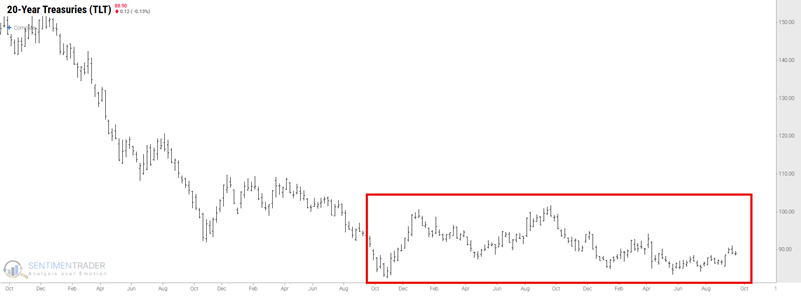
High-yield corporate bonds and long-term treasuries actually have a slightly inverse correlation. Thus, strength in high-yield bonds can sometimes be a warning sign for long-term treasuries. One example is shown in the chart below, which highlights all dates when the High-Yield McClellan Summation indicator was at 1,000 or higher. As of September 26th, this indicator value stood at 1,047.
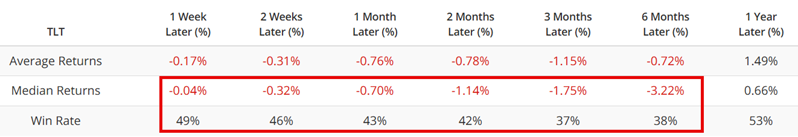
The table below summarizes the performance of the iShares 20+ Year Treasury Bond ETF (TLT) following the dates highlighted above.
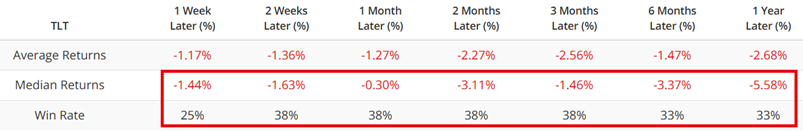
Now, let's remove some overlapping signals from the test above. The chart below highlights only those dates when the High-Yield McClellan Summation indicator crossed above 1,000 for the first time in six months. By this standard, the most recent signal occurred on June 27th.
The table below summarizes TLT performance following the signals shown above.
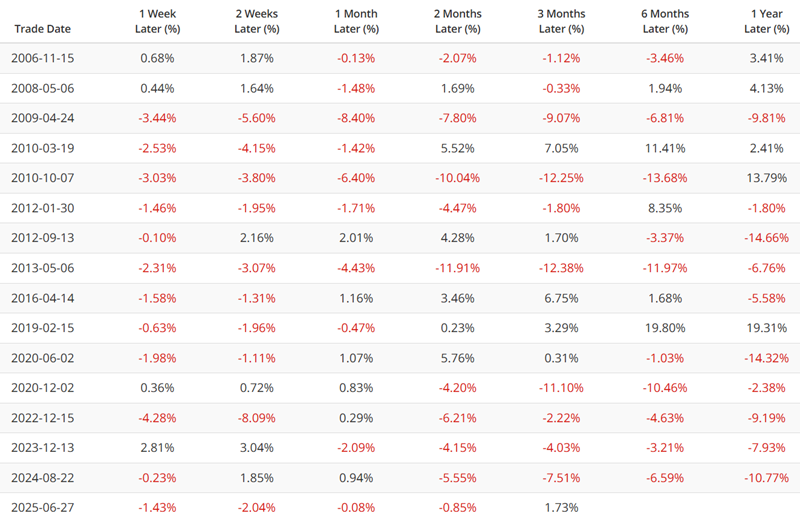
The table below displays signal-by-signal performance for TLT following previous signals.
Two thoughts on the longer-term trend
The danger in playing the short side of treasury bonds rests primarily in the fact that they seem "due" for a rally, particularly in the face of a newly accomodative Fed. Some argue that bonds have been basing in a sideways pattern for over two years, which "should" be followed by a rally. There is a chance that this theory will prove correct, thus a stop-loss order on any short positions is essential.
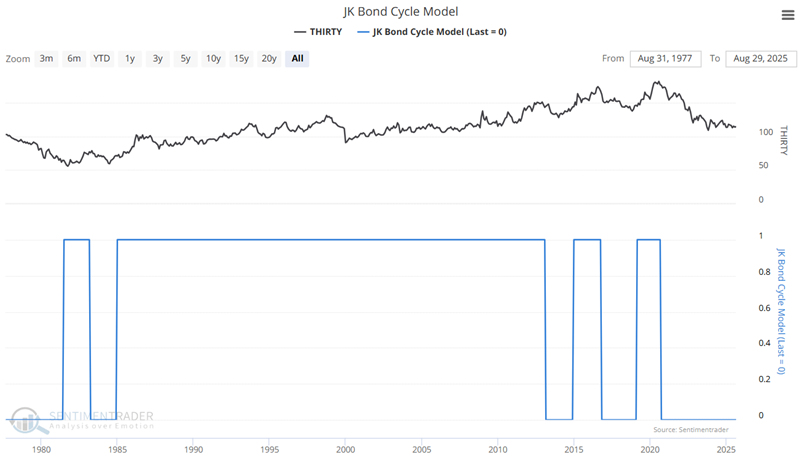
One the other hand, the JK Bond Cycle Model remains in unfavorable territory - as it has been since September 2020 - with no real signs of a turnaround. This suggests that the primary trend for long-term treasuries remains unfavorable.
A word regarding real-world trading
The most straightforward approach for a trader wishing to play the short side of long-term treasuries would be to sell short T-bond futures contracts. However, futures trading entails a great deal of leverage and risk, which is elevated due to a more accommodative stance by the Fed. If long-term interest rates trend lower in the near term, long-term treasury bonds - which are a pure play on long-term interest rates - will advance in price. So, a stop-loss point is essential for any trader considering the short side. An alternative for non-futures traders is to trade options on ticker TLT. Buying a put option or selling a call credit spread can allow a trader to profit from a decline in TLT while enabling them to limit their risk to a defined amount.
What the research tells us…
Now that the Fed has cut interest rates, the conventional wisdom is that rates will now trend lower and that bond prices will rise. And, yes, this is a distinct possibility. However, it is not a sure thing, particularly regarding long-term interest rates, over which the Fed has much less influence than short-term rates.
As always, seasonality is merely an average of what has happened in the past and is not a roadmap to what will happen in the future. Nevertheless, the point here is that there has been an obvious downside bias to long-term treasury bond prices in October. The action of the high-yield indicator detailed above should also not be utilized as a standalone trading system for long-term treasury bonds. However, the recent action of this indicator does lend weight to the bearish case for long-term treasuries in the months ahead.