
A contrarian sector

Key Points
- A recent favorable combination of sentiment and seasonality for the retailing sector got run over by the late February market selloff
- Those factors remain in force as another favorable seasonal headwind begins to blow
- In the last five decades, certain months of the year have typically been much more favorable for Consumer Discretionary stocks than others
The current state of the retailing sector
On 2/9/2022, I published this article regarding the retailing sector. From there, the sector quickly "fell out of bed" as the overall market tanked, then tried to stage something of a rally on 2/24/2022. In the weekly bar chart of XRT below (courtesy of StockCharts), one trader will see security in the early stage of an emerging downtrend, and another trader will see a security that is extremely oversold and due for a rally.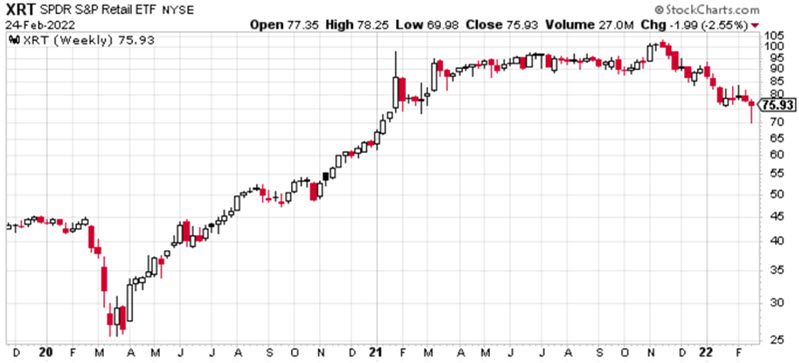
Which outlook will prove correct? We can't say with certainty. However, some evidence has accrued on the bullish (contrarian) side of the ledger for consideration.
The best months for the retailing sector
We will use the S&P 500 Consumer Discretionary Index (heretofore referred to as SCDI) for testing purposes. We will look at the monthly total return performance for SCDI during:
- March, April, May, July, November, and December each year
- versus all other months
- From January 1977 through December 2022
The chart below displays the cumulative total return for SCDI ONLY during the six "favorable" months.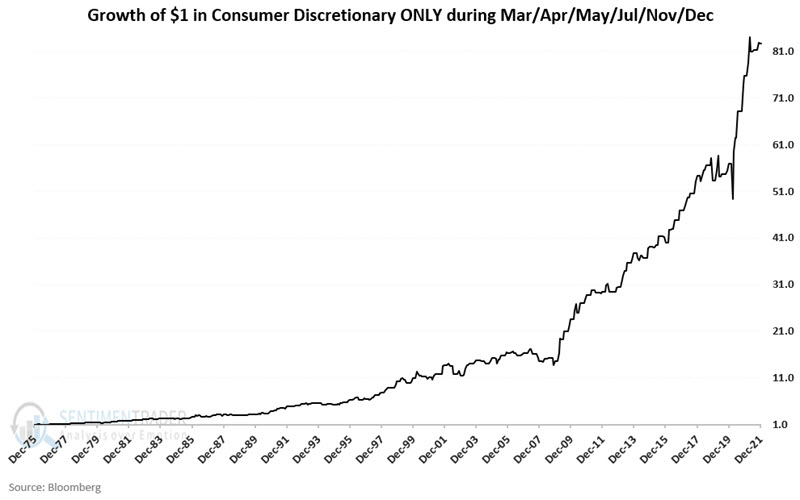
The chart below displays the same data on a logarithmic scale to better highlight the consistency of performance during these months collectively.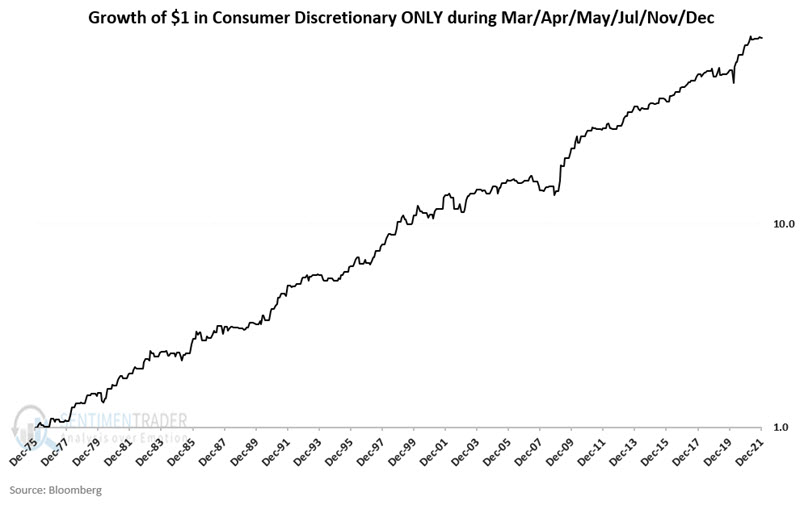
The sector can and does decline from time to time during these "seasonally favorable" months, but the "lower left to upper right" nature of the equity curve is fairly steady over time. All told, the sector index grew +8,172% during these months.
The "other" months
The chart below displays the cumulative total return for SCDI ONLY during "all other months"
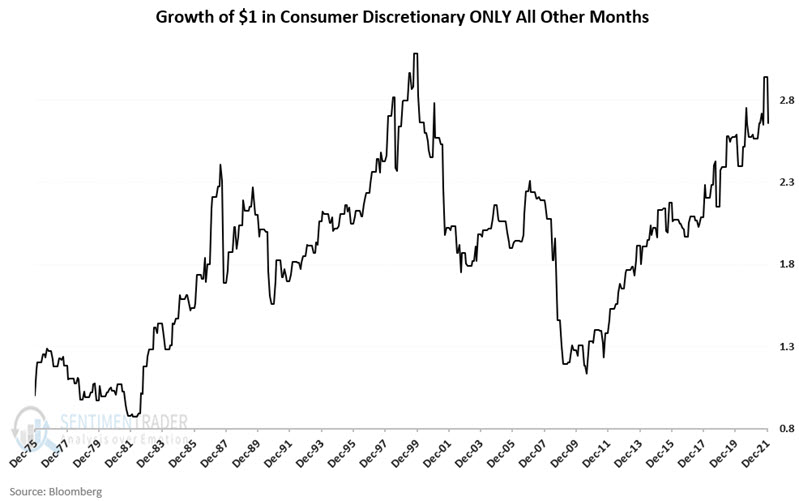
The results during these months have been significantly less consistent. All told, the sector index grew +166% during these months.
Best months versus other months
The relevant comparative numbers appear below.
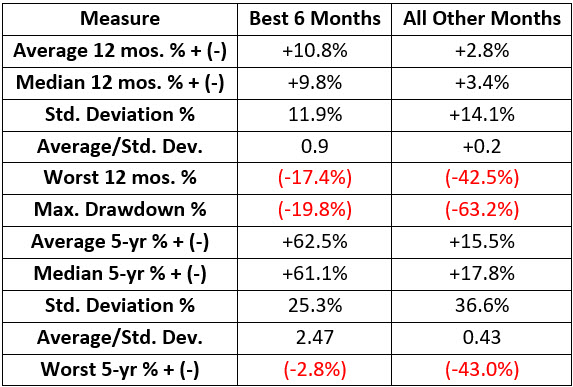
It would be incorrect to refer to "All Other Months" as "bearish." As you can see in the chart above, SCDI performed very well during these months during stretches of the '80s, '90s, and since the low in 2009. But what we are really comparing here is:
- Cumulative results
- Relative consistency
The question we are looking to answer is, "when is the best time to allocate capital to the consumer discretionary sector. The data appears to answer that question. To wit:
- The Favorable Months showed a gain 31 times that of All Other Months (+8,172% vs. +166%)
- The Favorable Months had a significantly lower standard deviation of returns (11.9% vs. 14.1%)
- The worst drawdown during the Favorable months was a manageable -19.8% (versus -63.2%)
- The Favorable Months showed a 12-month gain 83% of the time (versus 62%)
- The worst 5-year performance for the Favorable Months was a loss of -2.8% (versus -43%)
What the research tells us...
Can we say with certainty that these six months will continue to see better performance ad infinitum into the future? Not necessarily. Still, investing is a lot about finding an "edge" and exploiting it as often as possible and for as long as possible.
With March 1st just around the corner, investors willing to assume the risks of a contrarian position might take another look at ticker XLY (Consumer Discretionary Select Sector SPDR Fund), which tracks the index used in the test above with a correlation of roughly 0.998.