
A contrarian play in TLT

Key points
- T-bonds have been a dreadful performer for over five years
- On the plus side, TLT has been forming a base for 20 months and is entering the most favorable seasonal period of the year
- For those willing to adopt a contrarian stance, it may be "soon or never" for TLT
T-bonds have been lagging but basing for almost two years
The chart below shows that the iShares 20+ Year Treasury Bond ETF (ticker TLT), which topped out in 2020, plunged over 50% into October 2023, and has been trading sideways ever since.
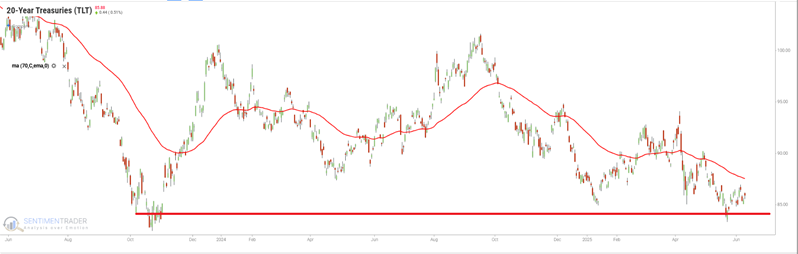
While TLT has essentially "gone nowhere" for 20 months, from a classical technical analysis perspective, some would argue that TLT is "building a strong base." From there, typically (and theoretically) speaking, a strong base ultimately launches a strong rally. We can't predict how this particular situation will play out; however, for those willing to take a contrarian position, TLT offers:
- A solid technical base
- A built-in stop-loss level (below the October 2023 low)
- A potential seasonal tailwind starting now
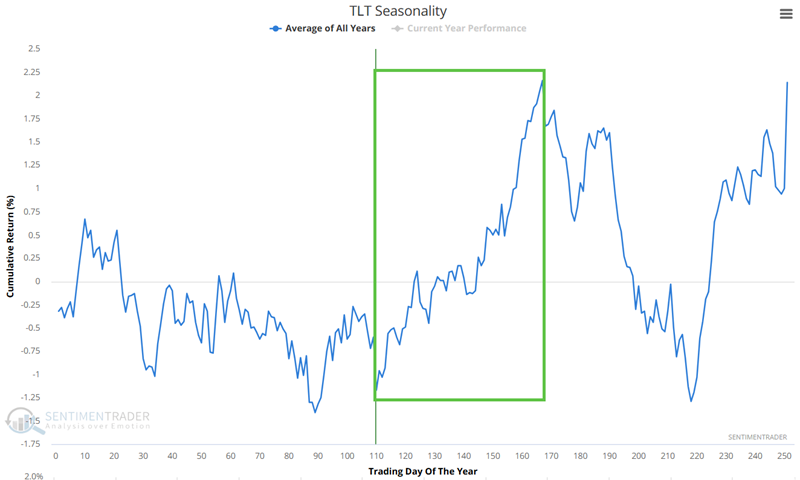
TLT seasonality turns favorable
The Annual Seasonal Trend chart below for ticker TLT shows an unfavorable period that extends from the close of Trading Day of the Year (TDY) #110 through TDY #167. For 2025, this period extends from the close on 2025-06-11 through 2025-09-03.
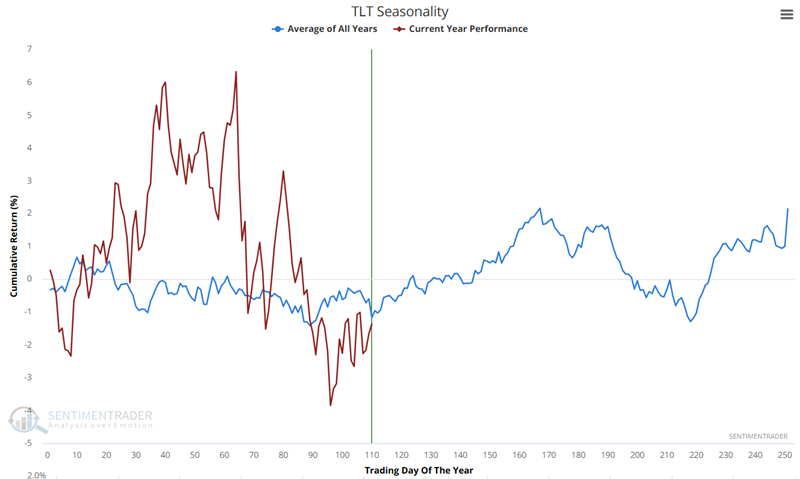
The chart below overlays actual 2025 TLT performance over the Annual Seasonal Trend chart.
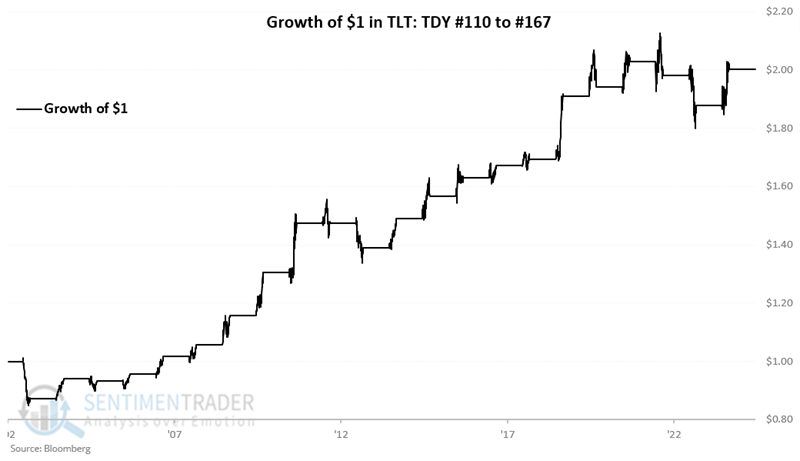
The chart below displays the hypothetical growth of $1 invested in TLT only during this period, every year since 2003. This data reflects "price only" data and not "total return," which would include any dividends, which would serve to slightly increase results.
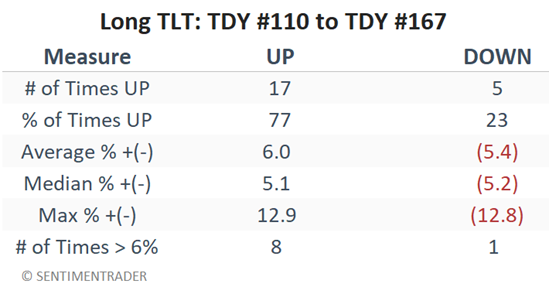
The table below summarizes TLT results during this period since 2003.
Trading TLT: Shares vs. Options
For a trader willing to speculate in a long position in TLT, the most straightforward approach would be to buy shares of TLT. However, at roughly $86 a share, this would involve a commitment of $8,600 to a speculative, contrarian position. An alternative would be to consider options on TLT.
What follows is not intended as a "recommended" trade, but simply as an example of one way to play a potential bounce in t-bonds via a relatively inexpensive option position. All screenshots below are courtesy of Optionsanalysis.com.
Since the favorable period extends through September 3rd, we will look at options expiring September 19th. The example trade below is a "bull call spread," which involves buying one call option at a lower strike price and selling another call with a higher strike price. Selling the higher strike price call reduces the cost of the position and creates the potential for option time decay to work in our favor if the price of TLT rises above a certain level.
The example we will consider involves:
- Buying 1 Sep19 TLT 87 strike price call @ $2.43
- Selling 1 Sep19 TLT 97 strike price call @ $0.32
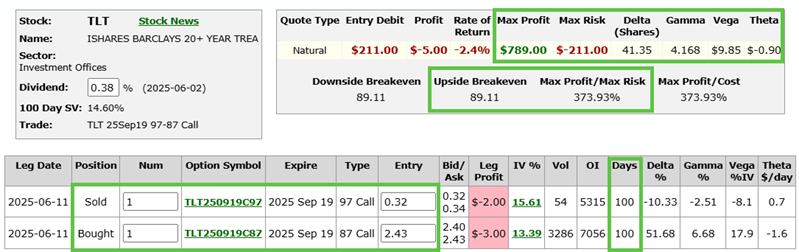
The screenshot below displays the trade particulars.
The table below displays the "30,000-foot" view of the risk curves (the expected $ P/L based on the price of TLT shares as of four different dates). The red line represents the current date, and the black line represents the expected P/L of the trade if held until the option expires on September 19th.
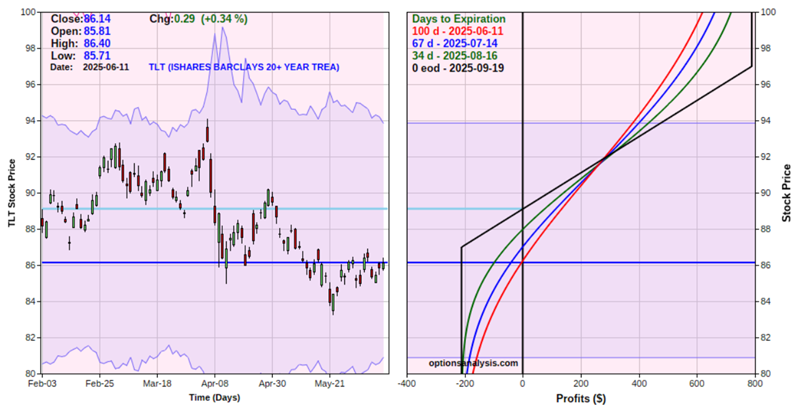
Things to note:
- The cost to enter a 1-lot (and the maximum risk) is $211 (a trader with a $25K account, willing to risk 2% could buy a 2-lot)
- The breakeven price (if the trade is held until expiration, which is not our intention) is $89.11 (the buy strike price plus the cost of the spread)
- The maximum profit potential is $789 (the difference between the strikes minus the cost of the spread, i.e., $97 - $87 - $2.11 times 100)
- The position has a "Delta" of 41.35, which means that at the moment, this position is roughly equivalent to holding 41 shares of TLT
- The position has a "Gamma" of 4.168, which means that the position will gain or lose that number of Deltas (i.e., it will become more or less price sensitive depending on whether TLT rises or falls $1 in price)
- The position has a "Vega" of $9.85, which means that the position will gain or lose $9.85 in value if volatility rises or falls one percentage point
- The position has a "Theta" of -$0.90, which means that the position will lose $-0.90 due solely to the passage of one day (i.e., "time decay")
Zeroing in on "where this trade lives"
From a trader's perspective, a stop-loss would make sense below the October 2023 low of $83.30, and an upside target of $90.21 to $94.09 (recent highs in TLT) also makes sense. Likewise, we would likely not expect to hold this position after the end of the favorable seasonal period on 2025-09-03. So, the risk curve chart below "zooms in" on this price range, and the purple line in the chart below represents the expected P/L as of 2025-09-03.
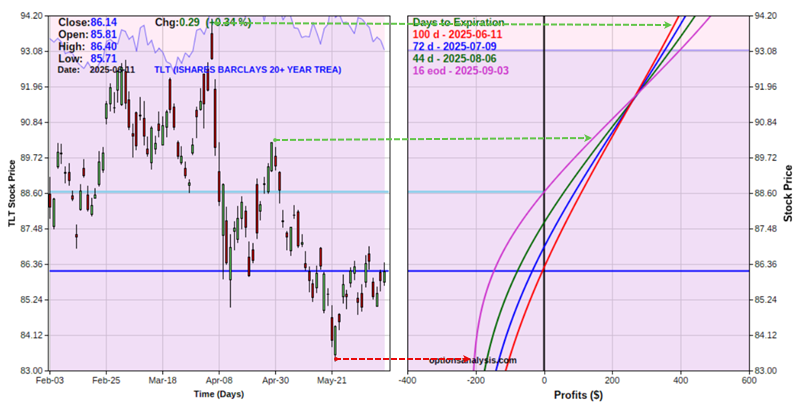
On the downside:
- If we exit the trade if TLT drops below $83.30, the expected loss would be between -$105 and -$205, depending on whether this occurs sooner (red risk curve line in chart above) or later (purple line in chart above)
On the upside:
- If we plan to take a profit or adjust the trade if TLT hits $90.21, our expected P/L would be between $190 and $130, depending on whether this occurs sooner (red risk curve line in chart above) or later (purple line in chart above)
- If we plan to take a profit or adjust the trade if TLT hits $94.09, our expected P/L would be between $389 and $408, depending on whether this occurs sooner (red risk curve line in chart above) or later (purple line in chart above)
What the research tells us…
Betting on a rally in t-bonds at this time represents a speculative, contrarian position, which is not every trader's cup of tea. Likewise, despite the seemingly solid "base" that TLT may (or may not) have formed, nor the history of decent price performance during the mid-June to early-September timeframe, there is no guarantee that TLT will rally in the months ahead. Still, for those willing to accept a reasonable risk, buying 100 shares of TLT at $86.14 (as this is written) with a stop-loss below $83.30 involves a commitment of $8,614 and an expected risk of roughly $300. Those willing to consider an option trade could enter a position with a much lower dollar commitment and a better percentage reward potential.
Still, speculators willing to take a measured risk using a contrarian approach (and confident they will not beat themselves up if they are "wrong") need only apply.