
A conservative strategy applied to volatile stocks

Key points:
- Some traders sell naked put options to accumulate a stock; most consider this to be a conservative strategy
- This strategy can lead to well above-average returns but with heightened risks
- It can benefit investors sitting on uninvested cash and unsure about when to get back into stocks
Picking a volatile stock
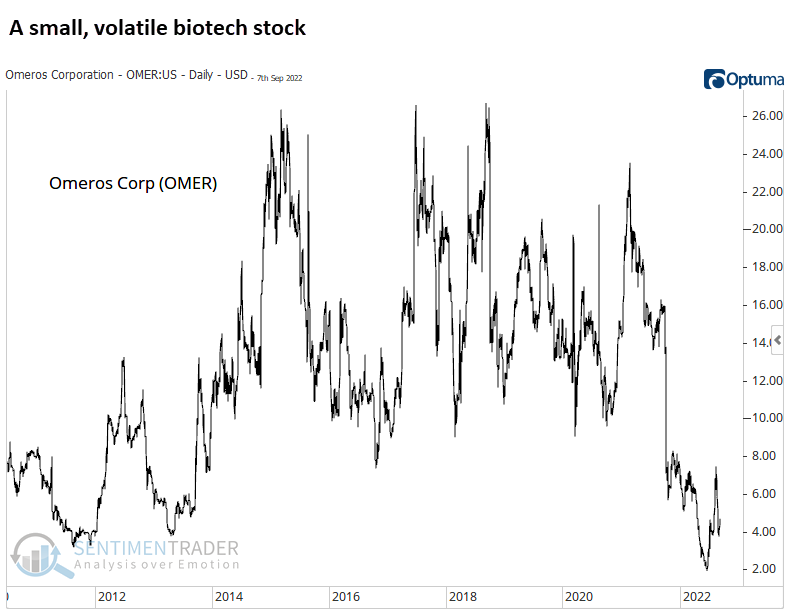
Omeros (OMER) is a small, volatile, risky biotech stock. For more information on this company and its stock, see this article (note that it is written from the author's point of view, including his own biases). The chart below displays a price chart for OMER over the past five years.
The stock traded in a wide range between $8 and $28 a share before collapsing to $1.85 and rebounding to $4.69. This is a volatile and unpredictable stock.
If we buy the stock today, what is the likelihood that we will garner a profit? Who knows?
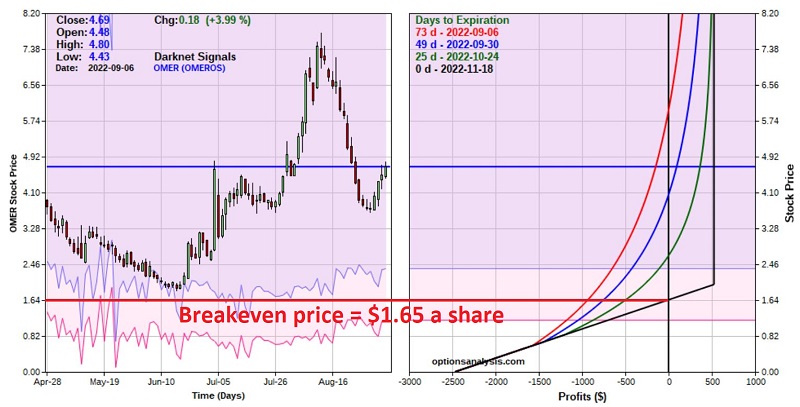
So, let's ask a different question: Will this stock stay above $1.65 between now and 2022-11-18? In other words, we will look at a trade that will show a profit as long as OMER does not decline over -62% in the next 78 calendar days. This offers a much higher probability of profit than simply buying shares of the stock.
However, it is critical to thoroughly understand the potential risks and rewards before utilizing this strategy.
Selling a naked put
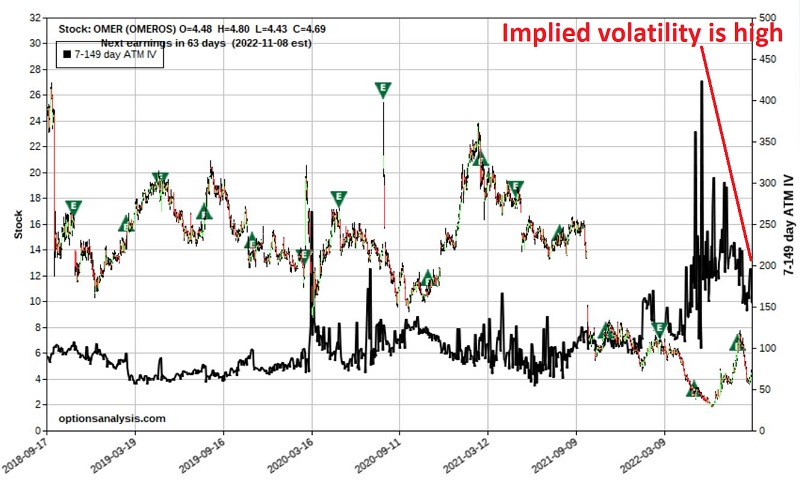
Selling options is best done when implied volatility is relatively high - which indicates an above-average amount of time premium built into the option prices for that stock. The chart below displays a bar chart for OMER with implied volatility overlaid (black line).
Our example trade uses the strategy known as selling a naked put, as follows:
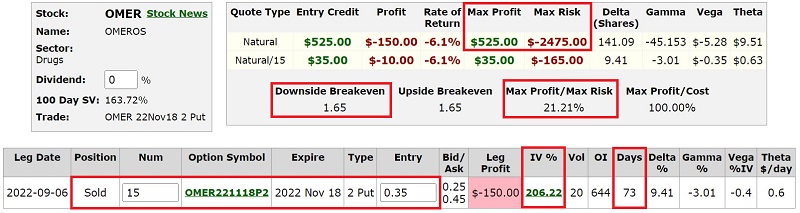
- Sell 15 OMER Nov18 2022 2 puts @ $0.35
The particulars for this position and the risk curves (i.e., the expected profit/loss as of a given date at a particular price for OMER shares) appear below.
There is a lot to digest here.
As we see in the figure above, the trading volume for this option on 2022-09-06 was "20." So, this is clearly a thinly traded option. Low trading volume typically results in a wide bid/ask spread, which is undoubtedly the case here.
The bid is $0.25, and the ask is $0.45. On a percentage basis, this is a huge spread and a deal-breaker for many traders. But we will push the edge of the envelope here a bit.
If I were to sell this option, I would likely enter a limit order to sell at $0.35 - the midpoint of the bid/ask spread. If not filled by the end of the day, I might consider canceling the limit order and entering a market order. For this example, we will assume a fill at the bid/ask midpoint of $0.35. At $0.35, the implied volatility is 206%, which, as we saw in an earlier chart, is at the high end of the historical range. When selling naked puts, the more premium you take in, the better.
A few things to note:
- Selling 15 puts @ $0.35 apiece means we generate a credit of $525 (the option buyer pays us $525, which is added to our trading account)
- As long as OMER stays above $2.00 a share until November options expiration, we will keep the entire $525
- To enter this trade, we need to have enough cash on hand to buy 1,500 shares of OMER stock at $2 a share, or $3,000
- However, the $525 we received in premium for selling the puts can count towards this amount, so we only need to put up $2,475
If OMER stays above $2 a share
If OMER stays above $2 a share through November expiration in 78 days, the $2 strike price put will expire worthless, and we will keep the $525 in premium. This would result in a return of 21.2%, calculated as follows:
- $525 premium received / $2,475 cash committed to secure the puts = 21.2%
A 21% return in 73 days isn't too shabby. The question, however, is how much risk are we taking to generate this return, and is it worth it?
If OMER drops below $2 a share
Suppose OMER trades below $2 a share. In that case, the puts will likely be exercised. At expiration, it happens automatically; before expiration, a put holder may choose to exercise early.
We will be required to buy 1,500 shares of OMER at $2 a share for $3,000. But remember, we took in $525 in premium selling the puts, so our effective cost per share is $1.65 a share ($2.00 - $0.35 = $1.65).
If the puts are exercised at $2 and we sell 1,500 shares at say $1.85, the loss on the stock trade would be -$300 (Buy 1,500 shares @ $2, sell 1,500 shares @ $1.80 = (-$0.20) x 1,500 = (-$300)). However, the overall trade would still show a profit, as follows:
- Premium received from selling puts = +$525
- Loss from buying shares @ $2 and selling shares @ $1.85 = -$300
- Net profit = $225, or +9.1% (i.e., $225 profit / $2,475 capital committed)
If we bought 1,500 shares at $2 and sold them at $1.65 instead of $1.85, then the $525 premium received is offset by the -$525 loss on the shares, and there is no profit or loss. If we sell the shares for less than $1.65 a share, we will incur a net loss on the trade. While anything can happen, it is fair to point out that the stock is presently trading at $4.69.
The worst-case scenario is that we purchase 1,500 shares of OMER at $2, the company subsequently goes bankrupt, and the price of the shares goes to $0. Under this scenario, we will lose -$2,475. How likely is that to happen? That's an assessment that each trader must make on their own.
A quick review
There is plenty of risk to go around with this position. First off, OMER is an extremely volatile stock with highly uncertain business prospects. Could OMER go bankrupt between now and November expiration? It appears highly unlikely but also not out of the realm of possibility. Could it gap below our breakeven price of $1.65 a share? Absolutely.
Still, if OMER does not fall more than -57% (from $4.69 to $2.00), this trade can earn a robust return of 21.2% in just 73 days. And even if it falls below $2 a share, our effective entry price for buying the shares is $1.65.
What the research tells us…
Is selling thinly traded put options on highly speculative stocks a good idea? At first blush, it is undoubtedly an easy strategy for many individuals to bypass. But before dismissing it out of hand, remember the adage, "Opportunity is where you find it." Very often, some of the best opportunities can be found where no one is looking. The key to selling naked puts as a profit-generating strategy is to honestly assess the potential reward versus the potential risk on every trade.