
A Confluence of Indicators Puts Gold at a Critical Juncture

Key points:
- Internal strength indicators from gold miners (GDX), such as the "% in Correction" and breadth metrics, have reached historic extremes. Historically, these signals often precede weakness in gold.
- Contrary to the weak outlook for gold, this extreme signal from the miners has historically been a clear sign of a strengthening U.S. Dollar and has implied a rise in market risk appetite.
- The current market presents a contradiction: gold's own "Risk Level" indicator is in a zone of extreme optimism. In a few rare historical cases, this has preceded a bull market, warranting close observation of the price action in the coming weeks.
Extreme Strength in Gold Miners: A Warning for Gold?
Recently, the gold miners (GDX) sector has displayed considerable internal strength, with two key indicators reaching historic extremes. It is worth taking a deeper look at their potential impact on gold's future trajectory.
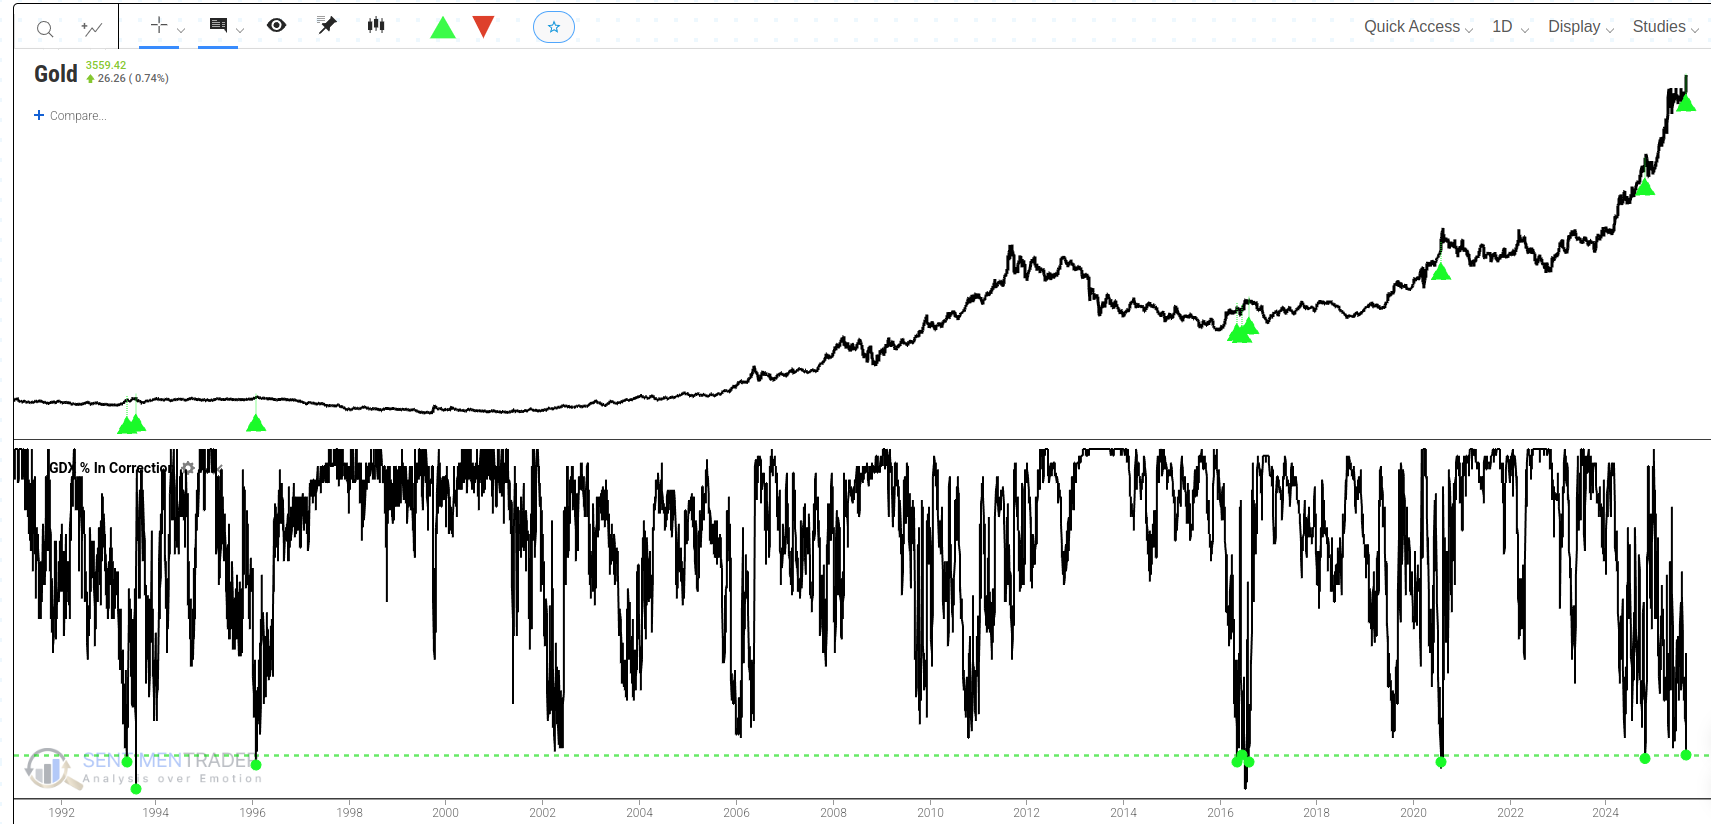
First, the "GDX % in Correction" indicator has fallen to a historic low of 10. This metric measures the percentage of GDX component stocks that have fallen more than 10% from their 52-week highs. The current extremely low reading means that almost all gold mining companies are at or very near their yearly highs, reflecting an exceptionally broad and consistent rally.
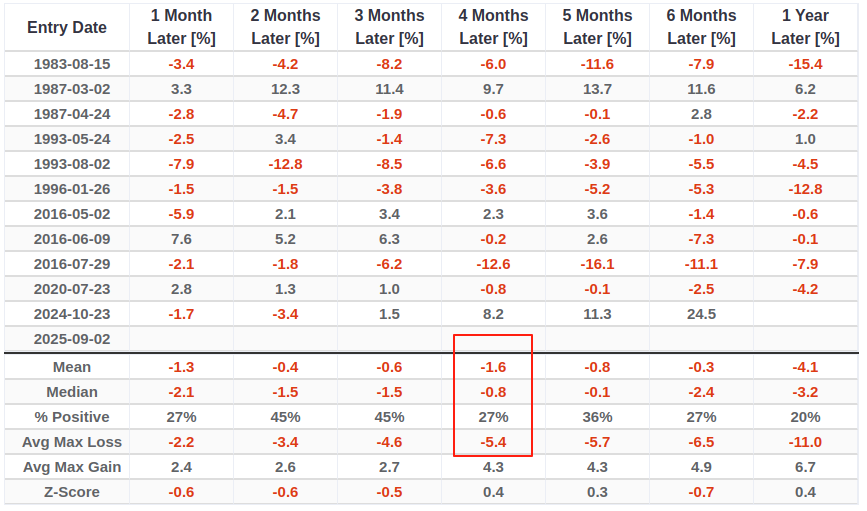
However, this extreme strength has historically served as a contrarian indicator for gold's future performance. Backtests show that after this indicator drops to such a low level, gold's performance over multiple future timeframes is quite weak. Specifically, over the next four months, both the average and median returns for gold are negative, and the win rate (% Positive) is as low as 27%. Related Backtest Click Here.
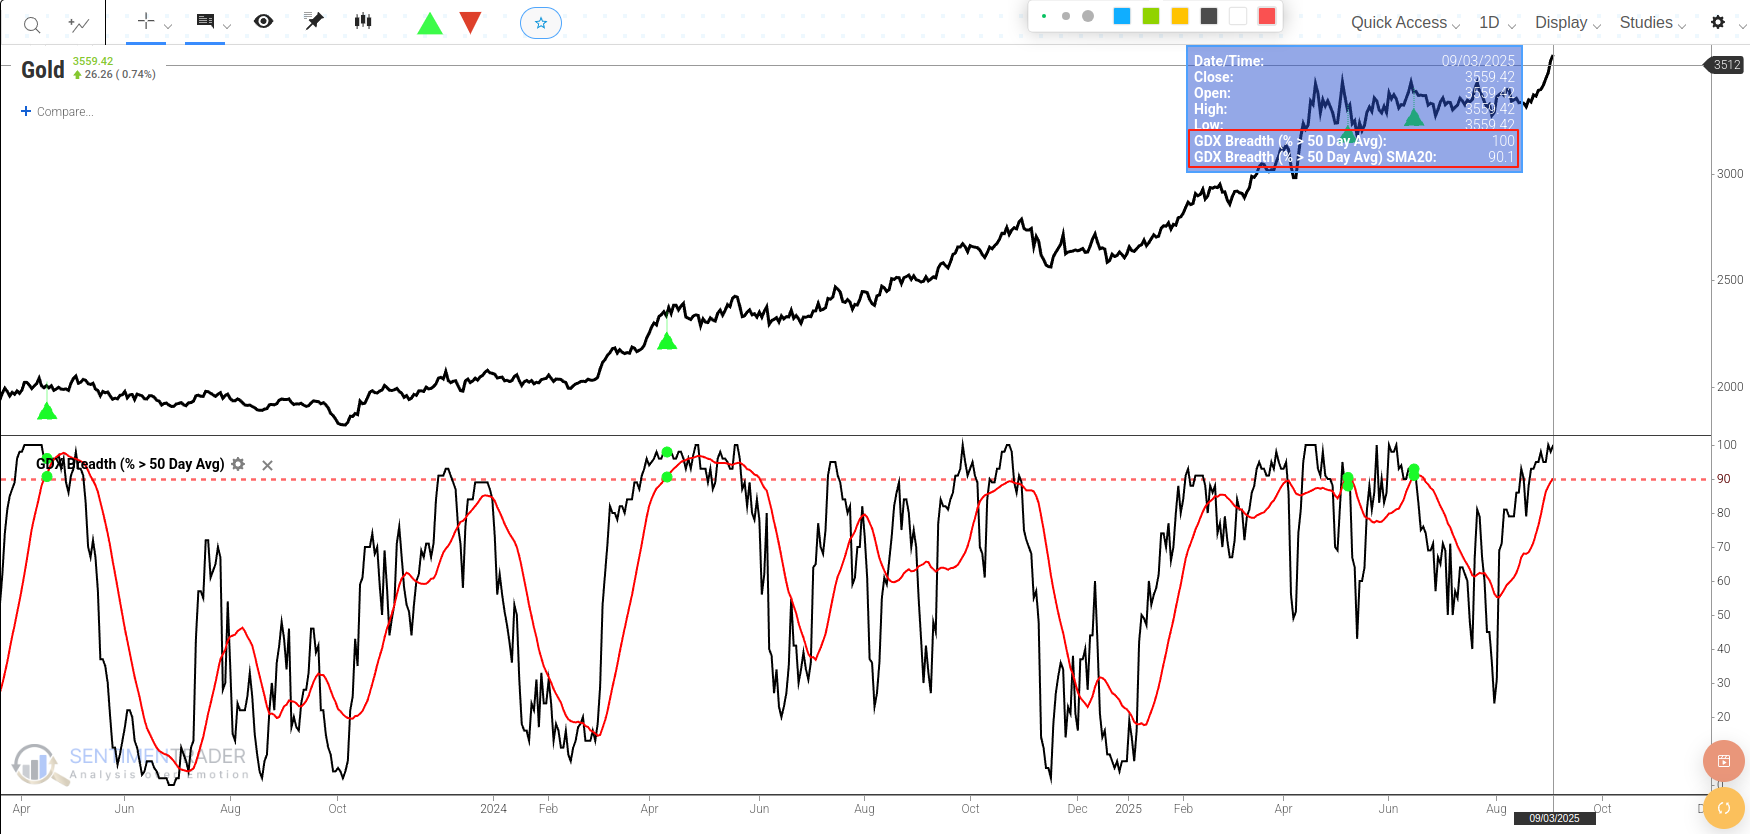
Second, the "GDX Breadth (% > 50 Day Avg)" has also reached a peak of 100%. This means that the price of every GDX component stock is currently above its 50-day moving average, once again confirming the overwhelming power of the current rally. This is an indisputable signal of short-term strength.
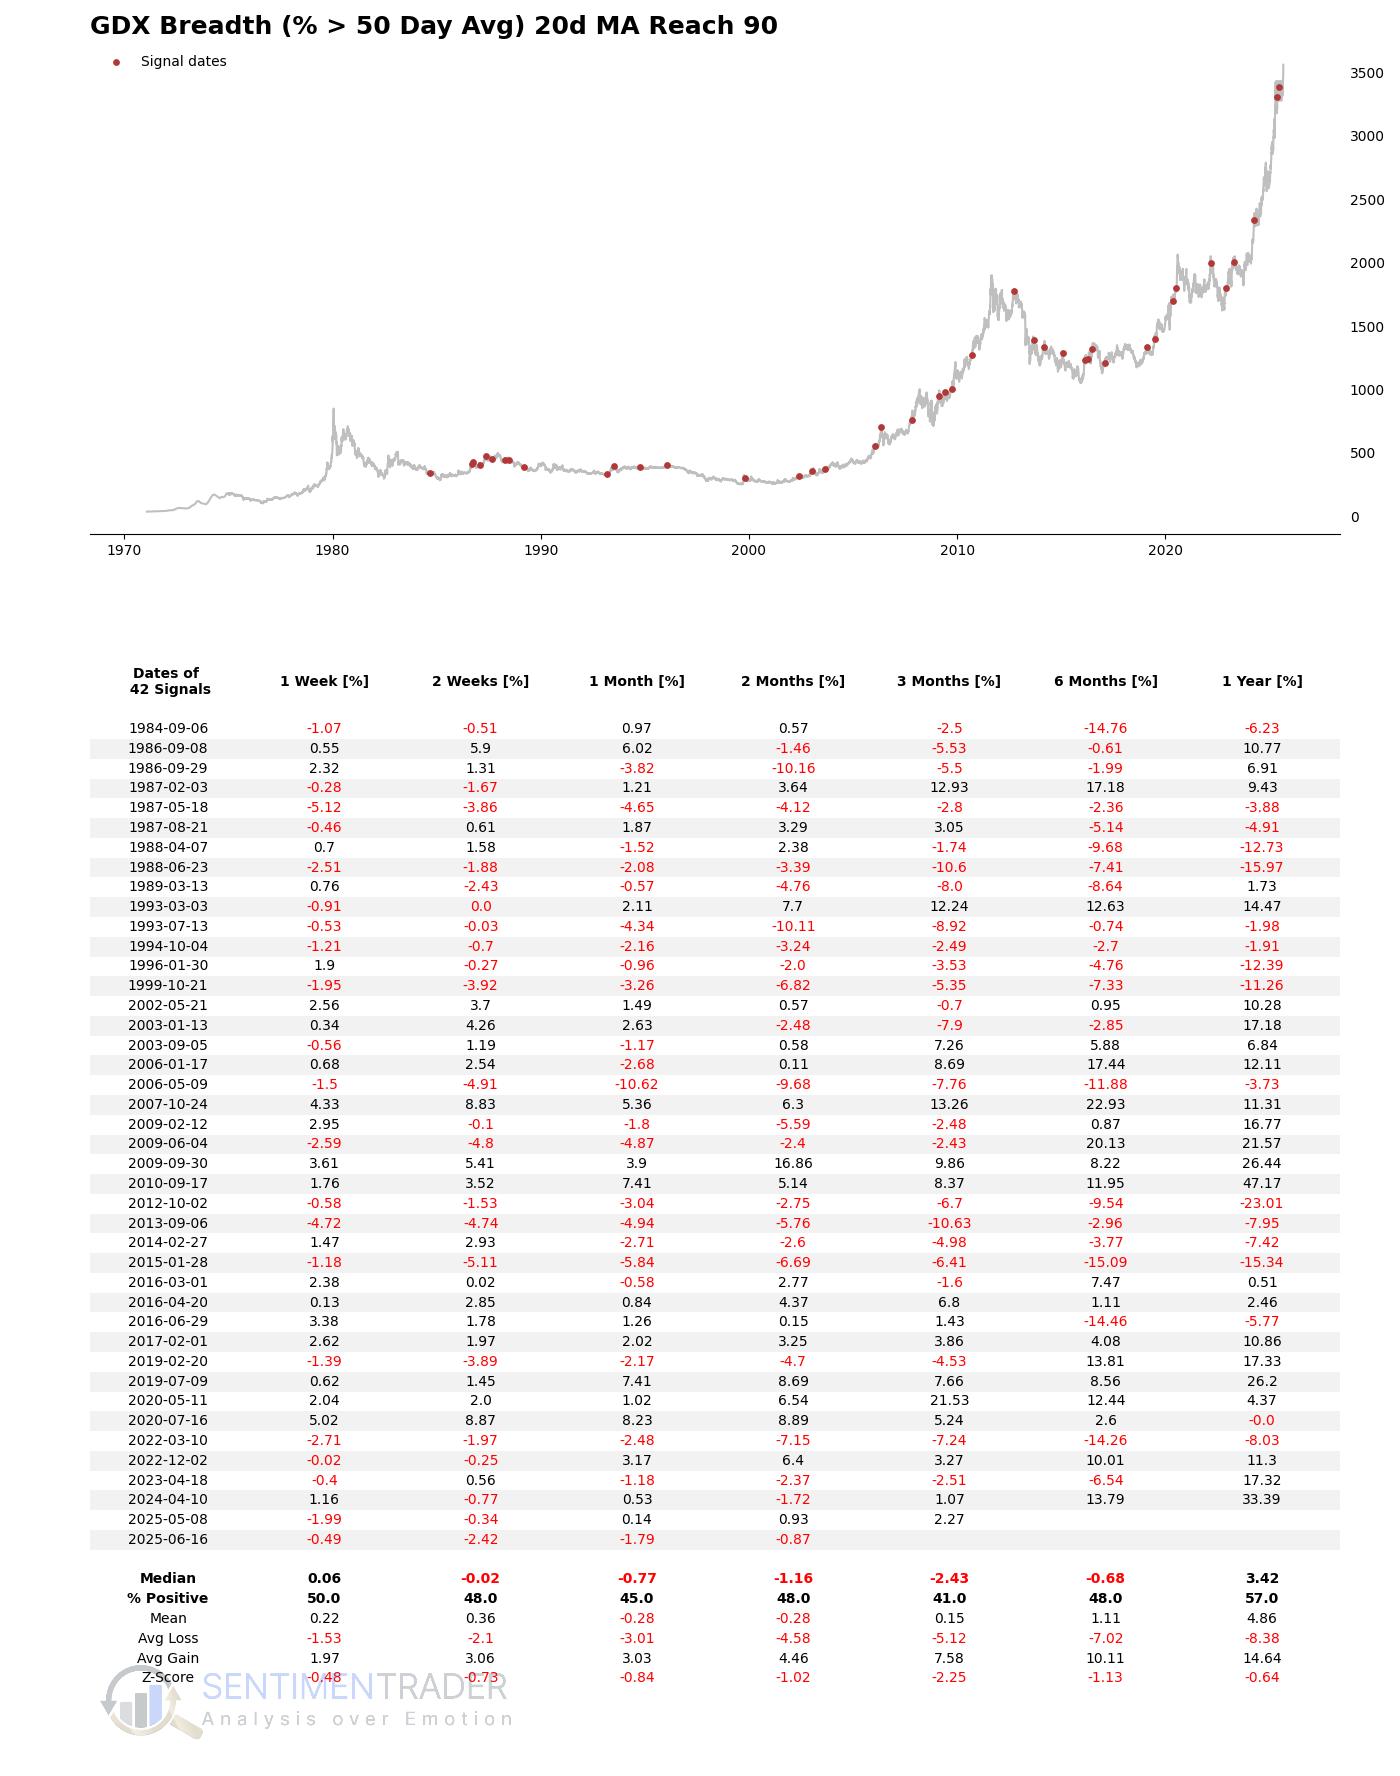
But, similar to the % in Correction indicator, gold's outlook is also not optimistic when this extreme breadth occurs. Historical data shows that in the three months following the signal, the median return for gold is negative. This reinforces the idea that when the gold mining sector-often a leading indicator for gold-experiences collective short-term overheating, gold itself often needs time to digest this sentiment and may subsequently enter a phase of consolidation or a pullback. Related Backtest Click here.
An Intuitive Read on Sentiment Indicators
We also need to listen to the direct "statements" from market sentiment. Currently, both gold's own sentiment indicators and related fund flows are expressing a nearly unanimous view: market optimism has reached an extremely high level.
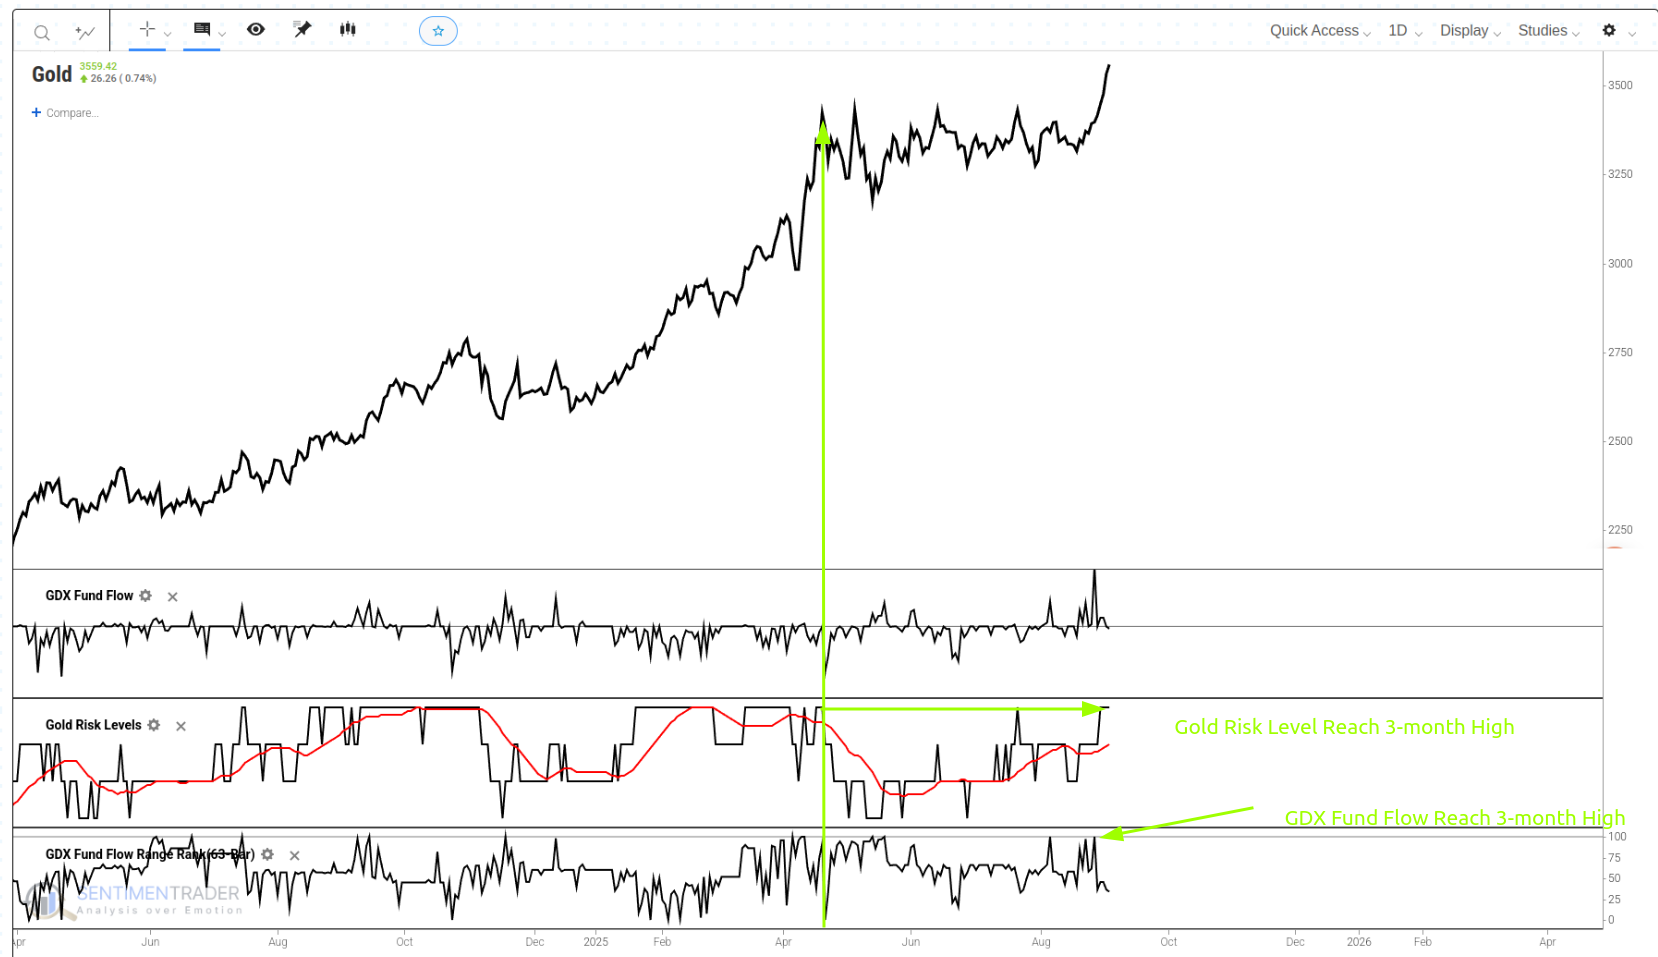
First, the "Gold Risk Levels" indicator is a direct quantification of market sentiment. Recently, not only has its daily reading hit "8," representing extreme optimism, but its 20-day moving average has also touched the key threshold of "7." When this indicator is at such a high level, it suggests that the market broadly expects prices to continue rising, while fears of a potential pullback have significantly diminished. This high degree of consensus in sentiment, especially as gold hits new all-time highs, constitutes a risk in itself.
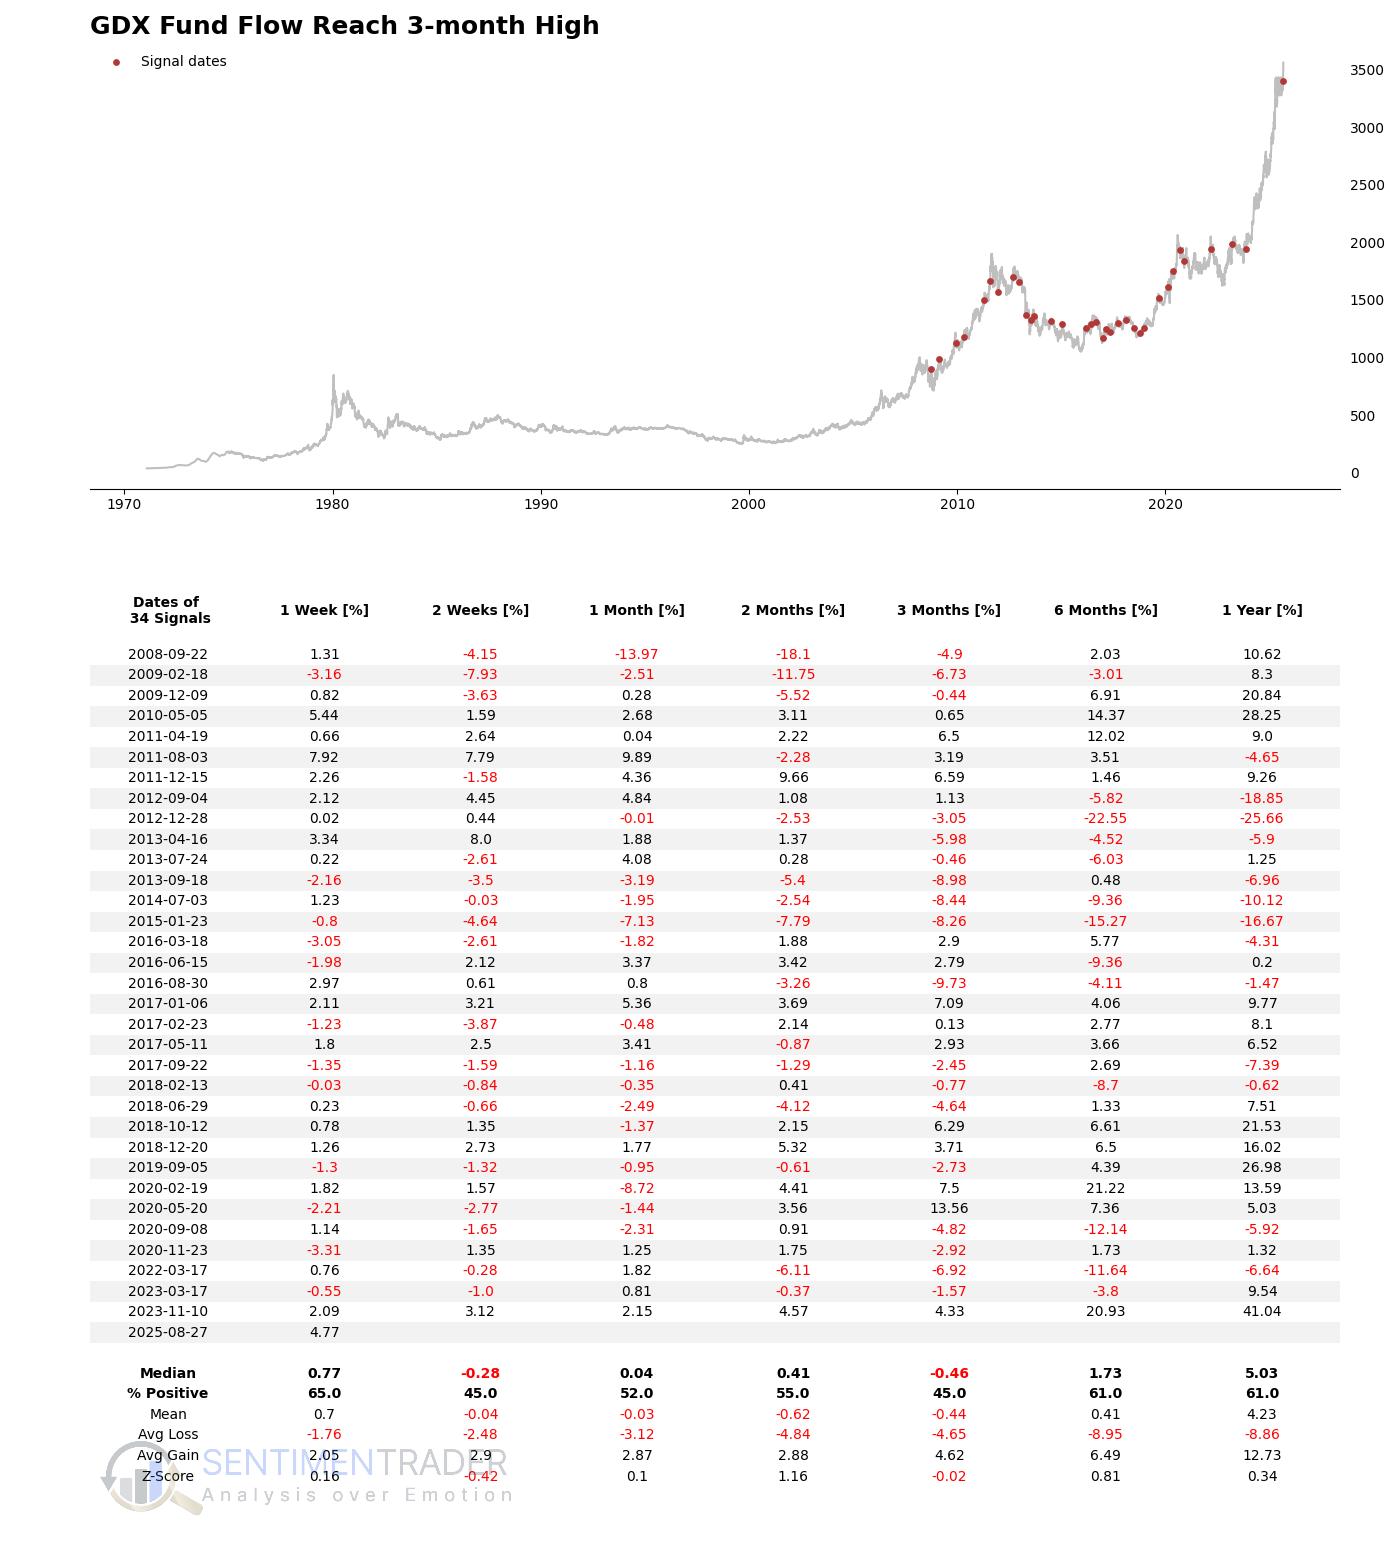
Second, the "GDX Fund Flow" indicator recently hit a 3-month high, which is a direct reflection of market behavior. When a sector's price action is strong, a large influx of capital is common, including many momentum-driven investors and those with a fear of missing out (FOMO). This serves as a contrarian warning: market sentiment may have become overextended, thereby increasing the price's sensitivity to any negative catalysts and raising the risk of a pullback. Related Backtest Click here.
Potential Tailwinds for the Dollar and Other Market Implications
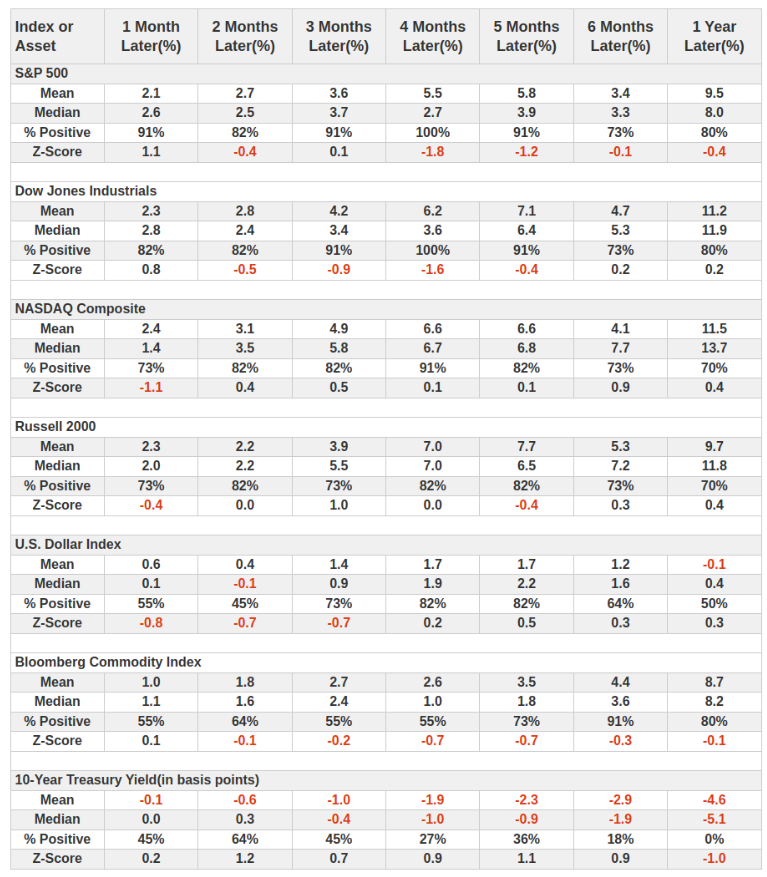
The significance of the extreme strength signal from the gold miners sector extends far beyond gold itself. When we conduct a cross-market analysis of historical instances where the "GDX % in Correction" indicator reached a low, a clear "Risk-On" picture emerges. Related Backtest Click here.
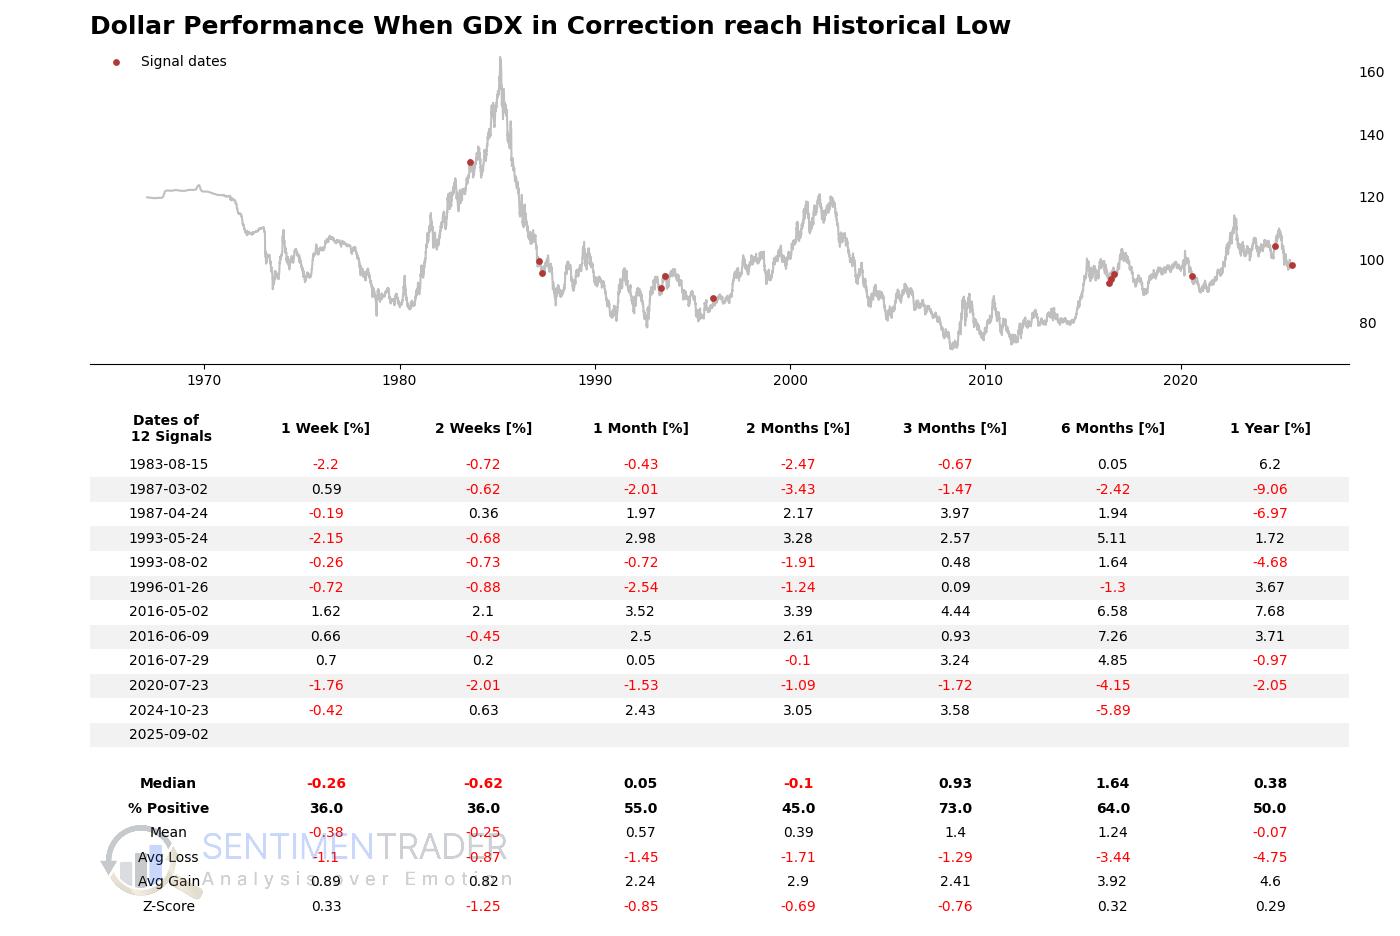
This signal is a positive omen for the U.S. Dollar. The data shows that after the signal is triggered, the U.S. Dollar Index performs particularly well in the 3- to 6-month window, with its win rate (% Positive) climbing into the 70%-80% range. This stands in stark contrast to gold's weak performance and aligns with the often-negative correlation between the dollar and gold over the medium term.
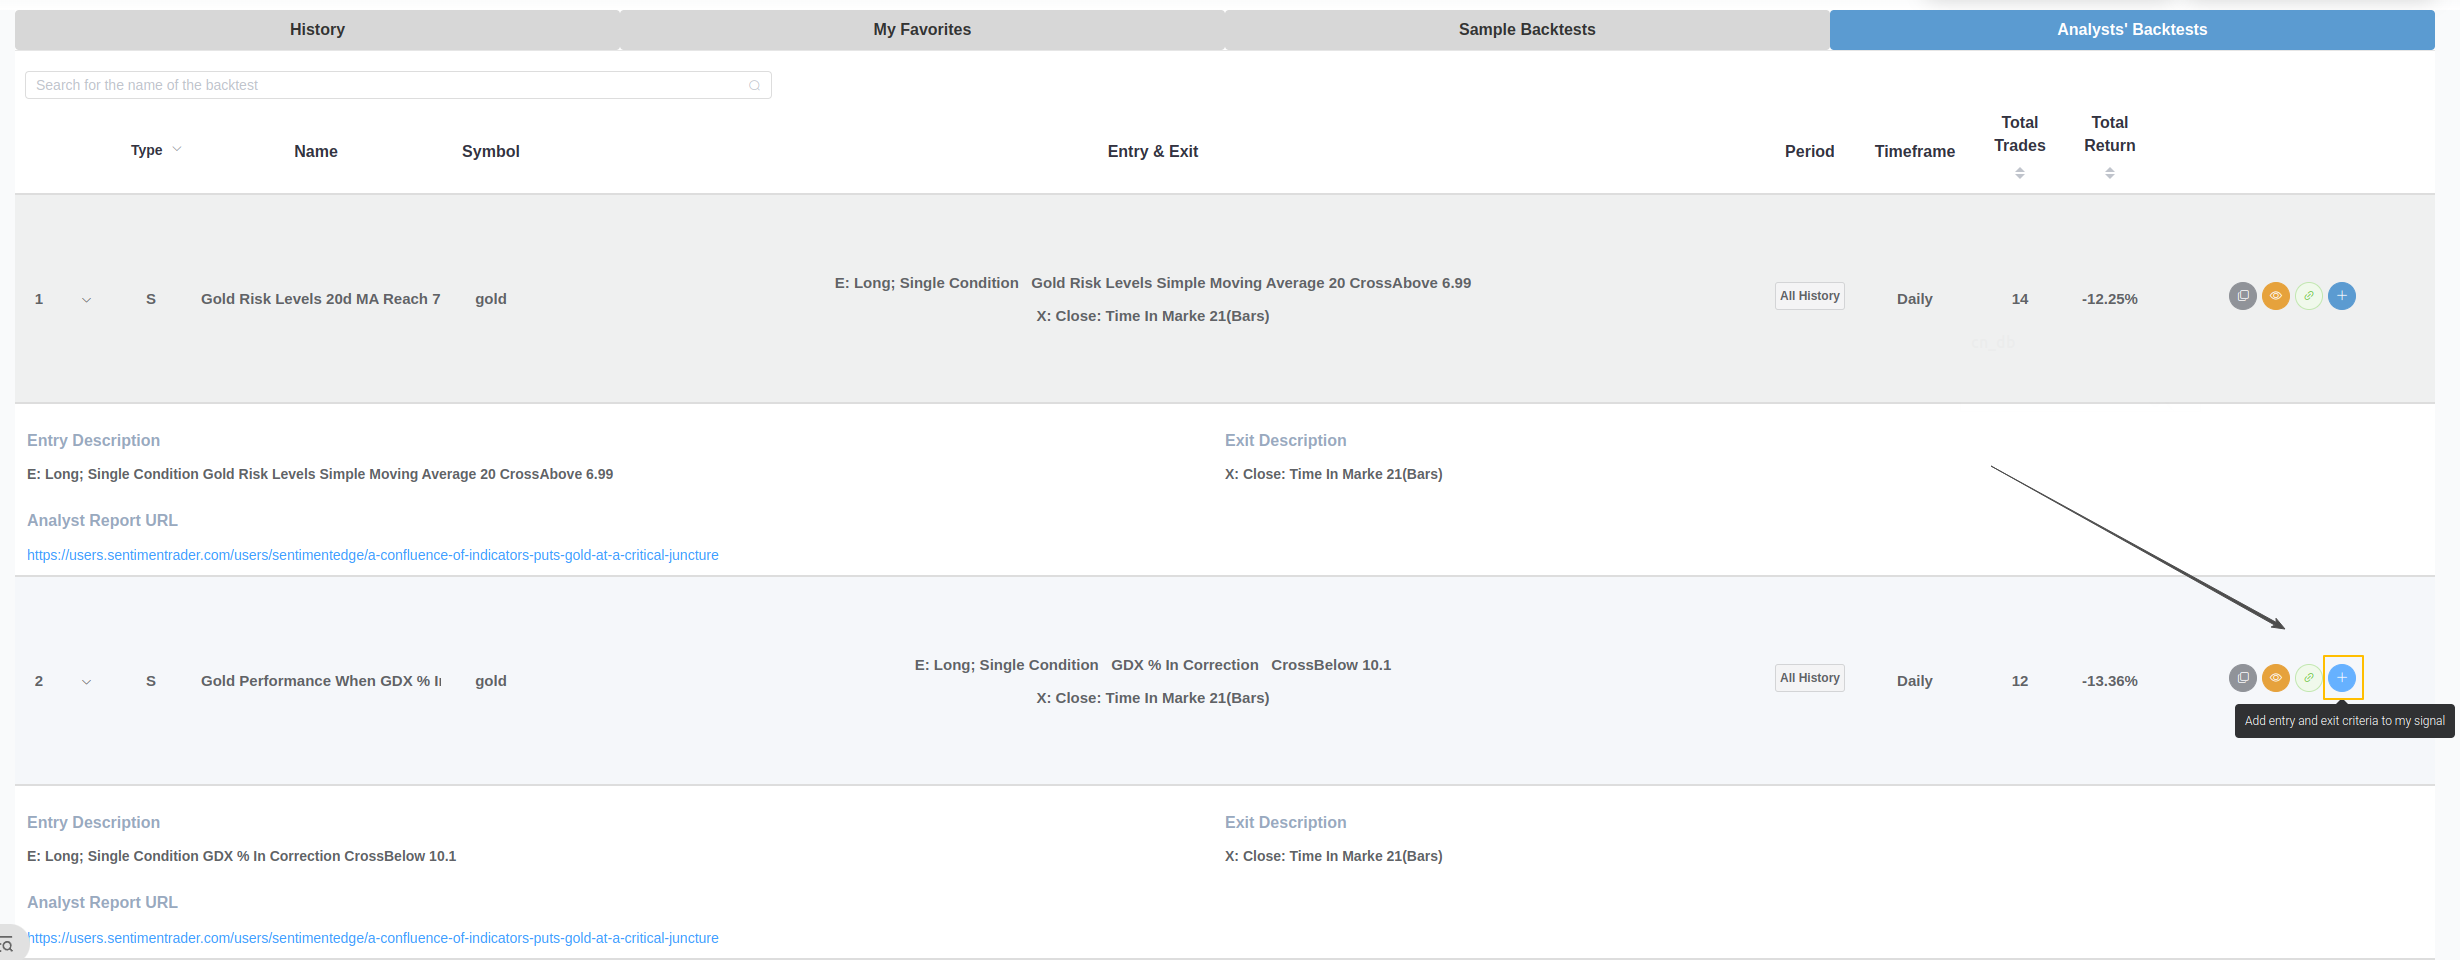
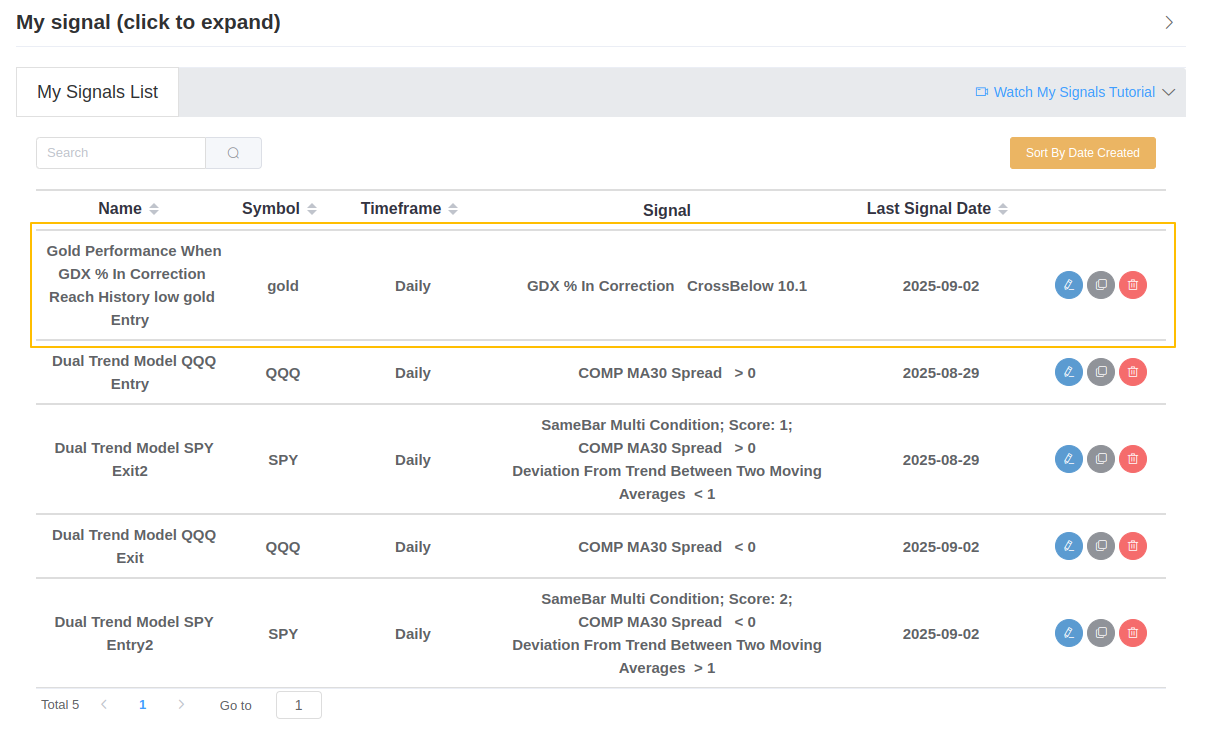
If you don't want to miss the signal's occurrence, add this signal alert to My Signals. The Analysts' Backtest interface now features a button to add entry and exit criteria to My Signal, enabling users to incorporate them into their My Signal list.
What Our Research Tells Us...
Currently, the gold and gold miners market is at a critical juncture defined by both extreme technical strength and extreme optimism. From the historical data, we can draw one primary conclusion and one important point of observation.
The primary conclusion is that the internal strength signals from the gold miners sector (especially the "% in Correction" indicator) constitute a stern bearish warning for gold's future trajectory. However, this signal does not exist in a vacuum. It reveals a broader macroeconomic backdrop-a "risk-on" environment that is favorable to the U.S. Dollar and other risk assets. This provides a rational economic logic for why gold may come under pressure in the future.
The important point of observation lies with gold's own sentiment indicators. As shown in a few rare historical exceptions, if investors ignore these warning signs and continue to push gold prices higher, the market dynamics might change. Therefore, whether gold's price can hold firm at its current highs in the coming weeks will be key to validating whether the historical pattern will repeat, or if we will witness another "exception" being born. For traders, the weight of the current signals clearly leans toward being bearish on gold and favoring a market environment of returning risk appetite. Nevertheless, keeping a close watch on gold's price action remains the prudent course of action.