
A composite trend model buy signal for the S&P 500

Key points:
- A composite that contains ten trend-following indicators cycled from a bearish to a bullish condition
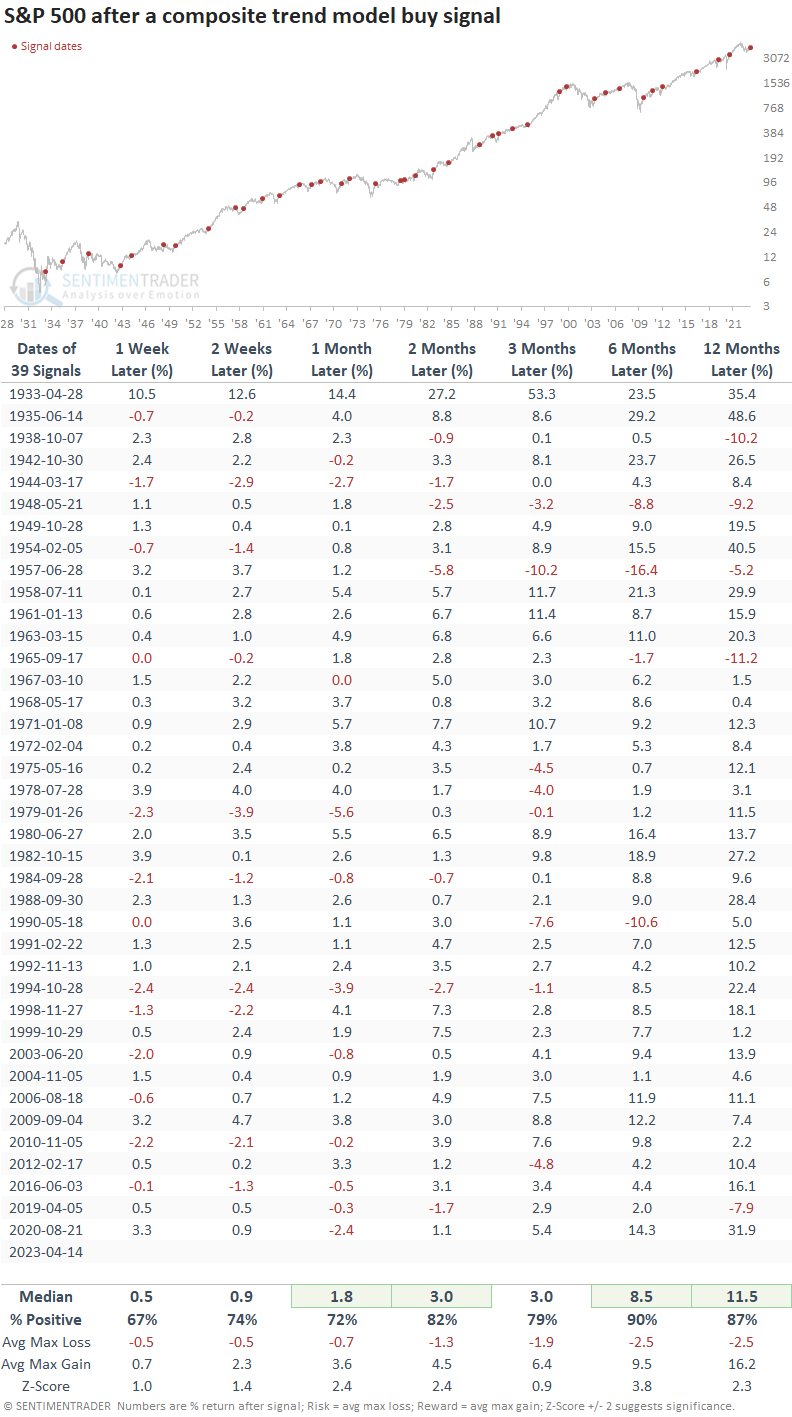
- Similar trend change signals over the past 90 years preceded excellent returns for the S&P 500
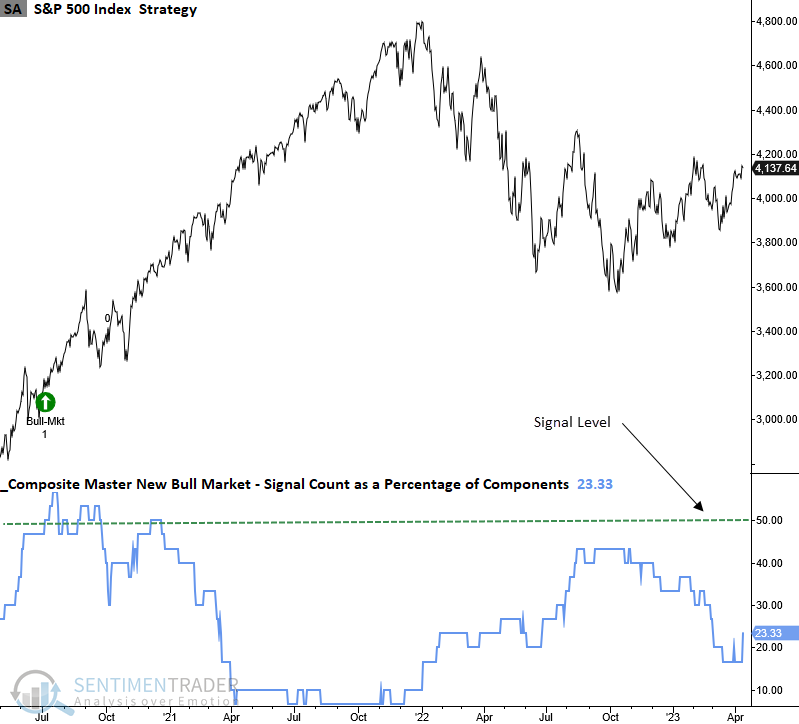
- The Composite Master New Bull Market score increased to 23% with the new trend change signal
More and more price-based indicators for the S&P 500 are pointing toward an uptrend
Over the last 6-9 months, we've shared several breadth-based thrust and recovery signals, which measure the internal condition of an index or exchange over various time frames. Typically, the burst of momentum or improvement in stock trends within the index foreshadows a potential bearish-to-bullish trend change for the index.
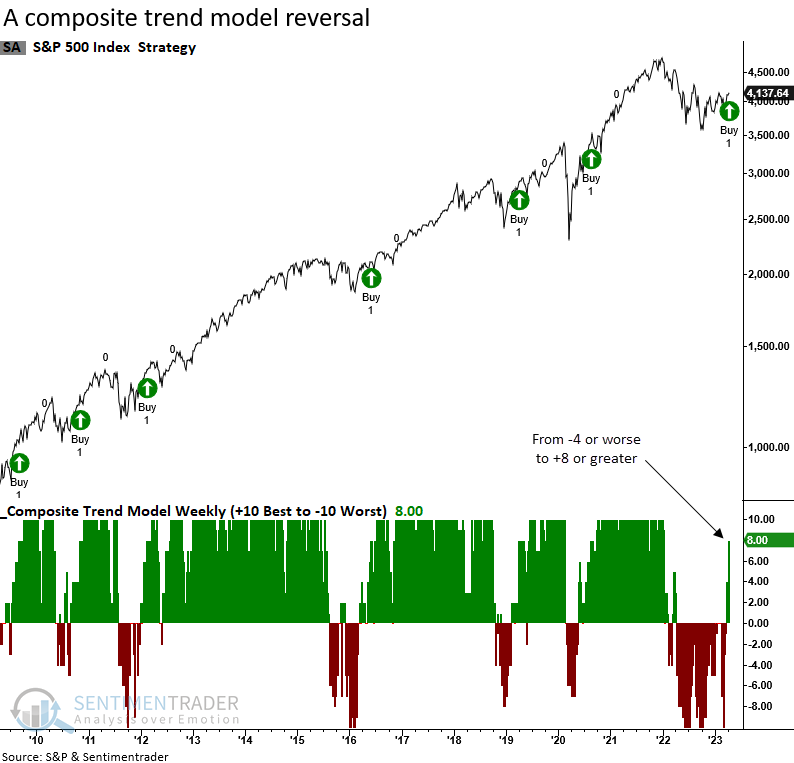
Last week, a composite trend model for the S&P 500 increased to a bullish score of +8, triggering a trend change buy signal for the world's most-watched index.
So, external price conditions are now confirming the bullish internal breadth-based conditions.
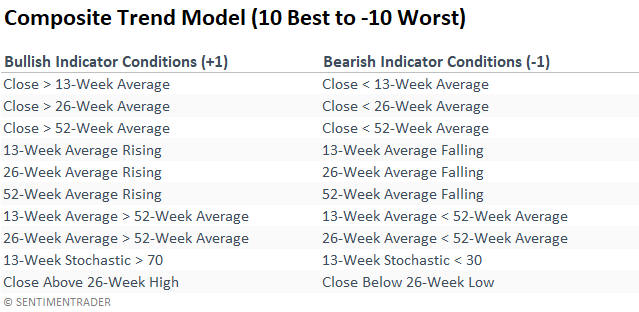
How I construct the weekly composite trend model
The composite assigns an individual score of +1 or -1 to each component in the model based on the following conditions.
Similar trend change signals preceded excellent results
When the composite trend model cycles from -4 or worse to +8 or better, the S&P 500 rose 90% of the time over the next six months. Results a year later were also excellent and recorded 24 consecutive profitable signals between 1967 and 2016.
The number of 10%+ drawdowns over the next six and twelve months was minimal, with only three and seven precedents.
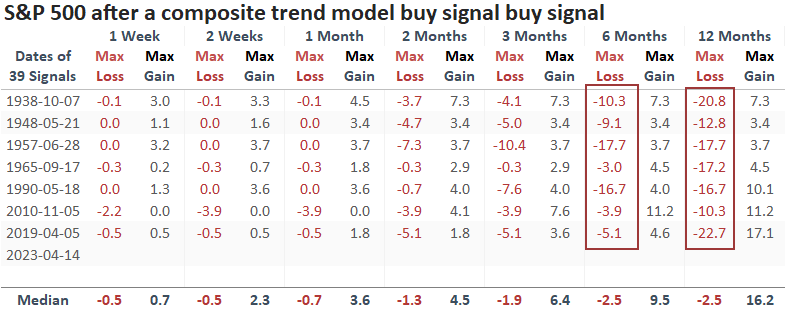
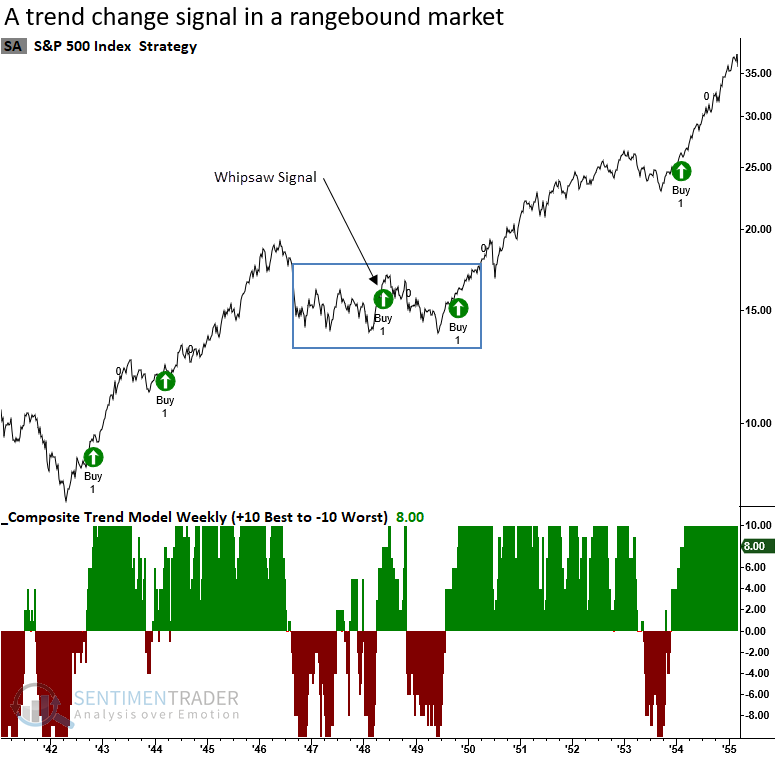
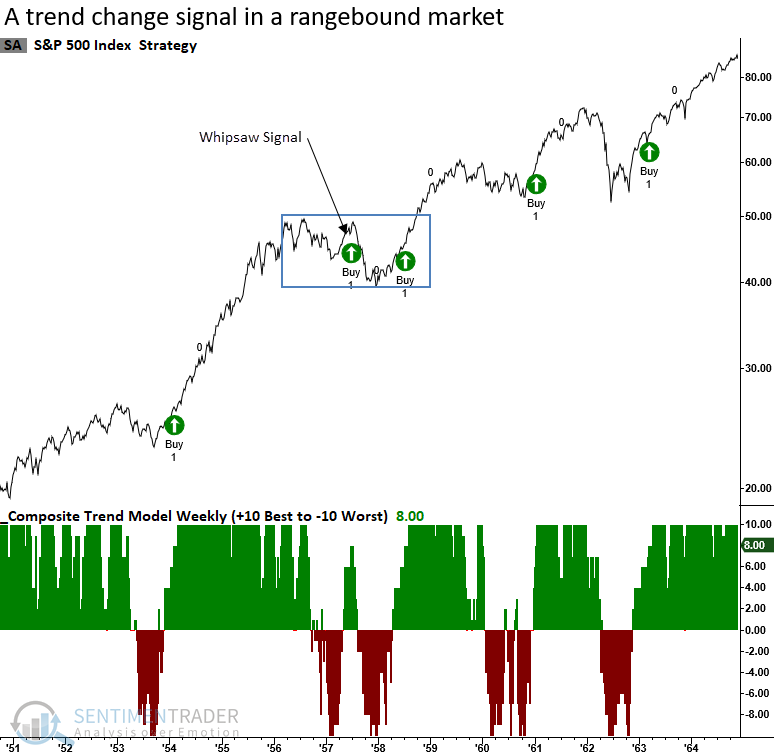
Whipsaw signals tend to occur in broad trading ranges
The 1948 and 1957 signals are worth highlighting, as they both triggered within the context of rangebound markets, like now. The likelihood of a whipsaw alert increases in a trading range as lagging indicators like moving averages catch down to the index price level, creating what looks like a bullish setup.
The 1946-49 bear market is a historical period I've mentioned in other research notes as a potential analog to the current environment should a whipsaw occur.
The 1956-57 bear market, while mild in terms of the overall drawdown, saw the S&P 500 move sideways for more than two years.
Composite Master New Bull Market
A composite model that combines the TCTM Composite Thrust and Confirmation Model components and ten other systems ticked up with the trend change alert but remained well below the threshold level for an overall composite signal.
What the research tells us...
A composite trend model for the S&P 500 reversed from a bearish to a bullish trend score, triggering a buy signal for a member of a broader composite that measures price, volume, breadth, and macroeconomic data. After similar composite trend change signals, the S&P 500 rose 90% of the time over the next six months. If a whipsaw signal were to occur, the S&P 500 would most likely fall back into the trading range similar to the 1948 and 1957 alerts.