Products
SentimenTrader Trading Tools
‍
Backtest Engine
My Trading Toolkit
Correlation Analysis
Seasonality
Market Prediction
Indicators & Data API
‍
Proprietary Indicators & Charts
Market Data API
Strategies & Scanner
‍
50+ Trading Strategies
Smart Stock Scanner
Smart Option Scanner
Research Reports
‍
Research Solutions
Reports Library
Free Resources
Simple Backtest Calculator
Simple Seasonality Calculator
The Kelly Criterion Calculator
Sentiment Geo Map
Public Research Reports
Education
Sentiment Indicators
Technical Indicators
Pricing
Company
About
In the News
Testimonials
Client Success Stories
Contact
Log inLoginSign up
< BACK TO ALL REPORTS

A Composite Risk Warning Model member triggered an alert

Dean Christians
2024-06-17
More NYSE stocks are registering 52-week lows compared to highs, even as the S&P 500 hovers near its highest point in a year. Similar market breadth environments typically yielded an adverse multi-month outlook for the S&P 500.

Key points:

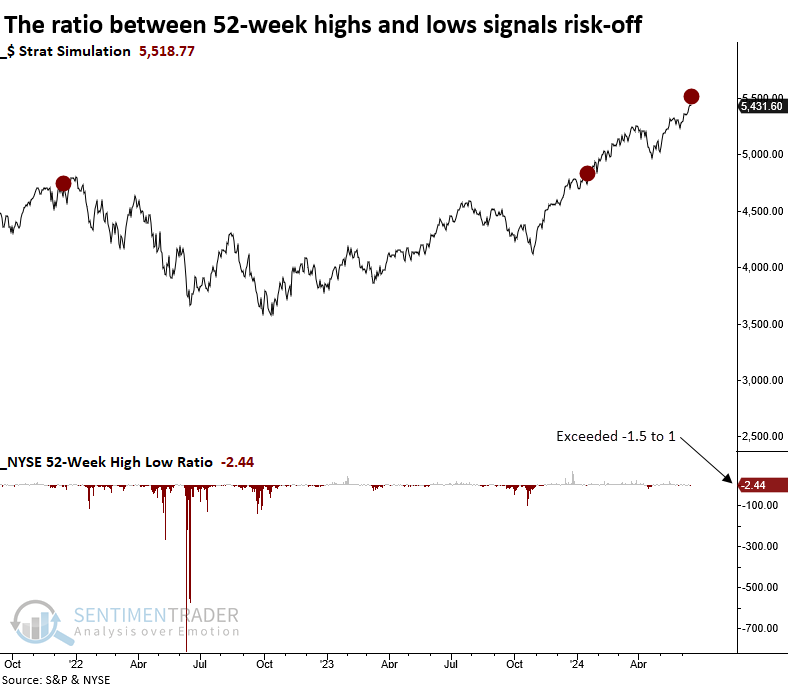
  • The ratio between 52-week highs and lows on the NYSE exceeded -1.5 to 1, two sessions or fewer from a high 
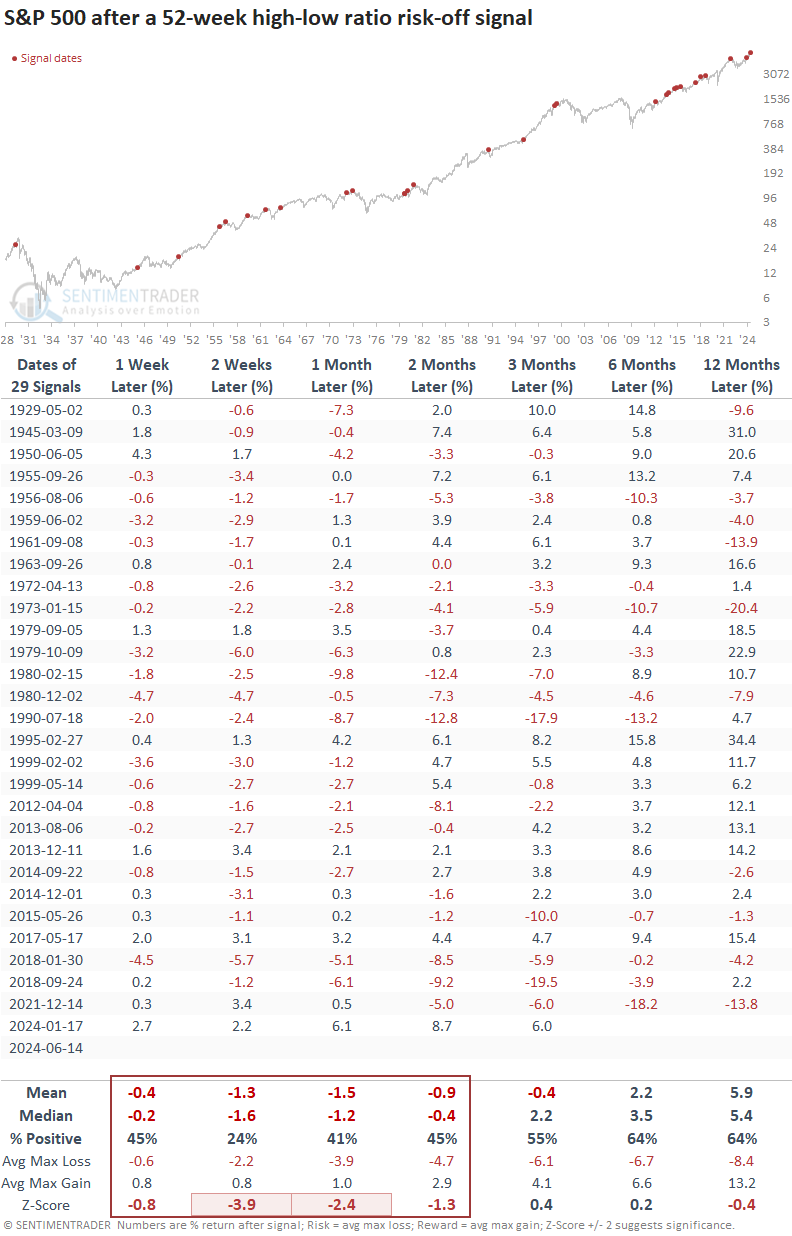
  • Similar skews in highs versus lows preceded negative returns for the S&P 500 over the subsequent two months
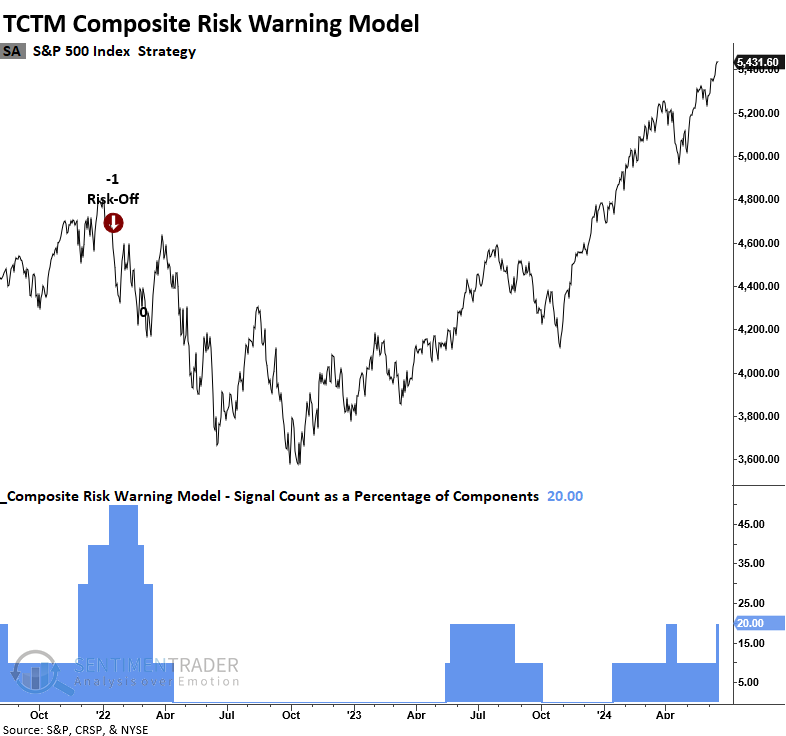
  • The TCTM Composite Risk Warning Model signal count increased to 20%

NYSE 52-week lows exceeded highs, with the S&P 500 near an annual high

A model that monitors NYSE 52-week highs relative to lows exceeded a ratio of -1.5 to 1, with the S&P 500 two days or fewer from an annual high, triggering a risk-off signal from a member in the TCTM Composite Risk Warning Model. 

The previous alert, which occurred in January 2024, was a standalone event, highlighting why no indicator or model should ever be used in isolation. A weight-of-the-evidence approach is always preferable.

Comparable skews in 52-week highs versus lows preceded negative returns

Should the NYSE 52-week high-to-low ratio exceed -1.5 to 1 in two days or fewer of the S&P 500 reaching an annual high, the world's most benchmarked index has historically shown negative returns and unfavorable win rates over the next two months. The first two weeks exhibited the highest risk, with the index declining 76% of the time.

While longer-term horizons were favorable, the results were uninspiring relative to history.

The weight of the evidence has not overwhelmingly turned unfavorable

The Composite Risk Warning Model requires a minimum composite signal count of 50% to activate an alert, a threshold that has yet to be achieved. 

What the research tells us...

Over the last few weeks, our research has highlighted an increasing number of stock participation problems across different indexes and exchanges. Until now, most warnings have been mainly from short-to medium-term indicators. However, a new alert from a TCTM Composite Risk Warning Model member, which compares 52-week highs to lows, suggests risks are rising. Similar alerts tended to result in an unfavorable outlook for the S&P 500 over the subsequent two months. Should the list of items on the bearish side of the ledger expand further, investors would be wise to heed the market's message.

PRODUCTS
SentimenTrader
Trading Tools
Indicators & Data API
‍
Strategies & Scanner
‍
Research Reports
FREE
RESOUrCES
Simple Backtest
Calculator
Simple Seasonality
Calculator
The Kelly Criterion
Calculator
Sentiment Geo Map
‍
Public Research Reports
‍
Education
Sentiment Indicators
‍
Technical Indicators
‍
Pricing
Bundle pricing
‍
FAQ
‍
Announcements
‍
COMPANY
‍
About
‍
In the News
‍
Testimonials
‍
Client Success Stories
CONTACT
‍
General Inquiries
‍
Media Inquiries
‍
Financial Professionals Inquiries
‍
© 2026 Sundial Capital Research Inc. All rights reserved.
Setsail Marketing
TermsPrivacyAffiliate Program
Risk Disclosure: The information and tools provided are for research and analytical purposes only and are not intended as investment advice. Market analysis involves uncertainty, and outcomes may differ from expectations. Users should conduct their own due diligence and consider their individual circumstances before making any financial decisions. Past performance is not necessarily indicative of future results.

Hypothetical Performance Disclosure: Hypothetical performance results have many inherent limitations, some of which are described below. No representation is being made that any account will or is likely to achieve profits or losses similar to those shown; in fact, there are frequently sharp differences between hypothetical performance results and the actual results subsequently achieved by any particular trading program. One of the limitations of hypothetical performance results is that they are generally prepared with the benefit of hindsight. In addition, hypothetical trading does not involve financial risk, and no hypothetical trading record can completely account for the impact of financial risk of actual trading. for example, the ability to withstand losses or to adhere to a particular trading program in spite of trading losses are material points which can also adversely affect actual trading results. There are numerous other factors related to the markets in general or to the implementation of any specific trading program which cannot be fully accounted for in the preparation of hypothetical performance results and all which can adversely affect trading results.

Testimonial Disclosure: Testimonials appearing on this website may not be representative of other clients or customers and is not a guarantee of future performance or success.