
A composite breadth model triggered a new buy signal for stocks

Key points:
- A breadth composite that identifies an oversold condition increased to a bullish level
- The composite has subsequently reversed, triggering a buy signal for stocks
- After similar alerts, the S&P 500 shows uninspiring near term results and a more favorable medium-term outlook
- If I isolated instances when the S&P 500 was down 20% or less, returns would look better on a medium-term basis
A trading model that identifies a reversal from an oversold condition
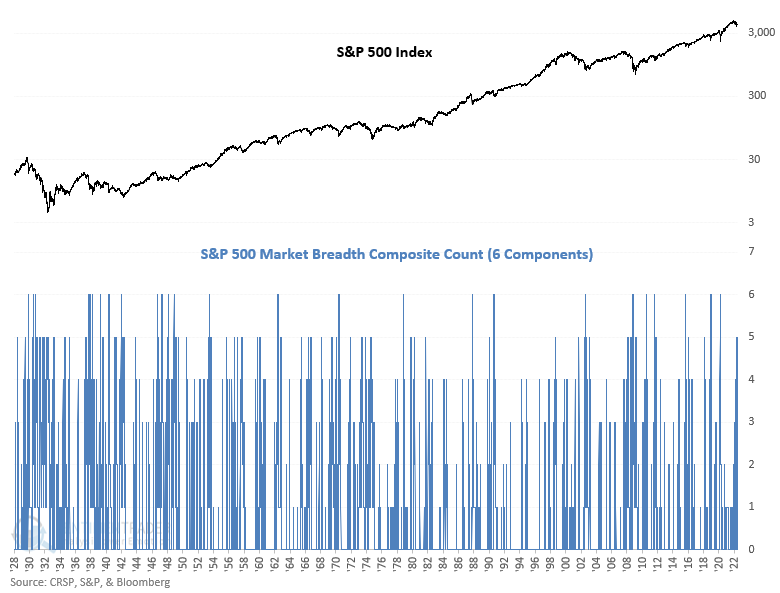
The trading model uses a market breadth composite comprised of 6 components. The constituents identify an oversold condition when each indicator value achieves its respective threshold level in a trailing 5-day lookback period. Once the composite count increases to 5 or more, a new buy signal triggers when the composite reverses to 2 or less, and S&P 500 momentum turns positive within 5 days of the cross.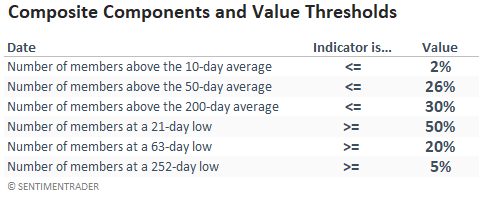
The composite breadth count increased to 5 on 5/12/22, which happens to be the highest level since the pandemic crash. However, I'm not a fan of catching a falling knife. So, the trading model did not trigger until last week when the composite reversed lower, and index momentum turned positive.
Similar signals suggest the market be choppy in the near-term
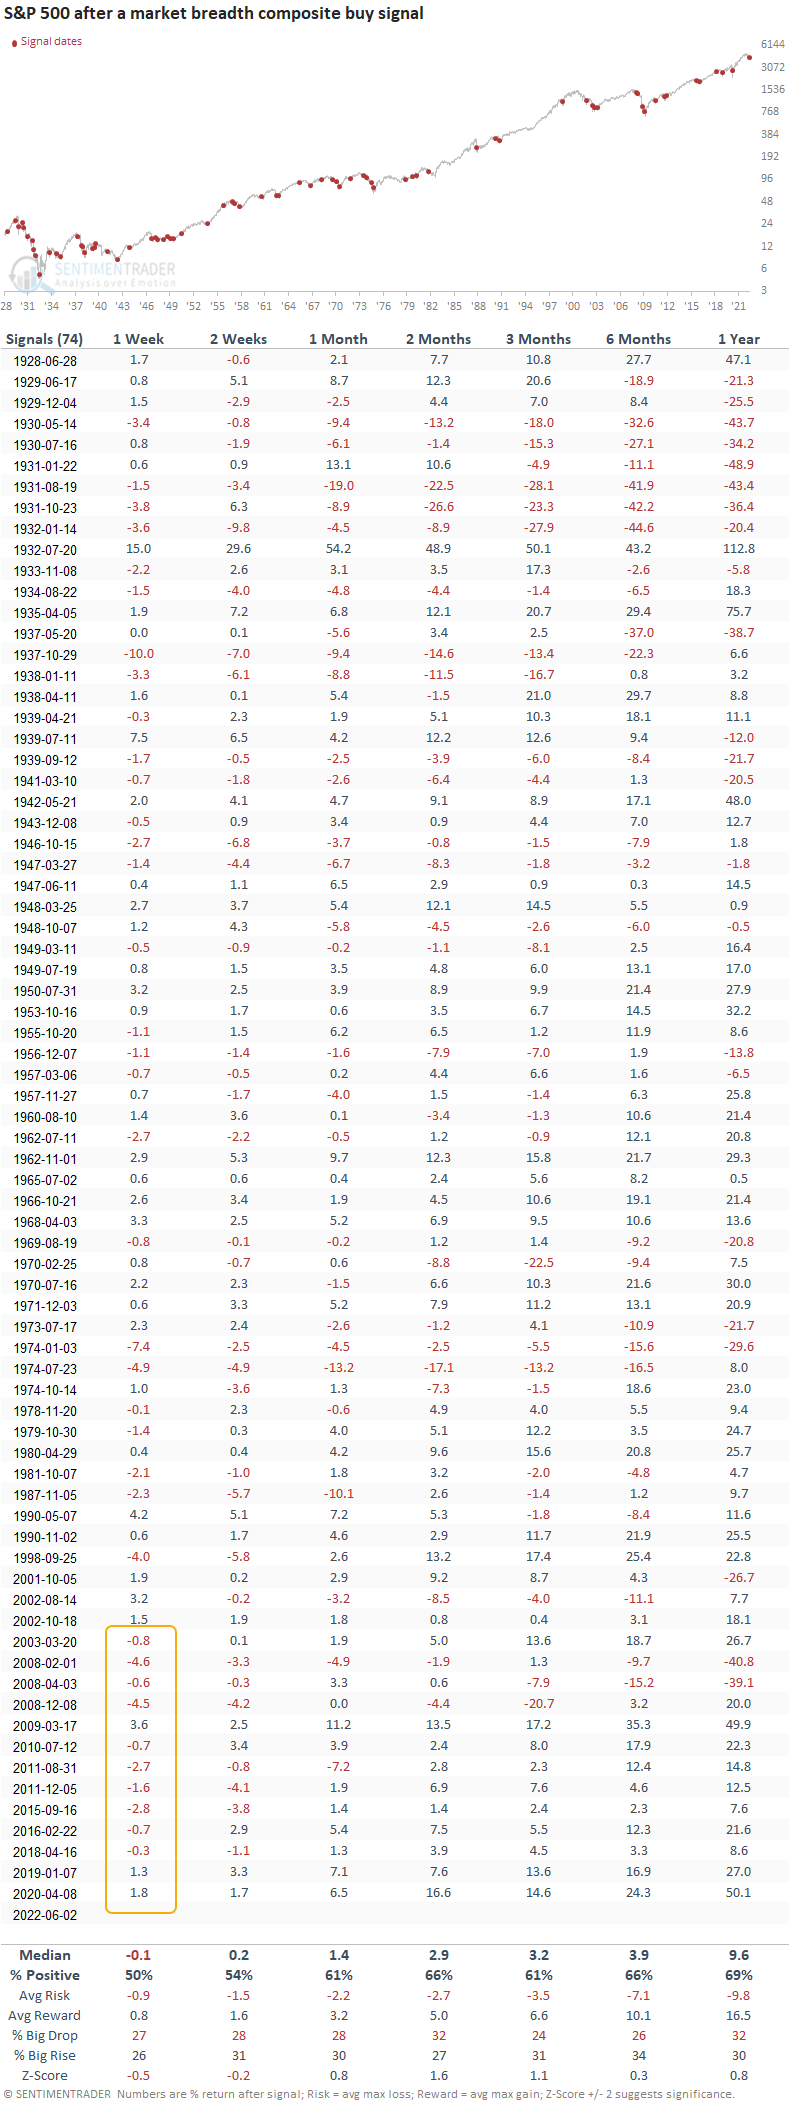
This model generated a signal 74 other times over the past 94 years. After the others, S&P 500 future returns, win rates, and risk/reward profiles look uninspiring in the first couple of weeks. The more recent signals show a negative return at some point in the first two weeks in 10 out of 13 cases. While the medium and long-term results are positive, the 2-month window is the only time frame that stands out.
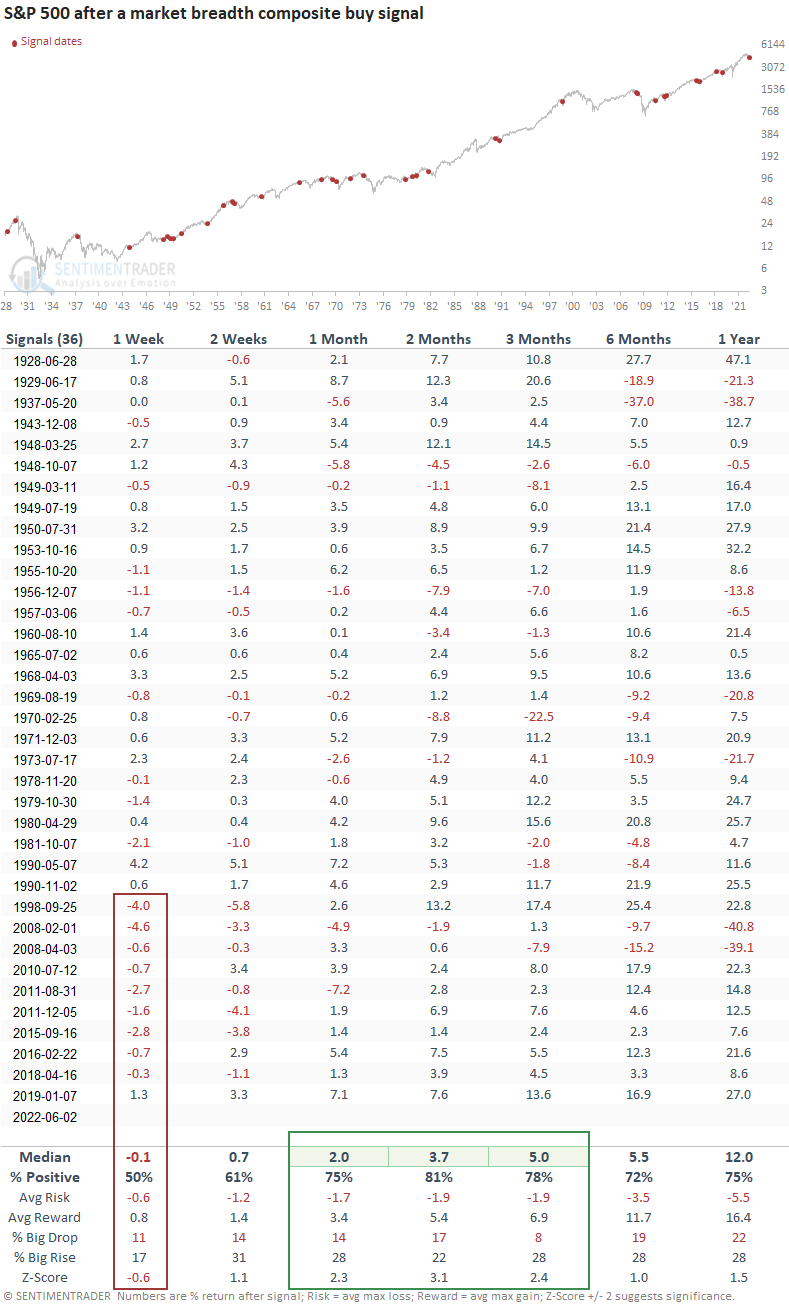
Signals that occurred when the S&P 500 was down 20% or less
Let's add some context to the oversold condition. The outlook table will only include signals that occurred when the S&P 500 was down 20% or less, which is the case now. The non-bear market signals occurred 36 other times over the past 94 years. After the others, S&P 500 future returns, win rates, and risk/reward profiles continue to show unfavorable results in the 1-week time frame, especially the more recent instances. The 1-3 month results look significantly better across all metrics.
What the research tells us...
When the market breadth composite score increases to 5 or more and reverses to 2 or less, an oversold condition typically leads to a mean-reversion bounce on a multi-month basis. Similar setups to what we're seeing now have preceded slightly unfavorable results in the near term and a more favorable medium-term outlook, especially in the 2-month window. If we isolate signals that occurred when the S&P 500 was down 20% or less, the results still show unfavorable developments in the near term but a significantly better outlook across the 1-3 month time frames. So, we need to be mindful that the S&P 500 could be choppy in the near term as the market eventually grinds higher on a medium-term basis.