
A combination of indicators points to favorable odds

Key points
- The Panic/Euphoria Model has been multiple favorable signals in the past nine months
- Our Short-Term Risk Levels indicator also touched a number that higher stock prices have often followed
- Many traders make the mistake of expecting a single indicator to act as a trading system.
- The real value is often obtained by combining two or more indicators
Panic/Euphoria Model keeps flashing green
Our Panic/Euphoria Model is based on the Citi Panic/Euphoria model published in Barron's magazine. It does not reflect those published values; our interpretation of the model inputs and construction differs modestly from the published figures. It has recently given a string of favorable signals.
The chart below displays all days when the Panic/Euphoria model crossed from below to above -0.168, and the table summarizes S&P 500 performance following these signals.
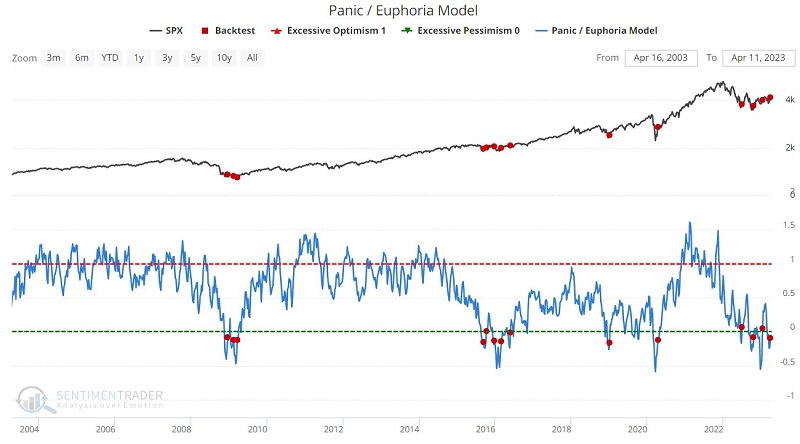
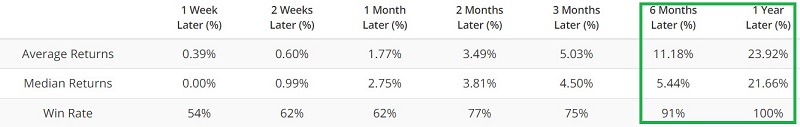
Any individual signal may be early, but in the last 20 years, each cross above -0.168 was followed by a higher S&P 500 Index twelve months later. This does not guarantee that the recent signal - or any future signals - will follow suit. Nevertheless, the recent string of signals falls firmly on the bullish side of the ledger.
Short-Term Risk Levels generating counter-intuitive results
The chart and table below display all days when the Short-Term Risk Levels indicator showed a reading of 9. Results for one week after a signal are roughly a coin flip. However, market results have skewed decidedly bullish six and twelve months later.
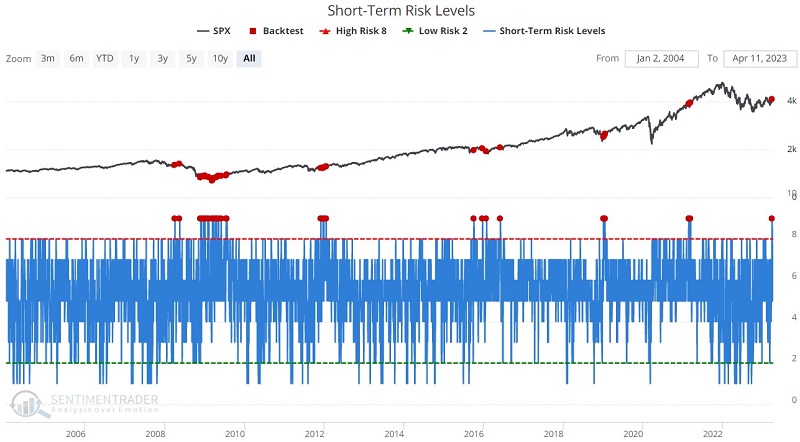
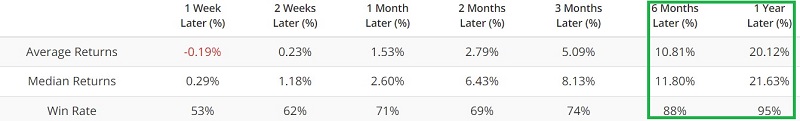
The good news is that the S&P 500 stood higher twelve months after a signal 95% of the time. The bad news is that the signals in April and May of 2008 were followed by the devastating bear market decline in late 2008 and early 2009. Many investors will point to that decline as a reason to dismiss signals from this indicator. But here is the thing to remember: Not every signal from every (or any particular) indicator should be considered an "automatic buy signal." We prefer a "weight of the evidence" approach, whereby some confluence of indicator signals causes the odds to tip in favor of a bullish (or bearish) outlook. Let's illustrate this approach by combining signals from these two indicators.
Combining Panic/Euphoria and Short-Term Risk Levels
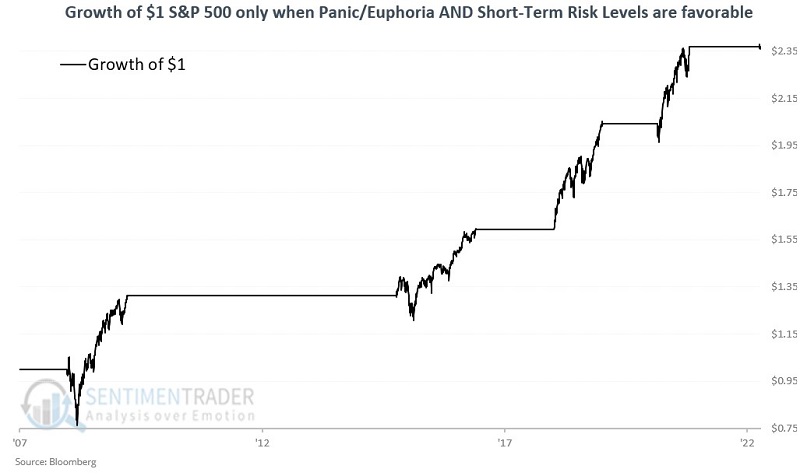
For the following test, we will assume that a trader holds the S&P 500 Index (easily done via an index ETF) only when both of the indicators above have flashed a favorable signal (i.e., a "red dot" on the charts above) anytime within the past twelve months. The chart below displays the growth of $1 invested in the S&P 500 only when this is the case.
The table below displays the start and end dates for those periods when both indicators are considered favorable, as well as the S&P 500 performance and the maximum % drawdown from the entry price.
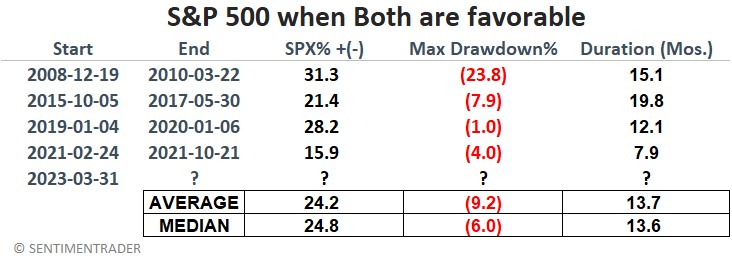
This is an admittedly small sample size, so we should be careful about trying to draw any conclusions. Still, the four previous favorable periods - which typically lasted for just under 14 months - have demonstrated very positive reward-to-risk results.
What the research tells us…
Relying on one indicator to generate buy and sell signals involves accepting the risk associated with the reality that no indicator is infallible. Combining signals from indicators that typically show favorable results can help an investor skew the odds in their favor. The results above do not guarantee that stocks will behave positively in the months ahead. But they suggest giving the bullish case the benefit of the doubt - particularly as long as the S&P 500 holds above its longer-term moving average.