Products
SentimenTrader Trading Tools
‍
Backtest Engine
My Trading Toolkit
Correlation Analysis
Seasonality
Market Prediction
Indicators & Data API
‍
Proprietary Indicators & Charts
Market Data API
Strategies & Scanner
‍
50+ Trading Strategies
Smart Stock Scanner
Smart Option Scanner
Research Reports
‍
Research Solutions
Reports Library
Free Resources
Simple Backtest Calculator
Simple Seasonality Calculator
The Kelly Criterion Calculator
Sentiment Geo Map
Public Research Reports
Education
Sentiment Indicators
Technical Indicators
Pricing
Company
About
In the News
Testimonials
Client Success Stories
Contact
Log inLoginSign up
< BACK TO ALL REPORTS

A Cluster Of Warnings

Jason Goepfert
2019-11-22
null

This is an abridged version of our recent reports and notes. For immediate access with no obligation, sign up for a 30-day free trial now.


Cluster funk

If we focus on one particular data point too much, then we risk getting blindsided by a structural market change or simply a failed signal. That’s why we tend to look at a lot of different things, from a lot of different perspectives, to see what the overall theme is.

So, this will probably be one of the last times we focus on some of the breadth warnings that are popping up. The only reason to bring it up again is that it has branched out from only triggering on the Nasdaq to also now being on the NYSE.

Both exchanges are throwing off Hindenburg Omens and Titanic Syndromes on a daily basis. This is now one of the biggest clusters of warnings since 1986.

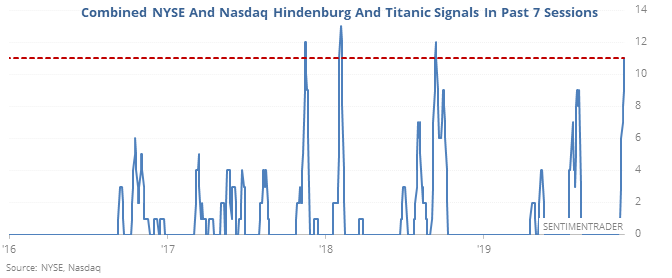
Outside of two remarkable momentum years, medium-term returns after similar clusters were almost universally negative.


De-levered

Despite a steady monthly climb in stocks, investors continue to de-leverage. Margin debt has held steady or declined for most of the past year.

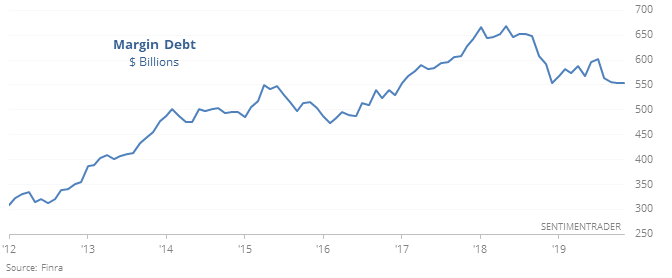
Bulls want to spin this as a sign that investors have been to risk-averse and therefore there is plenty of buying power to come in and power stocks higher. Bears want to spin it as a sign that investors aren’t willing to leverage up as stocks rise, ultimately leading to a decline for stocks. Neither one has a strong argument.

Going back over 80 years, similar setups led to mixed returns.


NASDAQ Composite's long term trend

Over the past few months, various indices' monthly MACD histograms have turned positive. I've demonstrated that this typically marks the beginning of a big rally in stocks over the next 1-2 years. Barring a significant decline over the next week, the NASDAQ Composite's monthly MACD histogram will also turn positive for the first time in 12 months as of November's close.

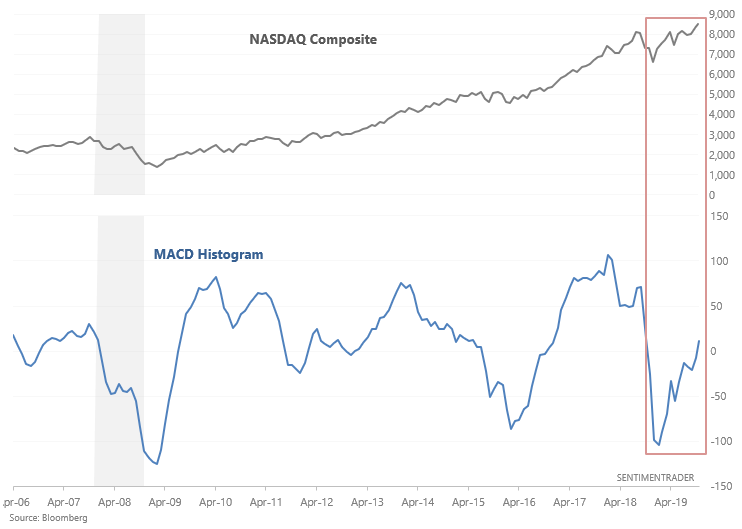
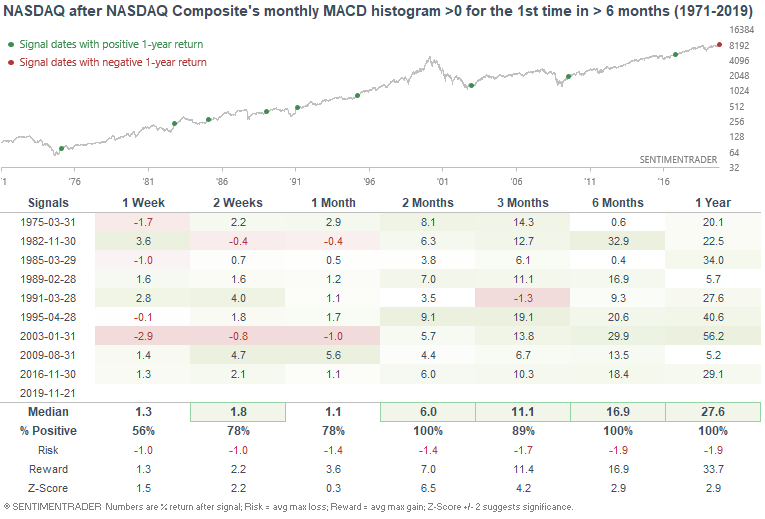
When the MACD histogram turned positive for the first time in more than 6 months, the NASDAQ Composite typically surged over the next 6-12 months.

There are quite a few shorter-term warning signs that have popped up lately, but when we look at longer-term momentum, it has reached a level that most often precedes further long-term gains.


We also looked at:

  • The LEI has dropped for 3 months in a row
  • Our CNN Fear & Greed proxy model is pulling back from extreme greed
  • Minimum volatility ETFs are seeing outflows
  • The Index Put/Call Ratio spiked again
PRODUCTS
SentimenTrader
Trading Tools
Indicators & Data API
‍
Strategies & Scanner
‍
Research Reports
FREE
RESOUrCES
Simple Backtest
Calculator
Simple Seasonality
Calculator
The Kelly Criterion
Calculator
Sentiment Geo Map
‍
Public Research Reports
‍
Education
Sentiment Indicators
‍
Technical Indicators
‍
Pricing
Bundle pricing
‍
FAQ
‍
Announcements
‍
COMPANY
‍
About
‍
In the News
‍
Testimonials
‍
Client Success Stories
CONTACT
‍
General Inquiries
‍
Media Inquiries
‍
Financial Professionals Inquiries
‍
© 2026 Sundial Capital Research Inc. All rights reserved.
Setsail Marketing
TermsPrivacyAffiliate Program
Risk Disclosure: The information and tools provided are for research and analytical purposes only and are not intended as investment advice. Market analysis involves uncertainty, and outcomes may differ from expectations. Users should conduct their own due diligence and consider their individual circumstances before making any financial decisions. Past performance is not necessarily indicative of future results.

Hypothetical Performance Disclosure: Hypothetical performance results have many inherent limitations, some of which are described below. No representation is being made that any account will or is likely to achieve profits or losses similar to those shown; in fact, there are frequently sharp differences between hypothetical performance results and the actual results subsequently achieved by any particular trading program. One of the limitations of hypothetical performance results is that they are generally prepared with the benefit of hindsight. In addition, hypothetical trading does not involve financial risk, and no hypothetical trading record can completely account for the impact of financial risk of actual trading. for example, the ability to withstand losses or to adhere to a particular trading program in spite of trading losses are material points which can also adversely affect actual trading results. There are numerous other factors related to the markets in general or to the implementation of any specific trading program which cannot be fully accounted for in the preparation of hypothetical performance results and all which can adversely affect trading results.

Testimonial Disclosure: Testimonials appearing on this website may not be representative of other clients or customers and is not a guarantee of future performance or success.