
A cluster of breadth thrusts bodes well for stocks

Key points:
- A Zweig breadth thrust for NYSE data triggered an alert at the close of trading on Thursday
- Similar thrusts produced excellent returns and consistency for the S&P 500 over the next year
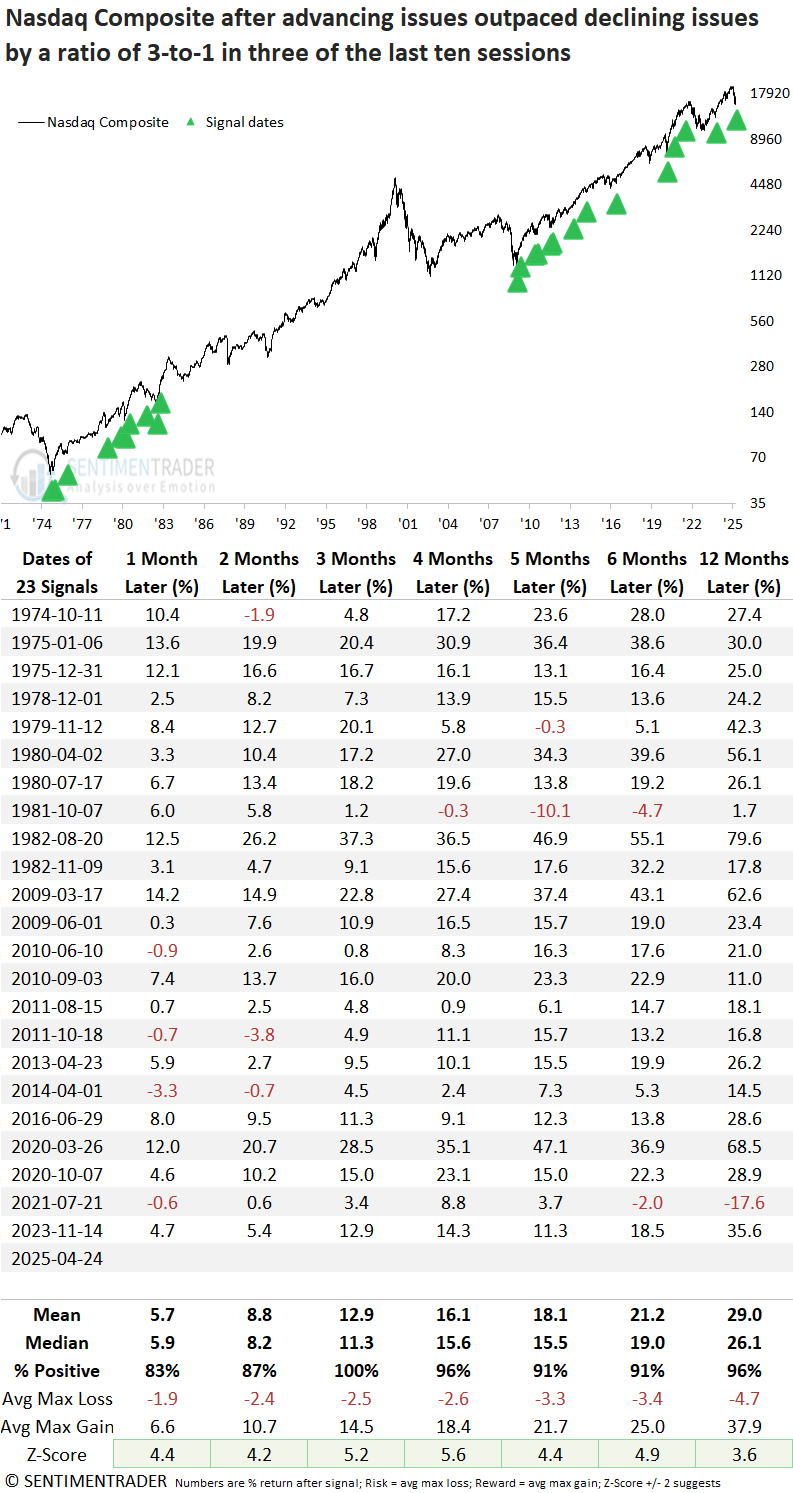
- The advance-decline ratio for the Nasdaq exceeded 3-to-1 in three out of the last ten sessions
- Comparable breadth skews saw the Nasdaq rise 100% of the time over the next three months
Several breadth thrusts suggest stocks are in the early stages of a trend reversal
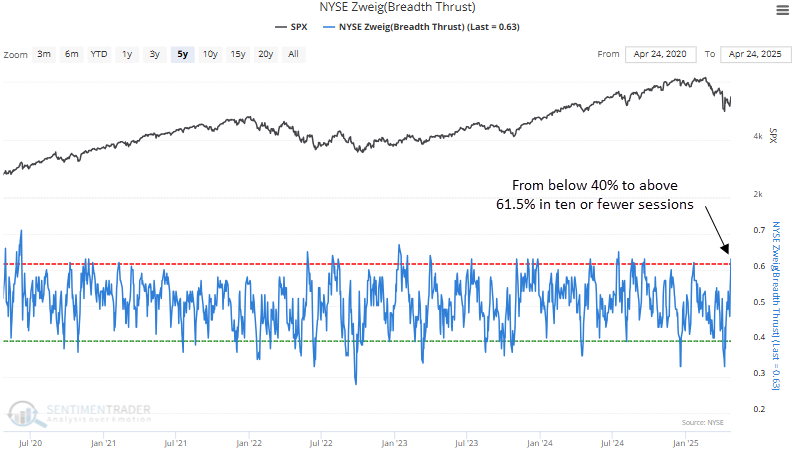
One of the most widely followed breadth thrust indicators, the Zweig thrust, created by legendary investor Marty Zweig, triggered on Thursday. The indicator measures NYSE advancing issues as a percentage of advancing and declining issues, smoothed by a 10-day exponential moving average. An alert is triggered when the indicator cycles from below 40% to above 61.5% in ten trading sessions or fewer.
Meanwhile, the Nasdaq staged what may be an even more powerful breadth thrust when its advance-decline ratio exceeded 3-to-1 in three of the past ten sessions.
When thrust signals emerge during a downtrend, as we are seeing now, it often indicates that the broader trend is starting to reverse. While this doesn't guarantee a smooth transition, history suggests that stocks tend to be higher six to twelve months later. In the meantime, short-term volatility is likely to persist, especially in the current tariff environment.
Similar Zweig thrusts preceded a favorable outlook for stocks
Whenever a Zweig thrust occurred, the S&P 500 displayed outstanding returns and consistency over the subsequent year. That was especially the case post the 1929-42 secular bear market. Moreover, multiple time horizons have recorded impressive win streaks, with the six-month window leading the way, boasting 20 uninterrupted gains since 1938.
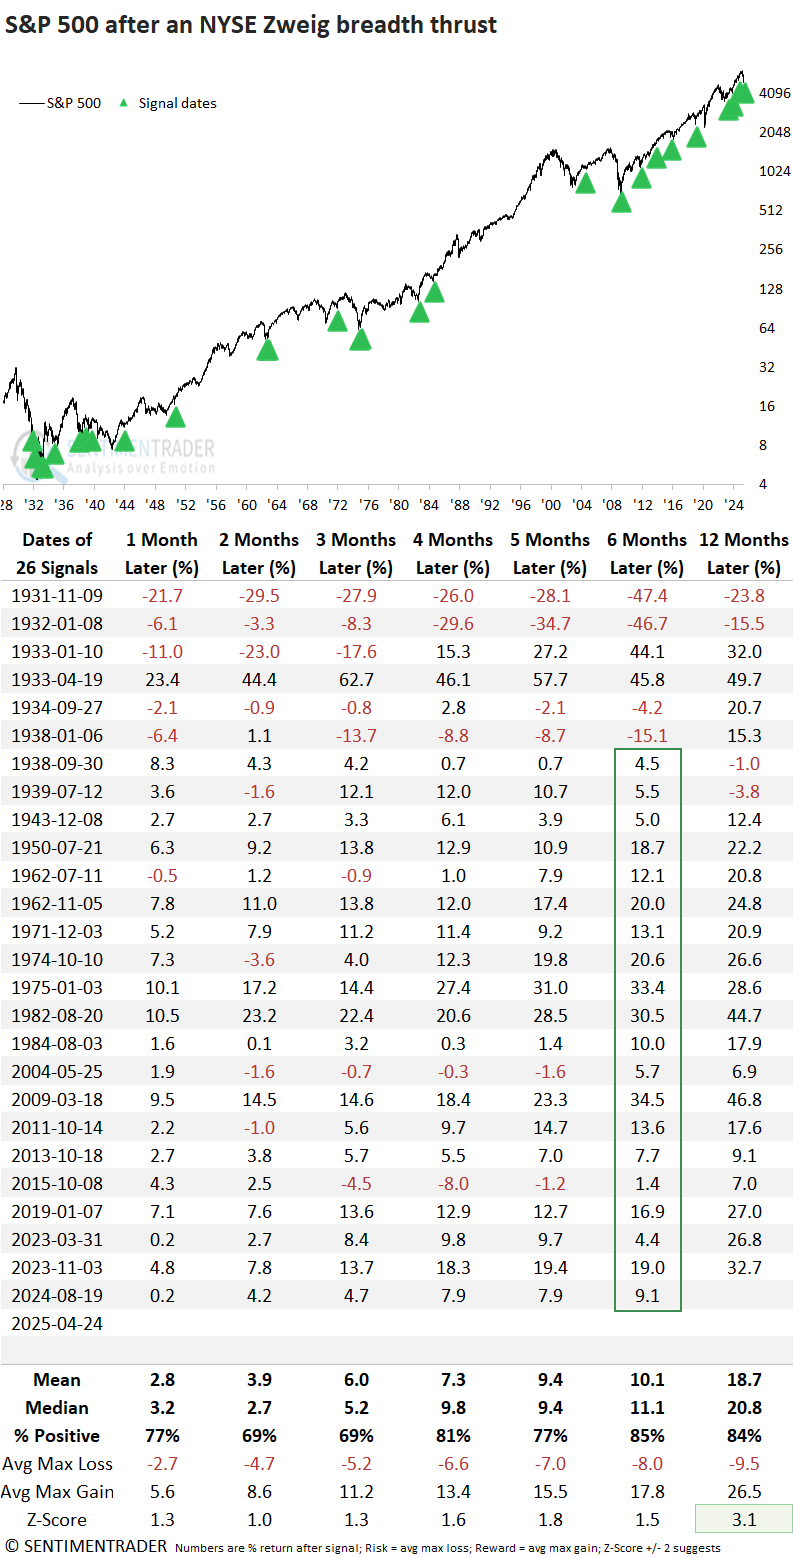
Signals may vary slightly depending on one's data vendor. For example, this table contains an alert on August 19, 2024, which other services may not show. We have several vendors, and they don't always align with each other.
Not all Zweig signals are without risk
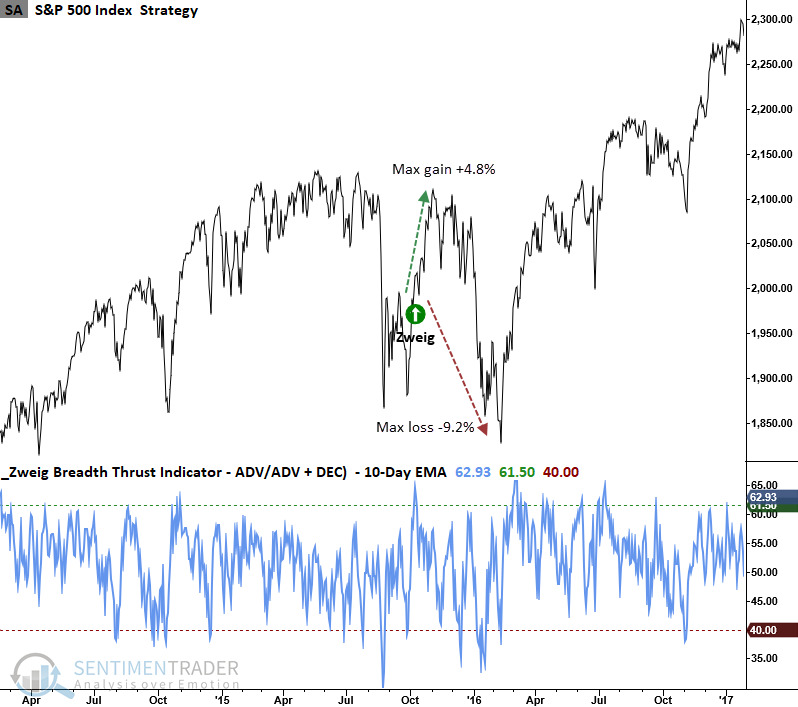
In previous reports, I have highlighted the 2015-16 growth scare correction as a potential analog for the current environment. Given that a Zweig thrust occurred during this period, it's worth revisiting.
A rally on par with 2015's 4.8% max gain (signal date to peak on 2015-11-03) could lift the S&P 500 to its 200-day moving average around 5747.
What might trigger a retest scenario similar to the one in 2015? One likely cause would be the failure to secure trade agreements, or a material deterioration in hard economic data stemming from the initial tariff shock, prompting consumers and businesses to delay spending and investment decisions.
Breadth improves across the tech-heavy Nasdaq exchange
Over the last ten trading sessions, the advance-decline ratio for the Nasdaq exchange has surpassed a 3-to-1 reading on three occasions, indicating that a significant number of stocks are rallying.
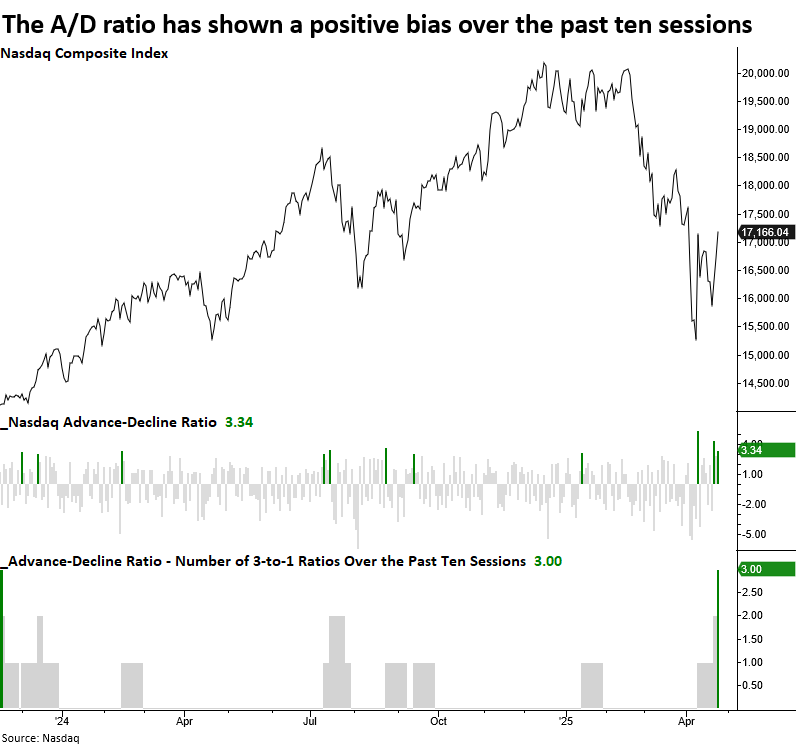
Every time a 10-day A/D ratio thrust occurred, the Nasdaq Composite experienced remarkable performance, with the tech-heavy index advancing 100% of the time in the three months that followed. Additionally, both the four- and twelve-month periods only showed a single loss, and each timeframe demonstrated statistical significance compared to random returns over the study period.
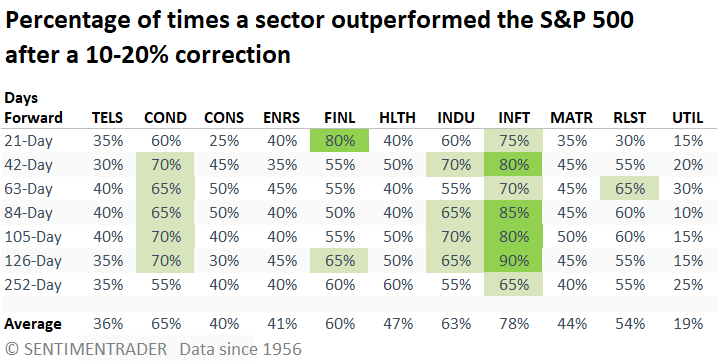
If you missed my report on Wednesday, I discussed which sectors outperformed the S&P 500 after corrections and bear markets. Technology stood out as the most consistent leader, as illustrated in the table from that note.
So, the Nasdaq thrust signal supports the case for technology.
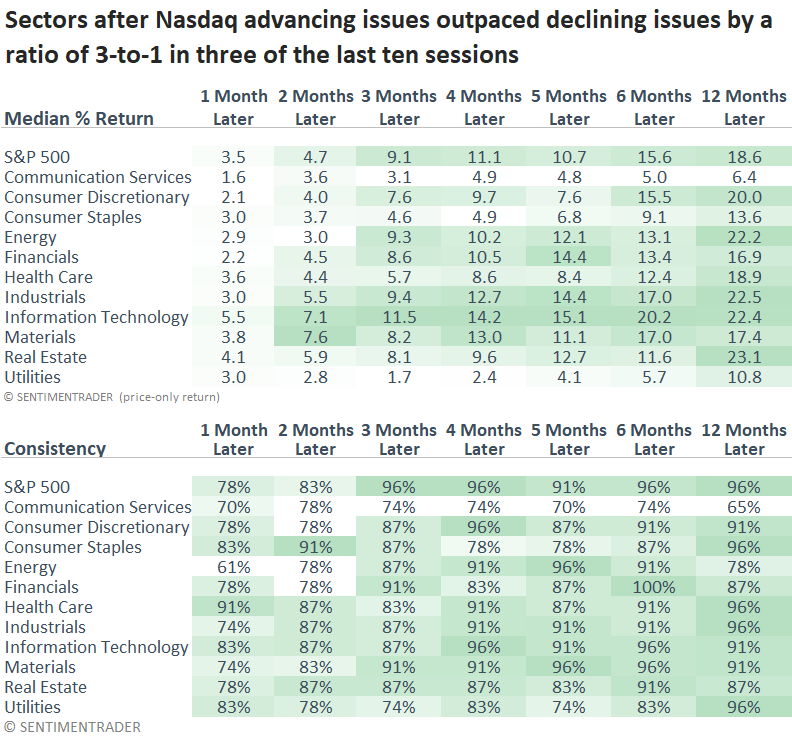
After Nasdaq thrust signals, the S&P 500 technology sector outperformed the S&P 500 across every time frame and was the best-performing sector relative to others in five of seven intervals.
What the research tells us...
Several breadth thrust signals were triggered on Thursday, indicating broad upside participation over a ten-day window. Historically, such precedents have been highly reliable, producing strong returns and consistency across major indices like the S&P 500, Nasdaq Composite, and the S&P 500 Technology sector. These breadth thrusts often act as a leading indicator of a shift from a bearish to a bullish trend. However, as demonstrated in 2015, a smooth transition from a downtrend to an uptrend is not always guaranteed. Despite a positive long-term outlook, volatility and choppy market conditions may persist in the near term, as headlines on tariffs will influence price action. For now, I would use down days to buy absolute and relative winners, targeting technology stocks.