
A closer look at the so-called Summer Rally

Key Points
- The stock market has shown a long-term tendency to perform less well during the summer months of June/July/August than during the rest of the year
- Results can, however, vary significantly from year to year
- One summer months period tends to shine (and makes the rest of the summer look that much worst by comparison)
The S&P 500 during June, July, and August
The chart below displays the Annual Seasonal Trend for the S&P 500 Index. Note that the average performance during the June/July/August period is a sideways affair. 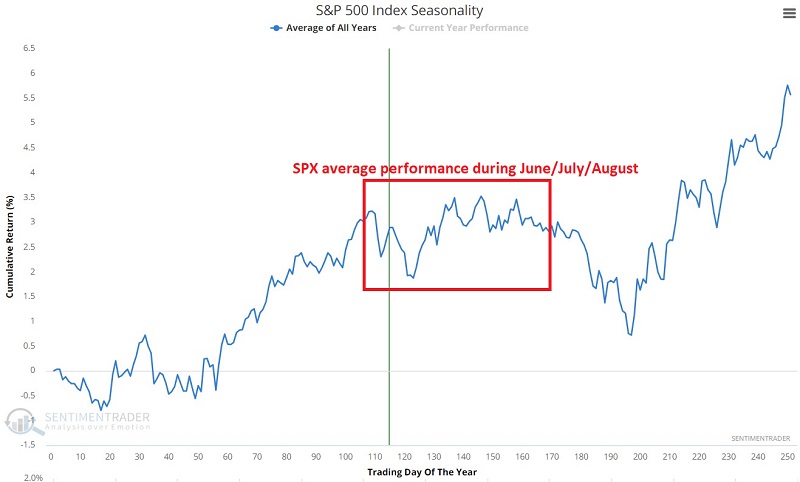
It is important to note that year-to-year performance can vary greatly - with some years showing exceptional gains, others with severe declines, and others still with something resembling the "going nowhere" action shown below. But the bottom line is that investors may be wise to temper their expectations and practice patience during the summer months.
This seems like an opportune time to invoke:
Jay's Trading Maxim #52: Patience is a virtue - and also a pain in the rear when it comes to investing.
The chart below displays the growth of $1, assuming an investor held a long position in the S&P 500 Index every year ONLY during June, July, and August, starting in 1940 (through 6/20/2023).
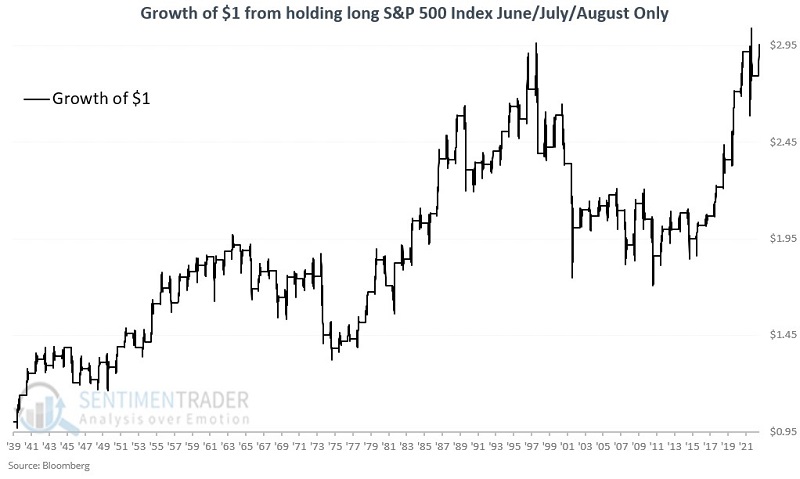
At a glance, the results seem OK, if a bit choppy. The $1 grew to $2.93, for a cumulative % gain of +193%. Before looking more closely for a "summer rally," let's first put this in perspective versus the rest of the year.
S&P 500 during All Other Months
To put the June/July/August returns from the chart above into perspective, the chart below displays:
- Growth of $1 for an investor who held a long position in the S&P 500 Index every year ONLY during June, July, and August, starting in 1940
- Growth of $1 for an investor who held a long position in the S&P 500 Index every year ONLY during ALL MONTHS OTHER THAN June, July, and August, starting in 1940
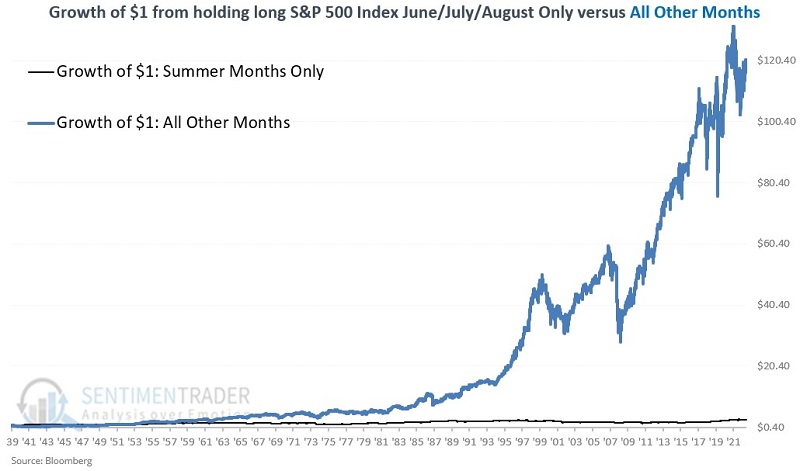
The bottom line:
- June/July/August combined have gained +193% since 1940
- All other months combined have gained +11,884% since 1940
Suddenly, summer month returns don't look so great.
The Summer Rally Period
The period we will focus on incorporates 12 trading days by combining the following:
- The last three trading days of June
- The first nine trading days of July
We will refer to this as the "Summer Rally Period." For 2023, this period extends from the close on 2023-06-27 through the closing on 2023-07-14.
We will refer to all other trading days during June, July, and August as "All Other Summer Days."
In the chart below:
- The black line displays the growth of $1 for SPX during the "Summer Rally Period"
- The blue line shows the growth of $1 for SPX during "All Other Summer Days"
The test period extends from 1940 through 2023-06-20.
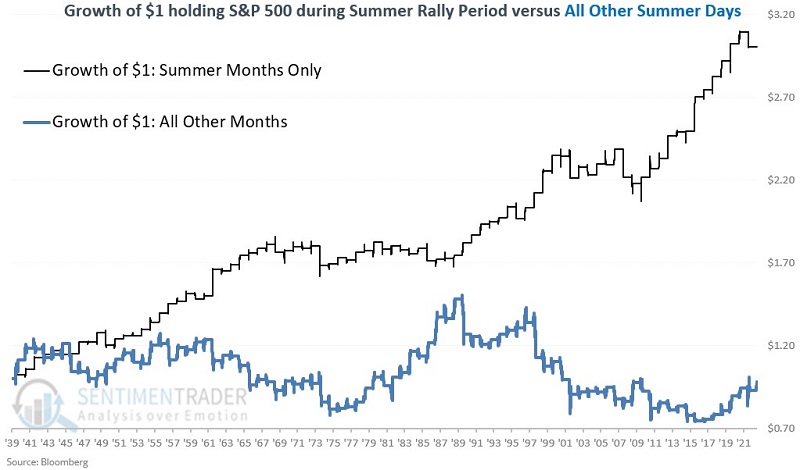
The bottom line:
- The summer rally period has gained +200.5%
- All other summer days combined have lost (-2.4%)
During the past 83 years, the S&P 500 Index has lost ground during "All Other Summer Days." Of course, results can vary widely from year-to-year.
Summary of Results
The table below displays a "Summery" er, summary of results for Summer Rally Periods versus All Other Summer Days.
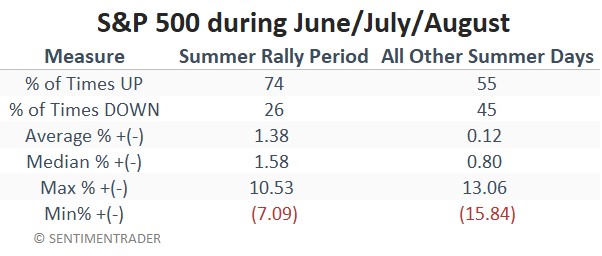
What the research tells us…
As with any seasonal trend, results can vary widely from year-to-year. That said, traders looking to avoid the "Summertime Blues" might be best advised to give the market the benefit of the doubt from late June into early July and exercise patience and/or caution during other days.