Products
SentimenTrader Trading Tools
‍
Backtest Engine
My Trading Toolkit
Correlation Analysis
Seasonality
Market Prediction
Indicators & Data API
‍
Proprietary Indicators & Charts
Market Data API
Strategies & Scanner
‍
50+ Trading Strategies
Smart Stock Scanner
Smart Option Scanner
Research Reports
‍
Research Solutions
Reports Library
Free Resources
Simple Backtest Calculator
Simple Seasonality Calculator
The Kelly Criterion Calculator
Sentiment Geo Map
Public Research Reports
Education
Sentiment Indicators
Technical Indicators
Pricing
Company
About
In the News
Testimonials
Client Success Stories
Contact
Log inLoginSign up
< BACK TO ALL REPORTS

A Closer Look at the Gold Miners Santa Claus Rally

Jay Kaeppel
2025-12-11
Gold mining stocks have shown a tendency to stage a "Santa Claus" rally of their own. We review the history herein.

Key points

  • Most investors have heard reference to the "Santa Claus Rally" in stocks
  • Gold-related stocks have also enjoyed a boost during a specific late-year seasonal window
  • The typically favorable period for gold miners is starting soon

The Santa Claus Miner rally

Most of us are aware that stocks tend to receive a seasonal tailwind around this time of year. Less well known is that gold-related stocks have also enjoyed consistent gains.

As I define it, the Santa Claus Gold Miner Rally period:

  • Begins on the close of the 11th trading day of December and; 
  • Extends through the close on the first trading day of January in the New Year 

For 2025, this period extends from the close on December 15th through the close on January 2, 2026.

The data we will use

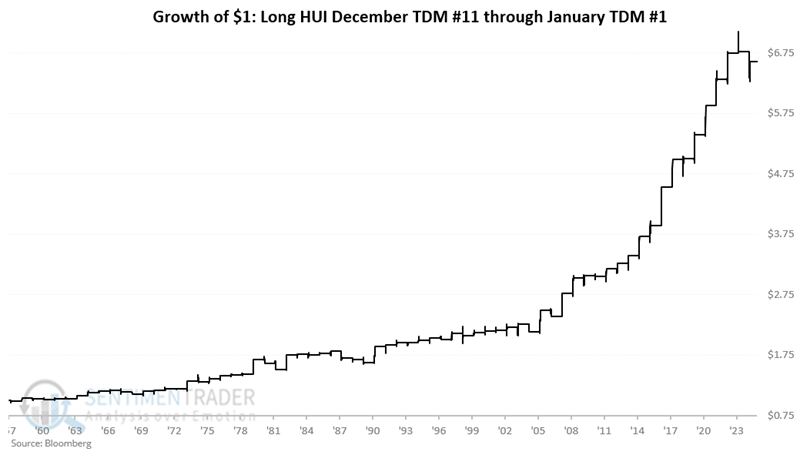
To test the longest possible history, we will use the Gold Bugs Index (ticker: HUI), for which we have data dating back to 1957. The chart below displays the growth of $1 invested in HUI only from the close of December Trading Day of Month (TDM) #11 through January TDM #1. 

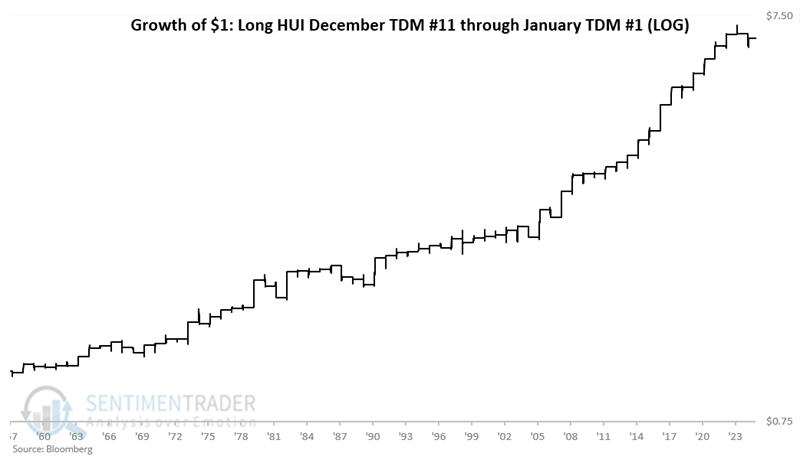
The chart below displays the same data on a logarithmic basis.

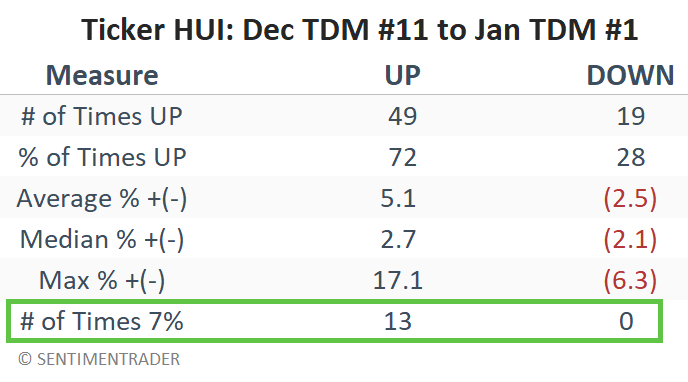
The table below summarizes HUI's performance during this late-year seasonal window. Note that big moves of 7% or more have all skewed to the positive side.

GDX as a trading vehicle

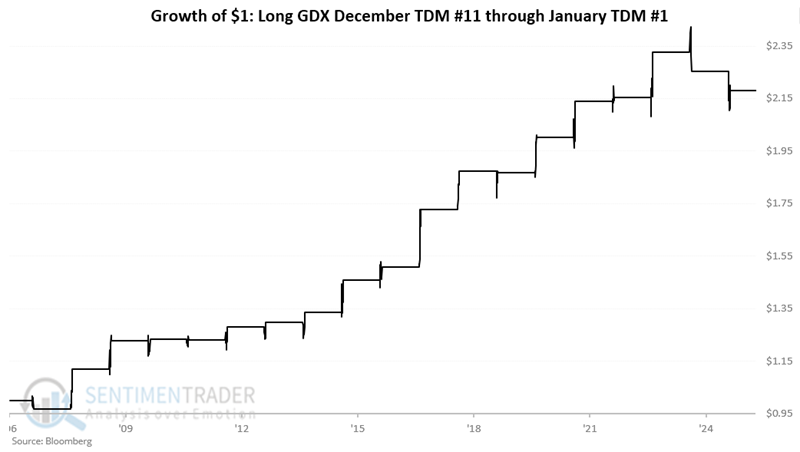
Ticker HUI is an index and cannot be traded directly. The VanEck Gold Miners ETF (ticker: GDX) is an exchange-traded fund that tracks an index of gold mining stocks, providing traders with a direct way to play the sector. GDX began trading in 2006. Per Vaneck:

GDX seeks to replicate as closely as possible, before fees and expenses, the price and yield performance of the NYSE Arca Gold Miners Index (GDMNTR), which is intended to track the overall performance of companies involved in the gold mining industry.

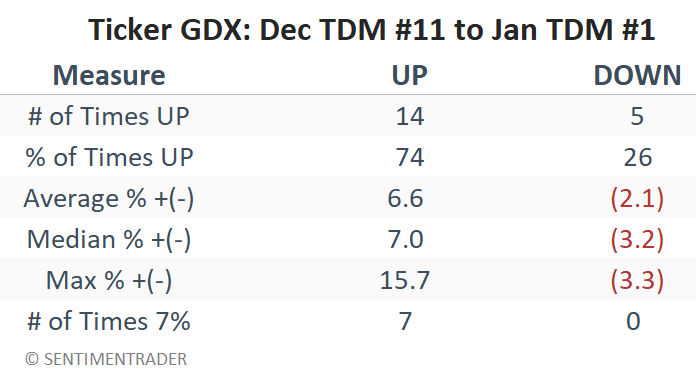
The chart and table below display GDX performance during this favorable window since inception.

What the research tells us…

The good news is that gold stocks have shown a reliable long-term tendency to rally during the latter part of December. Over 68 years, gold stocks have shown a gain in 7 out of 10 years. So will 2025 be one of the seven out of ten good years? Or one of three not so good? Unfortunately, there is no way to predict. In light of that fact, the correct approach is probably to treat this as a speculative opportunity with a conservative position size and a manageable stop-loss provision, and remember not to take it personally if a loss is incurred occasionally.

PRODUCTS
SentimenTrader
Trading Tools
Indicators & Data API
‍
Strategies & Scanner
‍
Research Reports
FREE
RESOUrCES
Simple Backtest
Calculator
Simple Seasonality
Calculator
The Kelly Criterion
Calculator
Sentiment Geo Map
‍
Public Research Reports
‍
Education
Sentiment Indicators
‍
Technical Indicators
‍
Pricing
Bundle pricing
‍
FAQ
‍
Announcements
‍
COMPANY
‍
About
‍
In the News
‍
Testimonials
‍
Client Success Stories
CONTACT
‍
General Inquiries
‍
Media Inquiries
‍
Financial Professionals Inquiries
‍
© 2026 Sundial Capital Research Inc. All rights reserved.
Setsail Marketing
TermsPrivacyAffiliate Program
Risk Disclosure: The information and tools provided are for research and analytical purposes only and are not intended as investment advice. Market analysis involves uncertainty, and outcomes may differ from expectations. Users should conduct their own due diligence and consider their individual circumstances before making any financial decisions. Past performance is not necessarily indicative of future results.

Hypothetical Performance Disclosure: Hypothetical performance results have many inherent limitations, some of which are described below. No representation is being made that any account will or is likely to achieve profits or losses similar to those shown; in fact, there are frequently sharp differences between hypothetical performance results and the actual results subsequently achieved by any particular trading program. One of the limitations of hypothetical performance results is that they are generally prepared with the benefit of hindsight. In addition, hypothetical trading does not involve financial risk, and no hypothetical trading record can completely account for the impact of financial risk of actual trading. for example, the ability to withstand losses or to adhere to a particular trading program in spite of trading losses are material points which can also adversely affect actual trading results. There are numerous other factors related to the markets in general or to the implementation of any specific trading program which cannot be fully accounted for in the preparation of hypothetical performance results and all which can adversely affect trading results.

Testimonial Disclosure: Testimonials appearing on this website may not be representative of other clients or customers and is not a guarantee of future performance or success.