
A closer look at t-bond seasonality - Part II

Key Points
- T-bond price movements appear to have more cyclicality to them than most traders realize
- Below, we look at t-bond price movement across the four-year election cycle
- We also look at favorable and unfavorable trading days of the month
NOTE: We will use daily percent changes for 30-year treasury bond futures starting in 1977 for testing purposes. We will refer to this data series of daily t-bond prices simply as THIRTY.
Seasonal Factor #1: Annual Seasonal Trend
In this note dated 2025-02-24, we analyze the historical performance of long-term treasuries based on the annual seasonal trend. Now let's focus on the four-year cycle and intra-month patterns.
Seasonal Factor #2: Treasury bonds meet the election cycle
The table below displays my Election Cycle Month calendar for long-term treasuries.
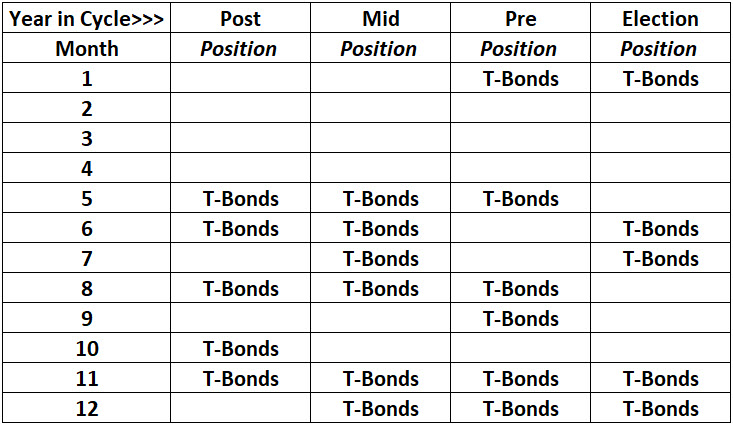
- The months showing "T-Bonds" in the table above are considered favorable ECM (Election Cycle Month).
- All other months are considered unfavorable ECM.
For example, as 2025 is a post-election year, the months of May, June, August, October, and November are deemed "favorable." All other months are deemed "unfavorable."
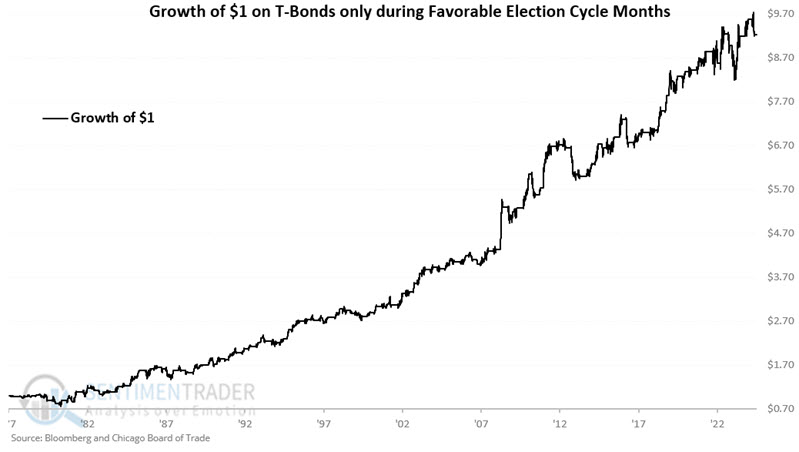
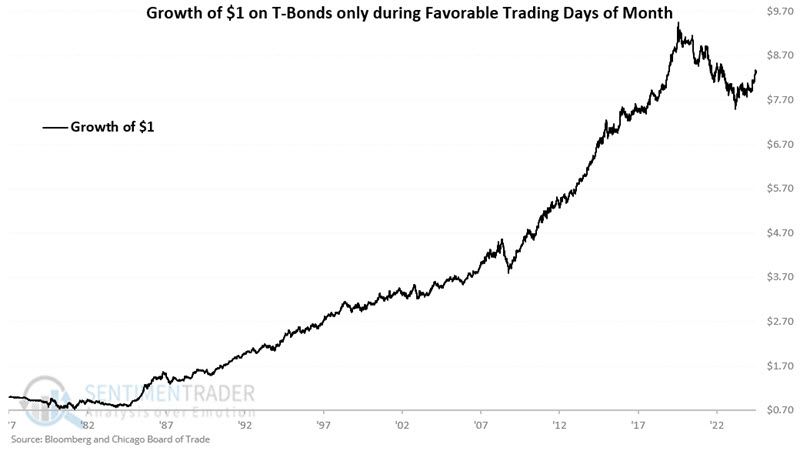
The chart below displays the hypothetical growth of $1 held in THIRTY only during Favorable ECMs since 1977. An initial $1 grew 824% to $9.24.
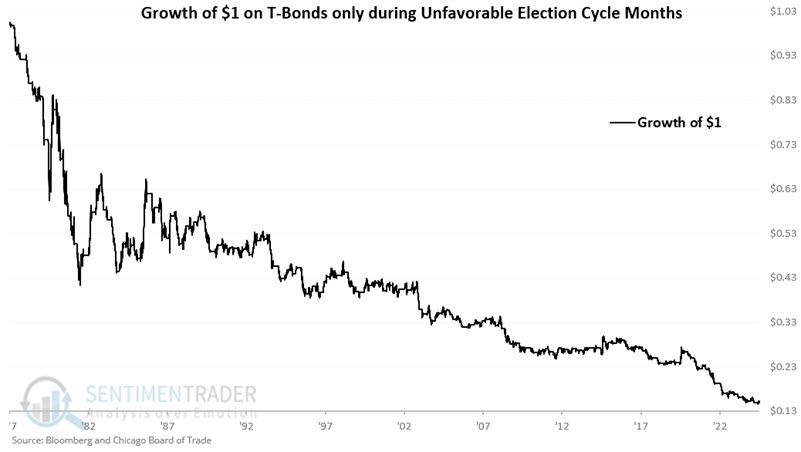
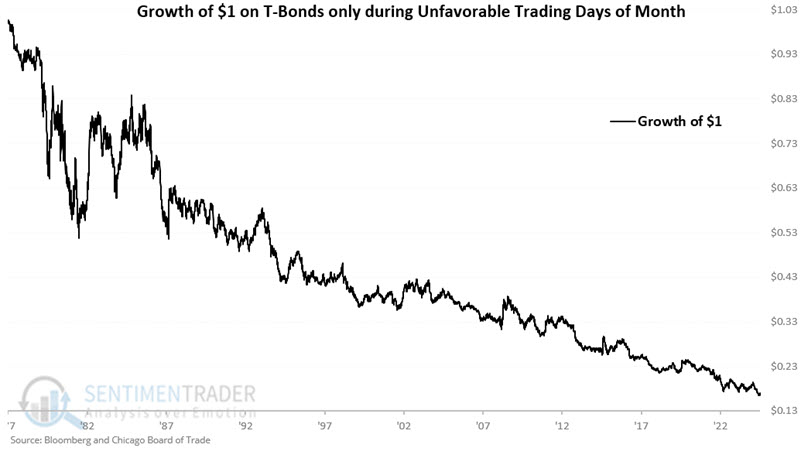
The chart below displays the hypothetical growth of $1 held in THIRTY only during Unfavorable ECMs since 1977. An initial $1 declined -85% to $0.15.
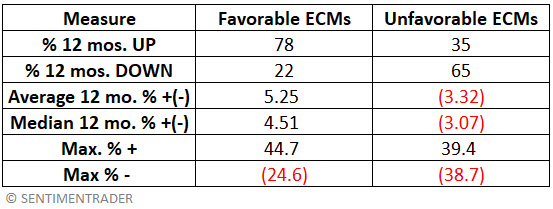
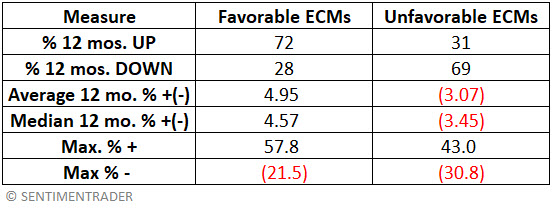
The table below summarizes THIRTY performances during Favorable versus Unfavorable ECM months.
Seasonal Factor #3: Treasury bonds Trading Day of Month (TDM)
The following trading days of the months are deemed "Favorable" for t-bonds:
- Trading Day of Month #10
- Trading Day of Month #11
- Trading Day of Month #12
- The last five trading days of the month
For each month, the trading days listed above = 1. For all other days of the month = 0.
The chart below displays the hypothetical growth of $1 held in THIRTY only when TDM = 1 since 1977. An initial $1 grew 730% to $8.32.
While long-term results are pretty favorable, it is critical to note that results have suffered during periods of rising interest rates (1977-1981, 2000 to present).
The chart below displays the hypothetical growth of $1 held in THIRTY only when TDM = 0 since 1977. An initial $1 declined 83% to $0.17.
The table below summarizes THIRTY performances during Favorable versus Unfavorable TDMs.
Combining ECM and TDM
On any given day, ECM and TDM can be favorable or unfavorable, or one could be favorable while the other is unfavorable. For our purposes, we will create an indicator called ECMTDM, which combines these two seasonal factors:
A = If ECM = 1 then A =2 else A = 0
B = If TDM = 0 then B = 1 else B = 0
C = A + B
ECMTDM = C
Let's look at t-bond performance for each situation.
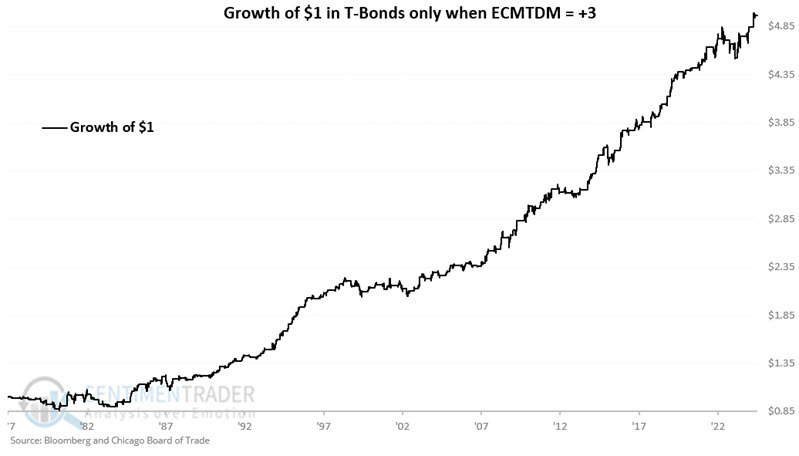
Both ECM and TDM are favorable (ECMTDM = +3)
The chart below displays the hypothetical growth of $1 held in THIRTY only when both ECM and TDM have been favorable since 1977. An initial $1 grew 396% to $4.96.
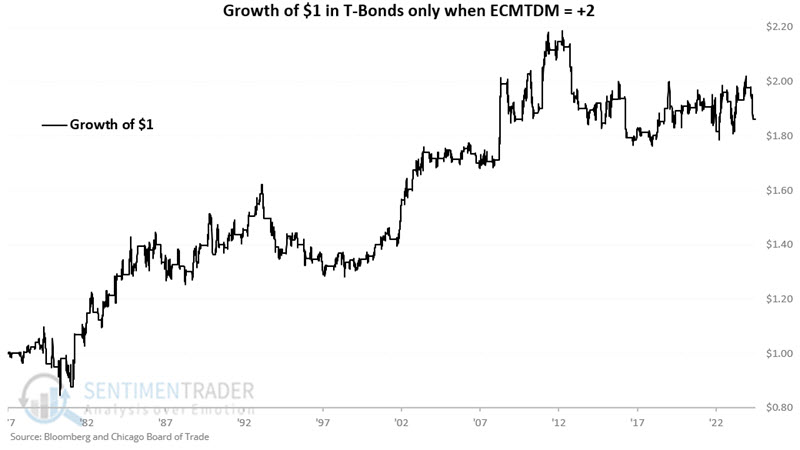
ECM favorable and TDM unfavorable (ECMTDM = +2)
The chart below displays the hypothetical growth of $1 held in THIRTY only when ECM is favorable, and TDM is unfavorable since 1977. An initial $1 grew 86% to $1.86.
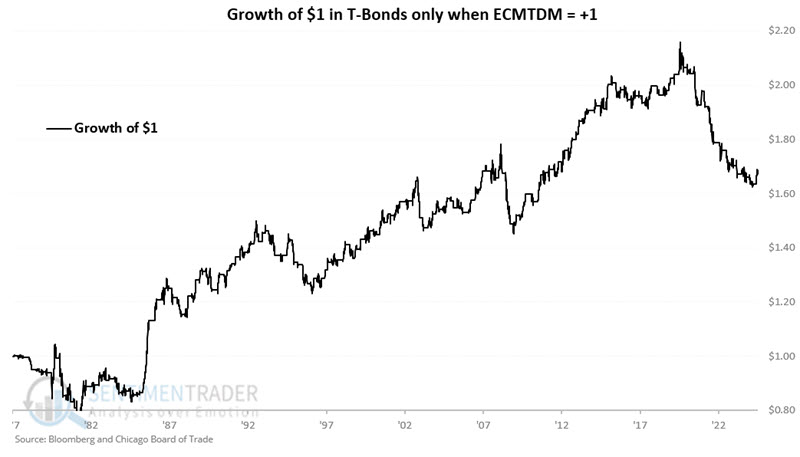
ECM unfavorable and TDM favorable (ECMTDM = +1)
The chart below displays the hypothetical growth of $1 held in THIRTY only when both ECM is unfavorable, and TDM is favorable since 1977. An initial $1 grew 67% to $1.67.
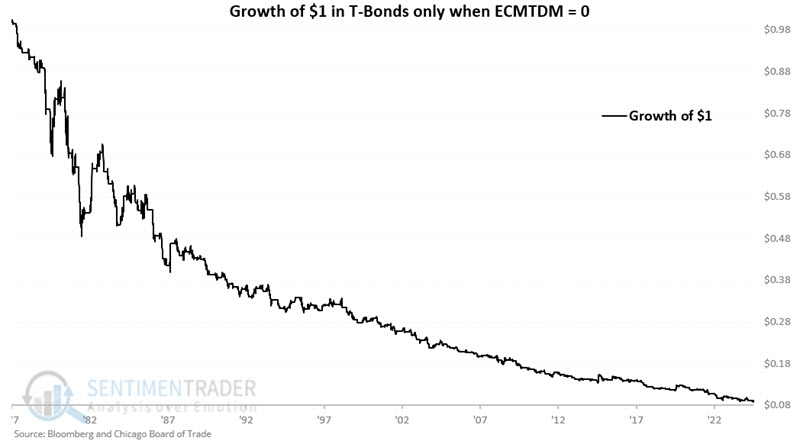
Both ECM and TDM are unfavorable (ECMTDM = 0)
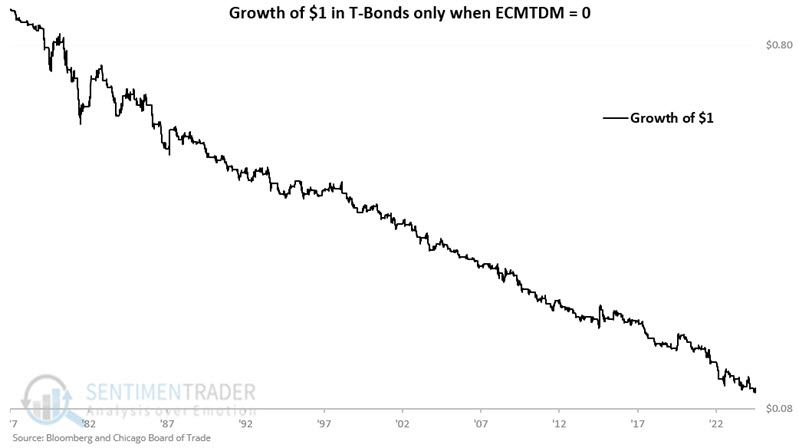
The chart below displays the hypothetical growth of $1 held in THIRTY only when both ECM and TDM are unfavorable since 1977. An initial $1 declined 91% to $0.09.
Just so there is no mistaking the message in the chart above, the chart below displays the same information on a logarithmic scale.
T-bond futures and T-bond ETFs
The most straightforward approach to trading t-bonds is to take a long position in 30-year t-bond futures to play a favorable scenario and sell short 30-year t-bond futures to play an unfavorable scenario. Futures contracts, however, are highly leveraged and assume potentially large dollar risks.
Note that as this is written, the initial margin requirement to trade a t-bond futures contract is $4,070. However, each one-point move in the price of a t-bond futures contract is worth $1,000. So, if futures are trading at $117, this implies a contract value of $117,000. A five-point move in price will result in a $5,000 change in the value of the futures contract. If a trader is on the wrong side of that move they could receive a margin call to cover the loss beyond the initial margin deposit.
For non-futures traders, several ETFs track long-term bonds, including leveraged and inverse versions. The obvious choice for the long side is the iShares 20+ Year Treasury Bond ETF (ticker TLT). The most aggressive play in the triple-leveraged Direxion Daily 20+ Year Treasury Bull 3x Shares ETF (ticker TMF). However, 3x funds entail a significant risk of loss and are only for traders who have thoroughly studied and understand the risks involved.
For a trader looking to play the short side of bonds, one non-leveraged inverse ETF is the ProShares Short 20+ Year Treasury ETF (ticker TBF). The most heavily traded inverse long-term treasury ETF is the Direxion Daily 20+ Year Treasury Bear 3x Shares ETF (ticker TMV), which trades roughly 1.8 million daily shares. However, it is critical to note that this ETF is leveraged 3x, i.e., it is designed to offer three times the inverse daily performance for long-term treasuries. Traders must carefully consider the associated risks before investing in leveraged or inverse - and especially leveraged and inverse - funds.
Calendar for 2025
The table below displays the ECMTDM calendar for 2025. While this is not intended to serve as an automated trading system, a trader would presumably favor a long position in t-bond futures or ETFs on days when ECMTDM = 3 and potentially a short position on days when ECMTDM =0. The standard caveat that past performance is no guarantee of future results is 100% applicable here.

What the research tells us...
There appears to be a potential edge for t-bond traders in focusing on the long side if both the Election Cycle Month (ECM) factor and Trading Day of the Month (TDM) factor are favorable. Likewise, for those willing to trade the short side (via either a short position in t-bond futures or a long position in an inverse t-bond ETF), there appears to be a potential edge for t-bond traders if both the Election Cycle Month (ECM) factor and Trading Day of the Month (TDM) factor are unfavorable. That said, there is never any guarantee that seasonal/cyclical factors will continue to play out in the future as they have in the past. As a result, traders are never relieved of their responsibility to allocate capital wisely and to manage risk ruthlessly.