
A closer look at post-U.S. presidential election years in the stock market

Key points
- Post-U.S. presidential election years have a bad reputation, but since 1901, they have shown a gain 58% of the time
- The good news is that nine of the last ten post-election years have seen the S&P 500 show an annual gain; The bad news is that this raises the potential for some "reversion to the mean"
- Traders may be able to gain an edge by focusing on certain months
Defining the period and the data
For testing post-election year stock market performance, we will use month-end price data for:
- The Dow Jones Industrial Average from 1901 through 1919
- The S&P 500 Index from 1920 to the present day
Post-election years occur every four years starting in 1901 (1901, 1905, 1909, 1913, etc.). Nine of the last ten post-election years have seen the S&P 500 show a gain; in fact, seven of those years witnessed a gain of at least +19%. So, should investors "lock in" for another big up year for stocks? Let's take a closer look.
A closer look at post-election year results month-by-month
The table below displays performance data for each month only during post-election years starting in 1901. The top 6 performing months are highlighted in green.
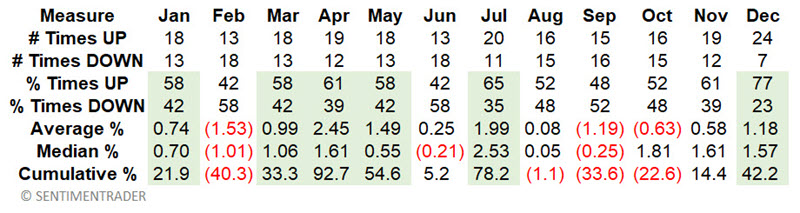
From here, we designate:
- Favorable (post-election year) months as January, March, April, May, July, and December
- Unfavorable (post-election year) months as February, June, August, September, October, and November
A closer look at favorable and unfavorable post-election year months
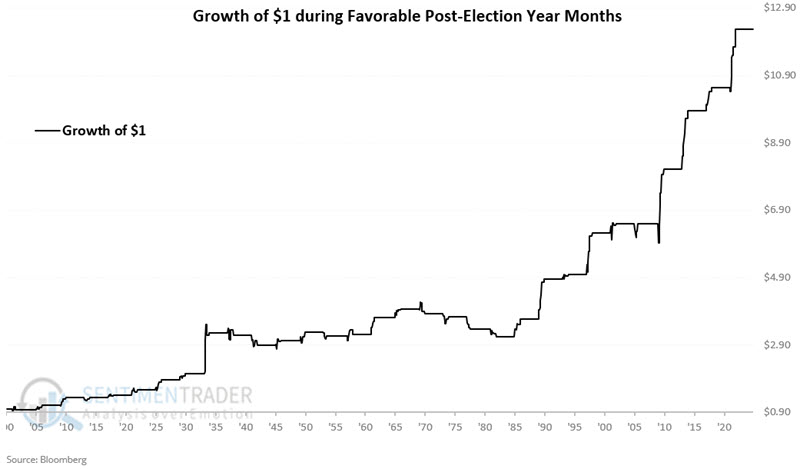
The chart below displays the hypothetical growth of $1 invested only during the favorable months of each post-election year.
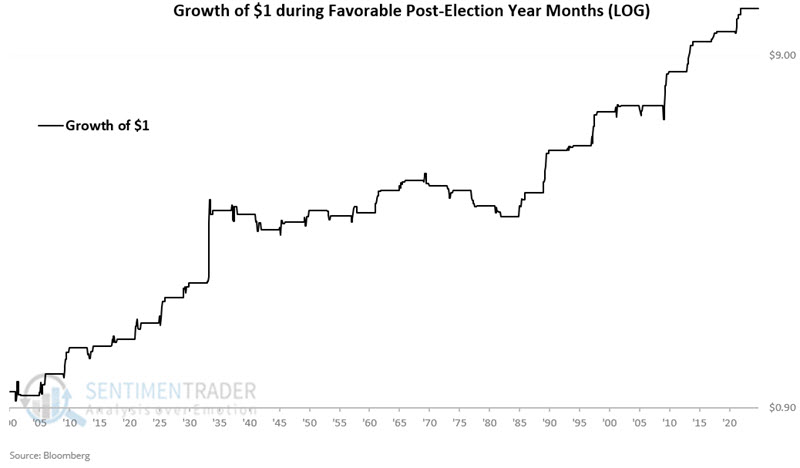
The chart below displays the same results using a logarithmic scale.
The chart below displays the hypothetical growth of $1 invested only during the unfavorable months of each post-election year.
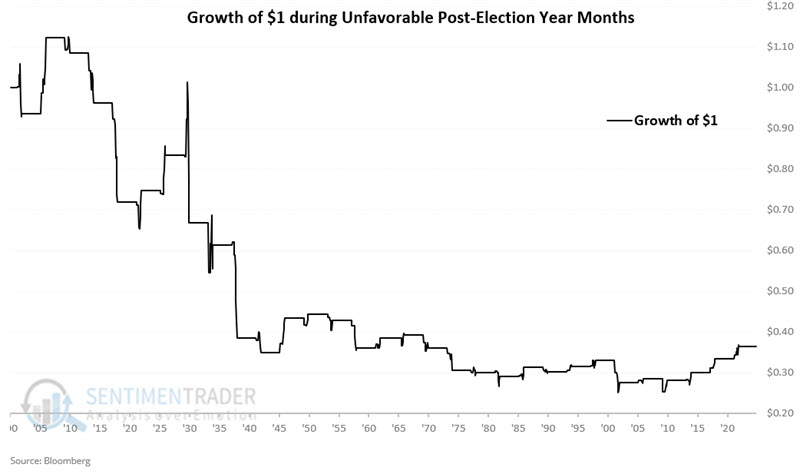
We can note that the last three post-election years saw unfavorable months deliver a cumulative gain for the year. But overall, long-term results have been less than stellar during unfavorable months.
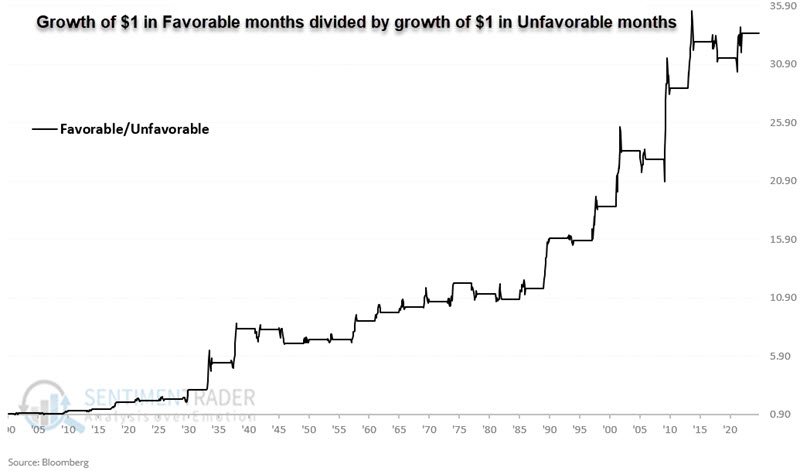
The chart below displays the growth of $1 invested only during the favorable months divided by the growth of $1 invested only during the unfavorable months.
Reviewing the results
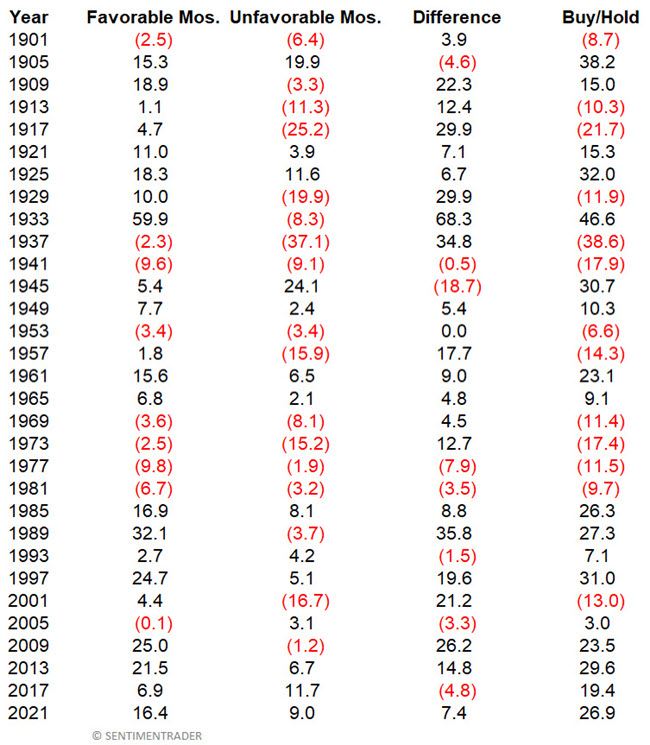
The table below displays post-election year results broken down by Favorable month performance versus Unfavorable month performance.
- The first column lists the post-election year
- The second column displays the cumulative stock market gain/loss achieved only during the six favorable months
- The third column displays the cumulative stock market gain/loss achieved only during the six unfavorable months
- The fourth column subtracts unfavorable month performance from favorable month performance
- The fifth column displays results for simply buying and holding the index for the entire year
The table below summarizes the results.
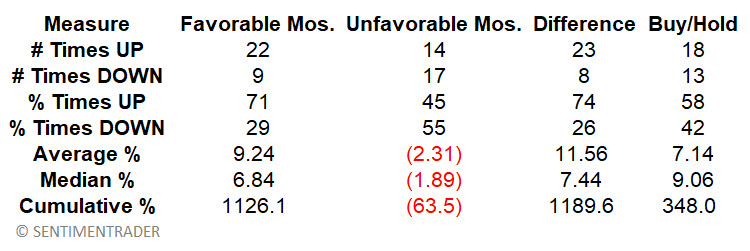
Note that favorable months showed a gain during 71% of post-election years. Unfavorable months showed a gain only 45% of the time and registered a net loss of -63.5%.
What the research tells us…
With a 58% annual win rate, post-election years can be categorized as moderately bullish. That nine of the last ten post-election years have seen a gain may raise concerns about the potential for a reversion to the mean (i.e., a down year). That said, investors are always encouraged to give the benefit of the doubt to the prevailing trend, and results can vary widely from year to year. Traders looking to maximize gains and potentially reduce risk and volatility might consider investing more heavily during the six favorable months highlighted above.