
A closer look at our Aggregate Signal Model

Key points
- Our Aggregate Signal Model gives favorable and unfavorable signals for the stock market based on all of our Trading/Models
- This model can be used as weight of the evidence or as a mechanical trading system (though there can be periods of frequent signals)
- In Part I, we review the standard approach to using this model; in Part II, we detail a longer-term version
The basic approach to using our Aggregate Signal Model
Our Aggregate Signal Model (ASM) is an aggregate buy/sell signal based on all our buy/sell signals.
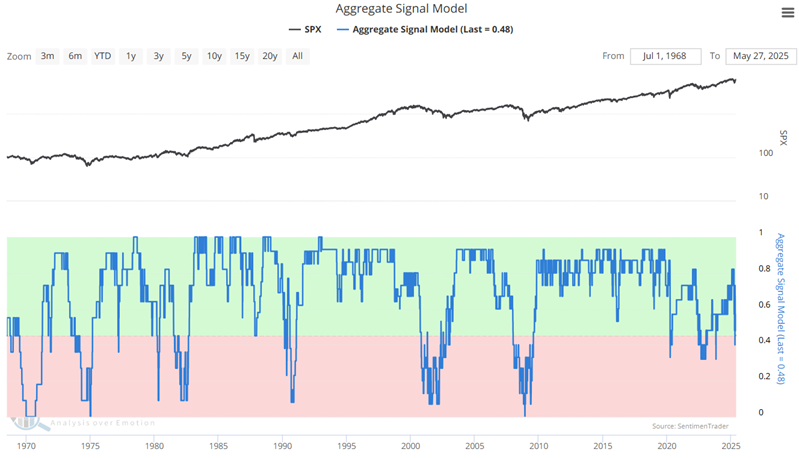
In the simplest form of this model, the idea is to be 100% long when the model reading is > 45% (0.45). The basic approach to evaluating the ASM is to consider it to be favorable when it is above 0.45 and unfavorable when it is below 0.45. The good news is that this approach has beaten the market handily over the past 57 years. The bad news is that there can be periods when the indicator flits above and below the 0.45 level frequently, thus generating a number of in and out trades in a short period of time. Not every investor is prepared (or disciplined enough) to adhere to such an approach. Nevertheless, the historical results make it worthy of consideration.
Note that we are not necessarily advocating that investors adopt the Aggregate Signal Model as a 100% in-the-market or 100% out-of-the-market trading system approach. However, for testing purposes, we will treat it as such here.
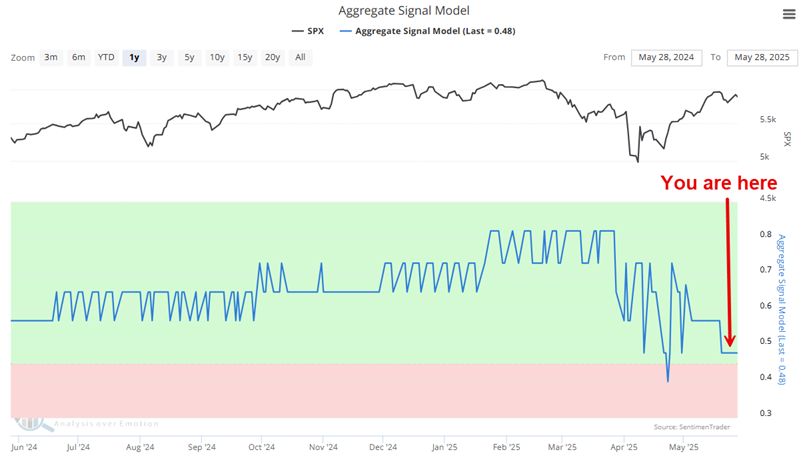
Note also that as this is written, the ASM stands at 0.48. So, a flip to "unfavorable" status could (but is not guaranteed to) occur at any time.
Our first test will assume that:
- A buy signal is triggered when ASM crosses above 0.45
- A sell signal is triggered when ASM crosses below 0.45
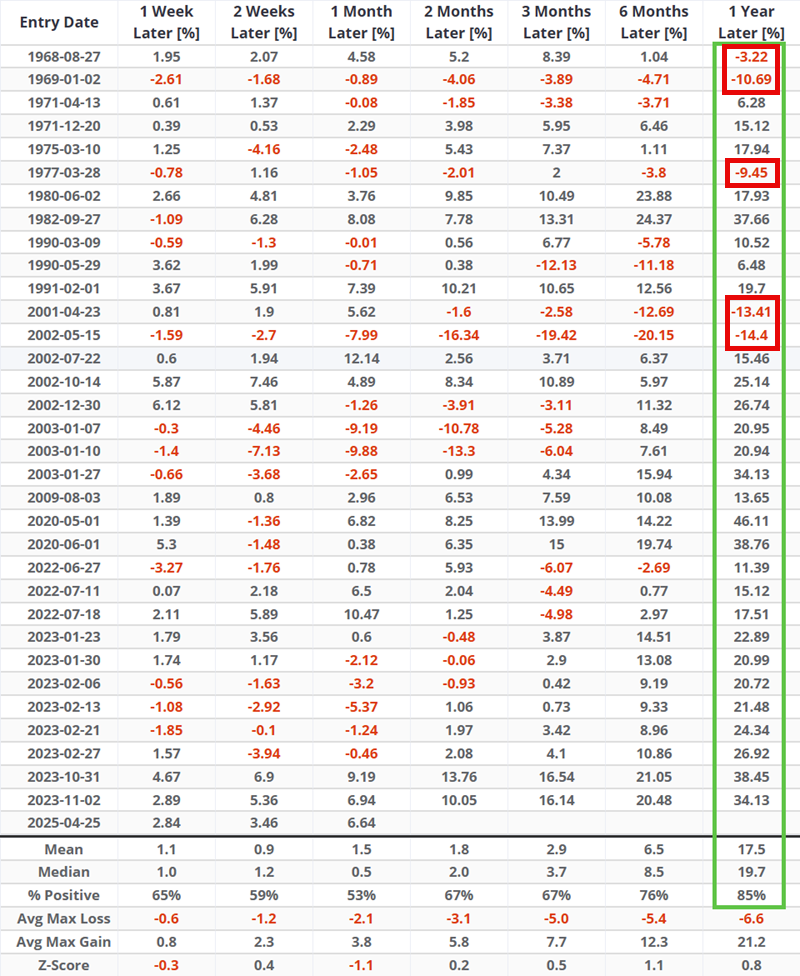
The hypothetical buy and sell signals since 1968 are highlighted in the chart below.
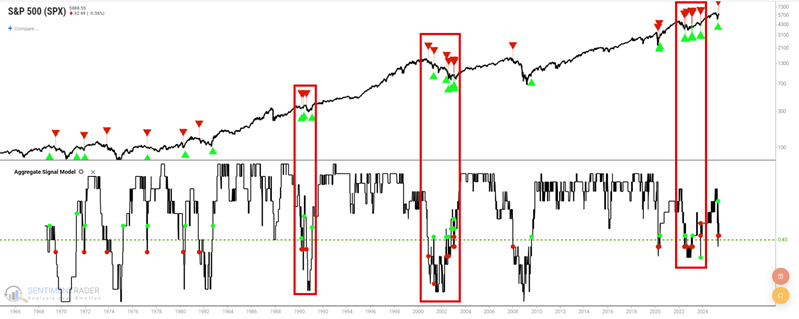
Note the significant number of signals in the three red boxes highlighted on the chart above. The relevant question for a trader is, "Would you keep taking the signals?" There may be enough benefit to doing so to justify occasional frequent trading.
The table below summarizes the results.
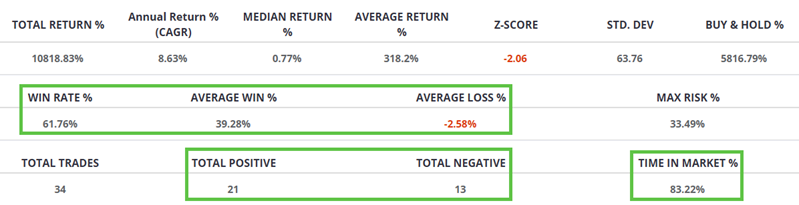
This strategy has made 34 round-turn trades since 1968, with a Win Rate of 61.76%, and was in the market 83% of the time. The most important thing to note is that the average win was 39.28%, and the average loss was only -2.58% (although the largest single losing trade was -9.29% with a maximum open loss of -12.45%).
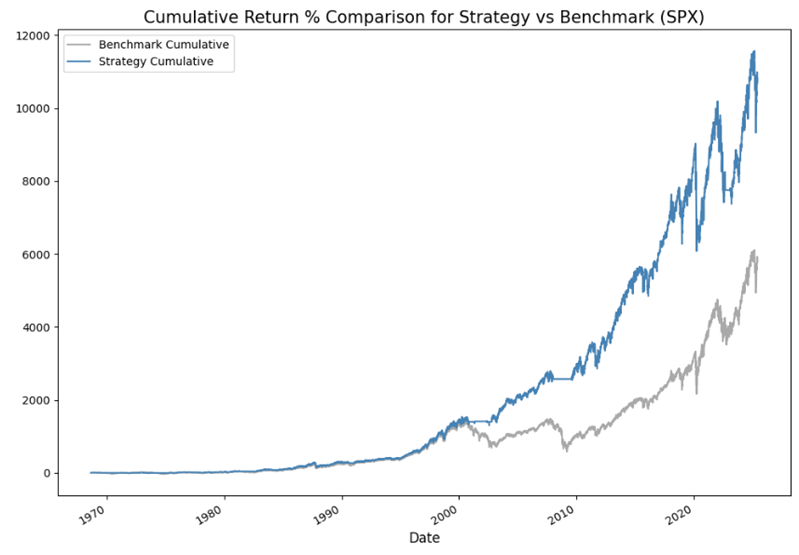
The chart below shows the hypothetical equity curve for the strategy (blue line) versus buy-and-hold (grey line). The strategy registered a hypothetical gain of 10,818% versus 5,817% for buy-and-hold.
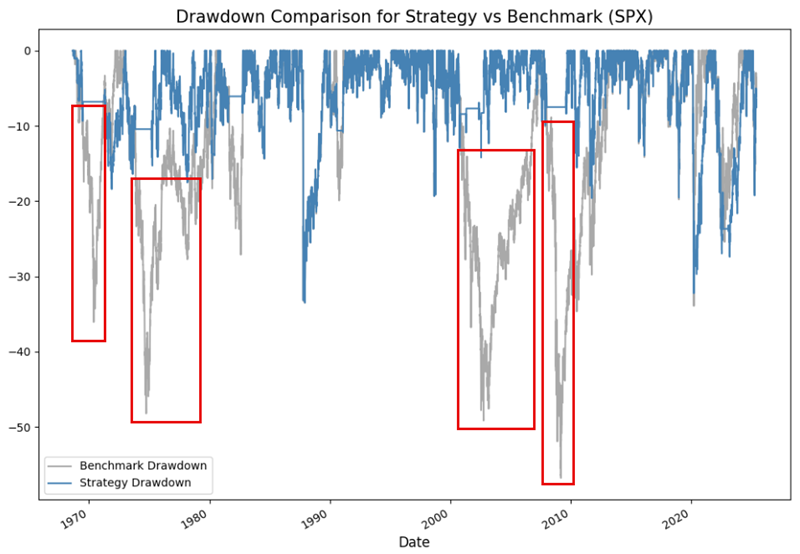
The key to any outperformance by the ASM is occasionally sidestepping portions of significant bear markets. The chart below displays the historical percentage drawdown for the strategy in blue and buy-and-hold in grey. Note that during the periods highlighted in the red boxes, a buy-and-hold investor would have experienced a far larger drawdown than an investor who hypothetically moved to cash when ASM turned unfavorable. These are the times when an investor is most likely to panic and dump their stocks at precisely the wrong time, and exactly the purpose of utilizing objective models such as our Aggregate Signal Model to reduce market exposure and risk occasionally.
The tables below highlight the hypothetical results of each "trade" generated by the ASM's signals.
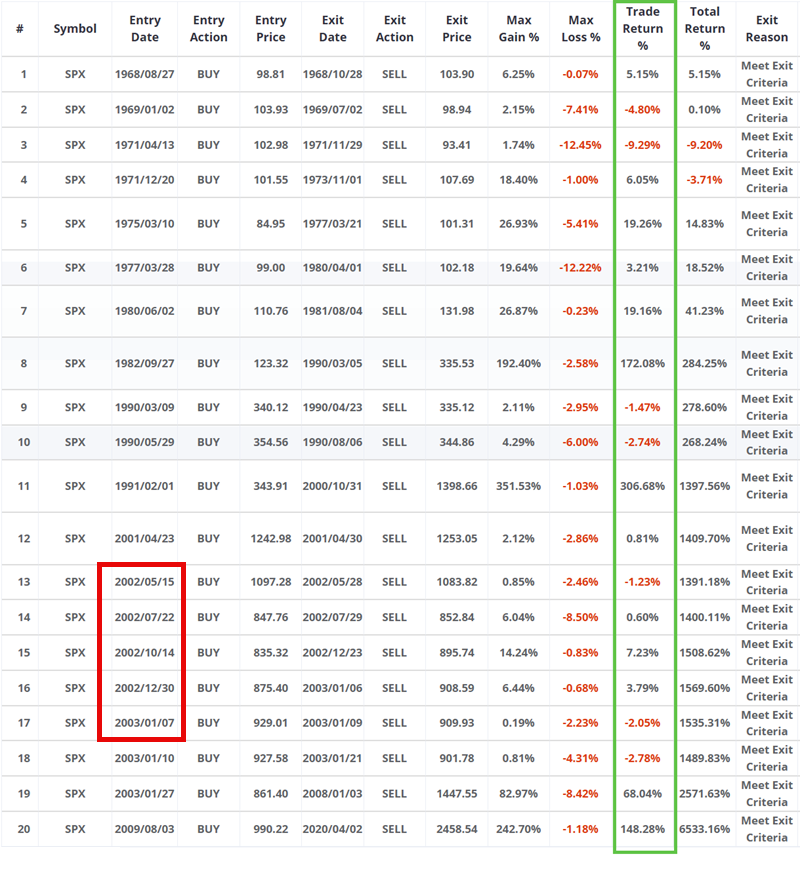
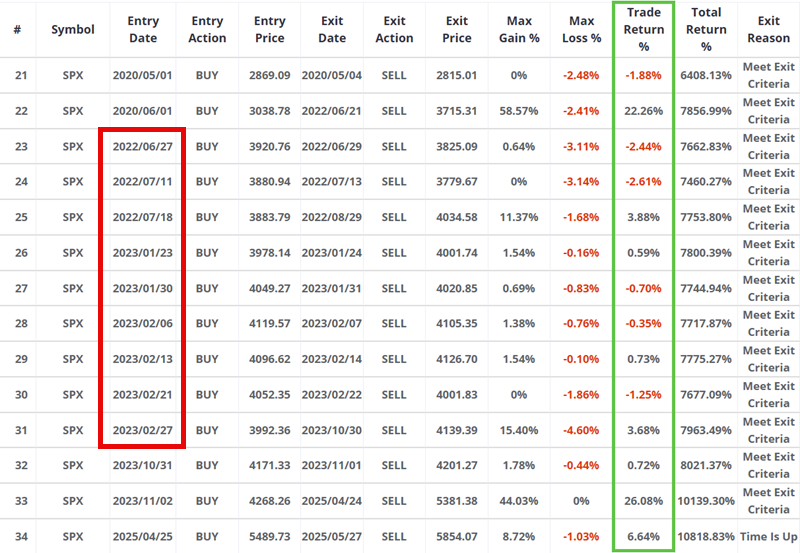
Note that the strategy made seven "trades" between May 2002 and January 2023 and nine between June 2022 and February 2023. This is an important consideration because not every investor is built to switch from 100% stocks to 100% and back on a short-term, repetitive basis. It is worth noting that since 1971, only three "buy" signals saw the S&P 500 decline over the next 12 months.
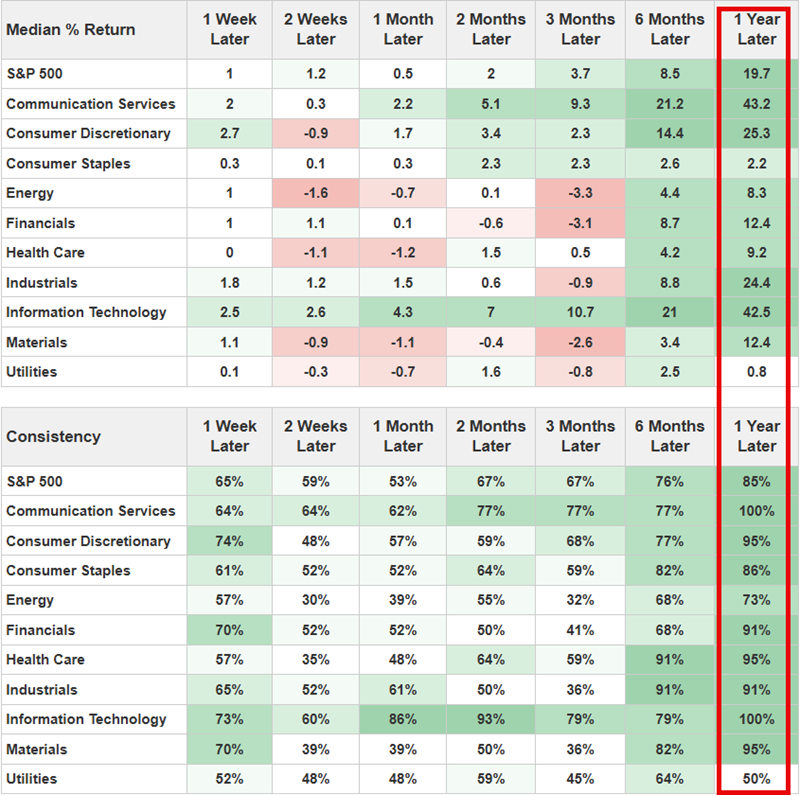
While the results above are all based on the S&P 500, another line of attack would be to focus on specific sectors following a buy signal. The table below displays some notably positive results one year after an ASM cross above 0.45 for Technology, Communications, Consumer Discretionary, and Industrials.
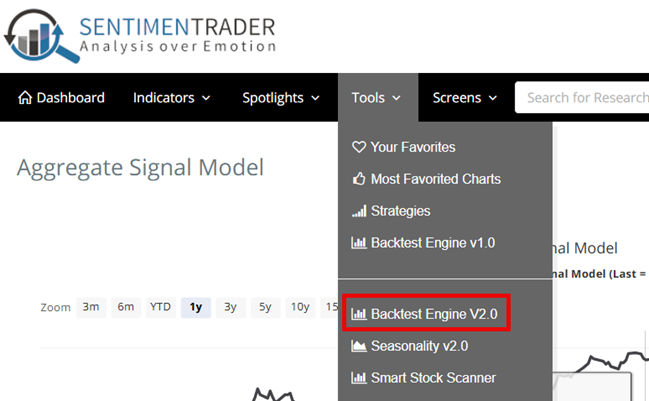
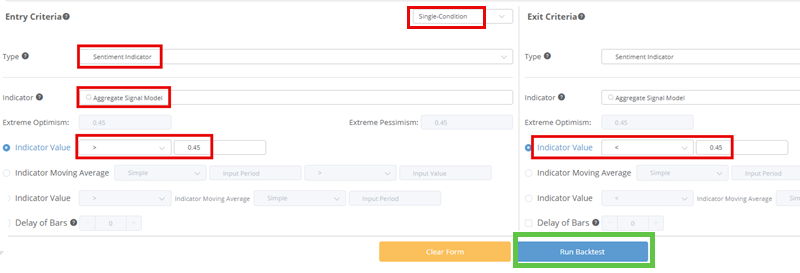
Setting up the test in Backtest Engine 2.0
To create this model in Backtest Engine 2.0, see the screenshots below. First select Backtest Engine 2.0.
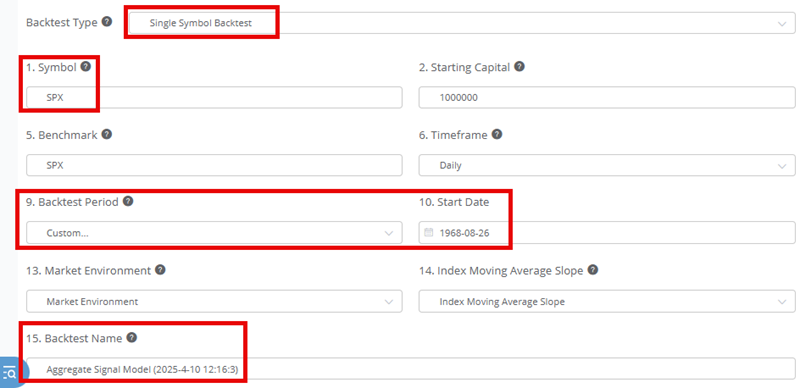
On the setup screen, select:
- Single Symbol Backtest
- Enter a Symbol (SPX is the default)
- Enter Backtest Start Date (we selected Custom and set date to the first date of data for ASM, which is 1968-08-26
- Give the Backtest a Name (you can call it whatever you want)
Enter the Entry and Exit criteria, then click "Run Backtest":
What the research tells us…
As with virtually all indicators and models, we view the Aggregate Signal Model as weight of the evidence and not as an automatic trading system. That said, as we have seen above, the model can be used in a systematic fashion by investors who can handle and trade through a series of relatively frequent trading signals. Part II will detail a longer-term approach to using the Aggregate Signal Model that involves less frequent signals.