
A closer look at our Aggregate Risk Model - Part II

Key points
- Our Aggregate Signal Model gives favorable and unfavorable signals for the stock market based on all of our Trading/Models
- This model can be used as weight of the evidence or as a mechanical trading system for a portion of one's investment capital
- In Part I, we reviewed the standard approach to using this model; in Part II, we detail a longer-term version
A longer-term approach to using our Aggregate Signal Model
Our Aggregate Signal Model (ASM) is an aggregate buy/sell signal based on all our buy/sell signals.
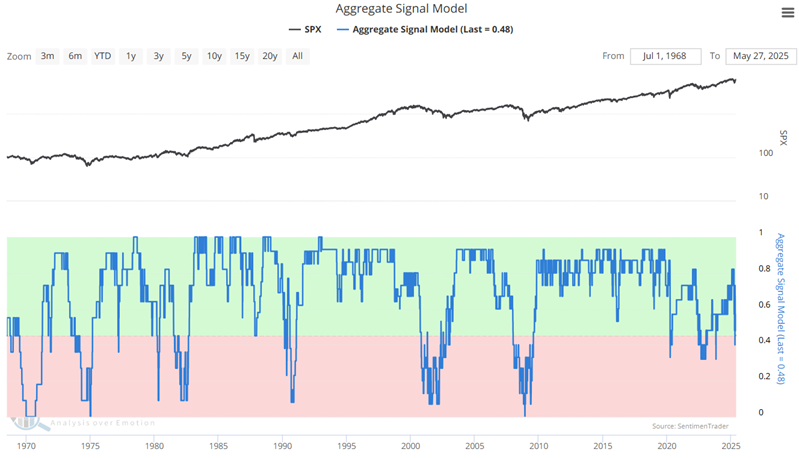
In Part I, we detailed the simplest form of this model. The idea is to be 100% long when the model reading is > 45% (0.45). The basic approach to evaluating the ASM is to consider it to be favorable when it is above 0.45 and unfavorable when it is below 0.45.
The test in Part I assumed that:
- A buy signal is triggered when ASM crosses above 0.45
- A sell signal is triggered when ASM crosses below 0.45
The hypothetical buy and sell signals using this standard approach since 1968 are highlighted in the chart below.
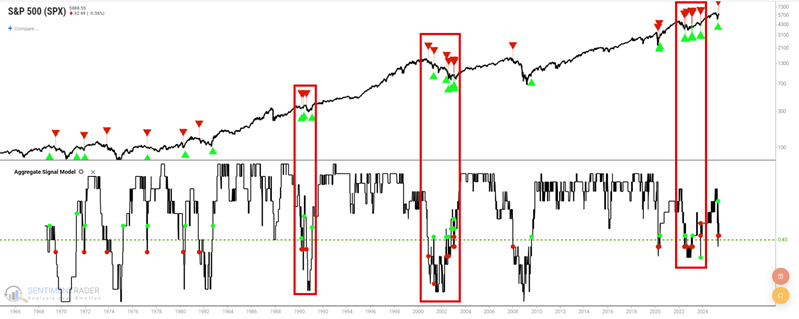
Note the significant number of signals in the three red boxes highlighted on the chart above. The problem is that not every investor is built to trade in and out of a portfolio frequently. So for Part II, we will go in the other direction. Some investors always remain fully invested based on the assumption that "you can't time the market." The problem with the "always fully invested" approach is that you ride every bear market to the bottom fully invested. About the time losses reach -30% or more, many investors panic, dump their stocks, watch the market reverse, and cannot bring themselves to get back in until the market has advanced significantly higher than where they sold (same as it ever was).
The approach we will detail here is intended to be something of a "happy medium." It is geared toward investors who would prefer to put their money in the market and leave it there, but who do not want to ride out every bear market and would be willing to occasionally "play some defense."
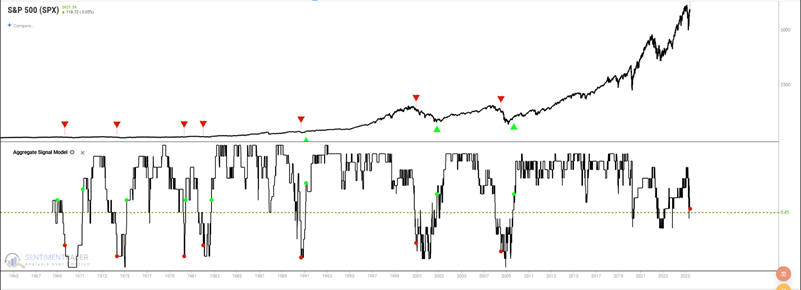
So the test here will assume that:
- A buy signal is triggered when ASM crosses above 0.545
- A sell signal is triggered when ASM crosses below 0.21
By definition, because the trigger levels are wider, there will be fewer signals.
Longer-term approach results
The hypothetical buy and sell signals since 1968 are highlighted in the chart below. There are few signals, and none since the buy signal in 2009.
The table below summarizes the results.
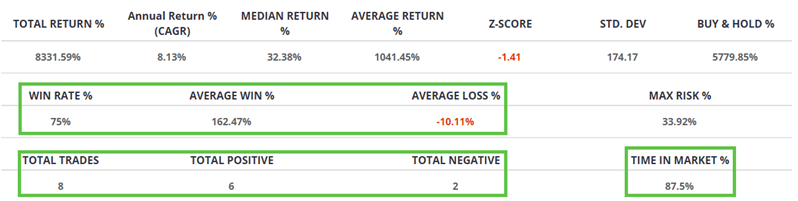
This strategy has made only eight round-turn trades since 1968, with a Win Rate of 75%, and was in the market 87.5% of the time. The average winning trade gained 162%, and the average loss was -10 %.
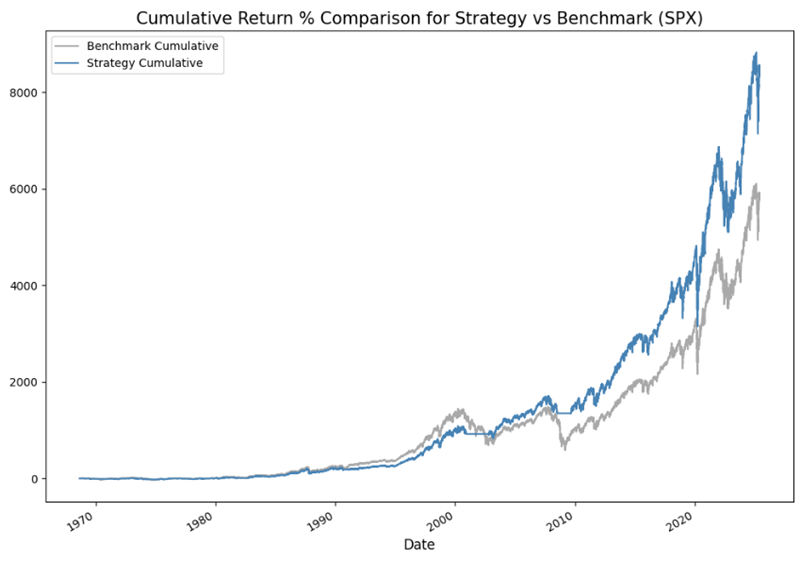
The chart below shows the hypothetical equity curve for the strategy (blue line) versus buy-and-hold (grey line). The strategy registered a hypothetical gain of 8,331% versus 5,817% for buy-and-hold.
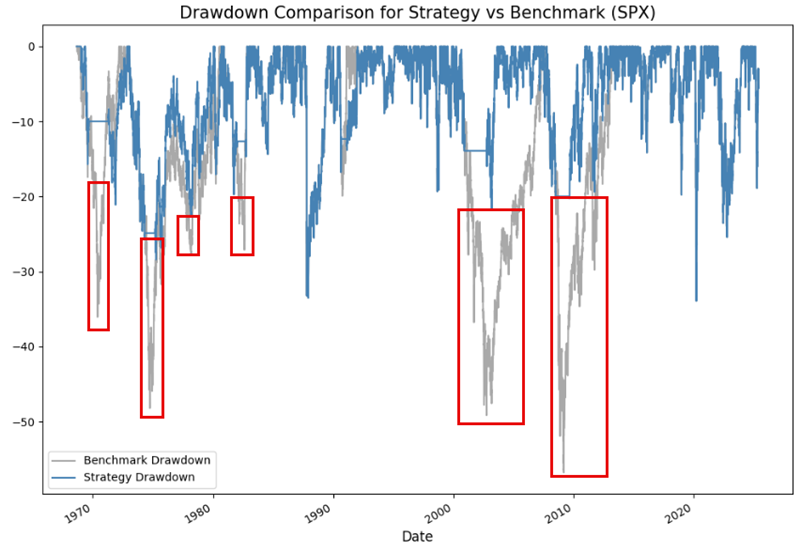
The key to any outperformance by the ASM is occasionally sidestepping portions of significant bear markets. The chart below displays the historical percentage drawdown for the strategy in blue and buy-and-hold in grey. Note that during the periods highlighted in the red boxes, a buy-and-hold investor would have experienced a far larger drawdown than an investor who hypothetically moved to cash when ASM turned unfavorable. These are the times when an investor is most likely to panic and dump their stocks at precisely the wrong time, and exactly the purpose of utilizing objective models such as our Aggregate Signal Model to reduce market exposure and risk occasionally.
The table below highlights the hypothetical results of each "trade" generated by the ASM's signals.
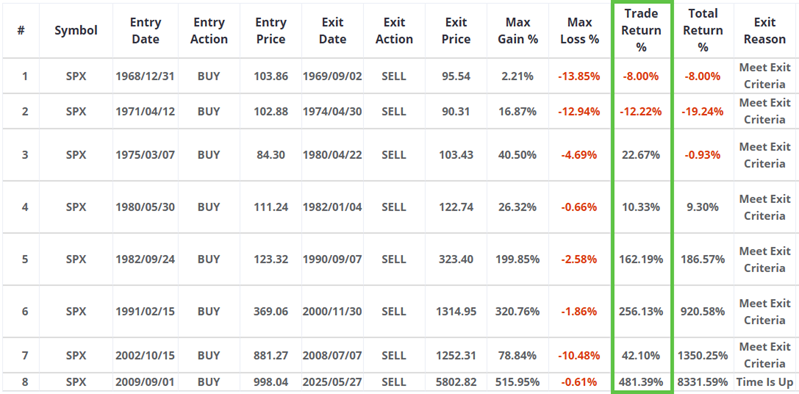
Note that this version of the ASM rules has not generated a trade since the entry signal on 2009-09-01. Is this a good thing? Is this a bad thing? That's up to each individual investor to decide. But it might make sense for "the investor who would prefer to put their money in the market and leave it there, BUT do not want to simply ride out every bear market."
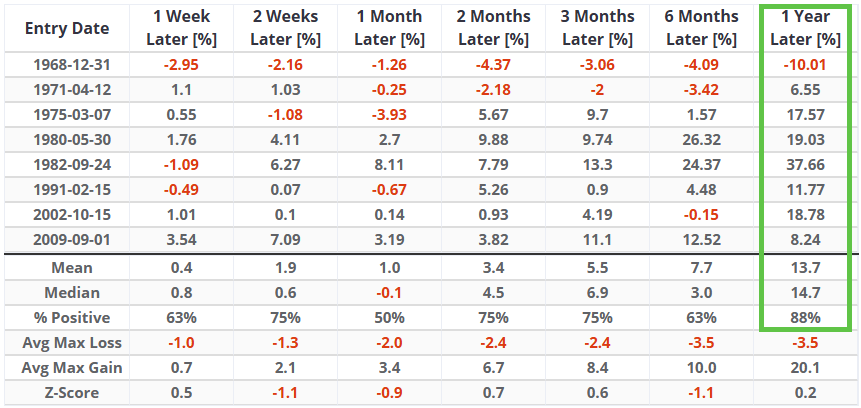
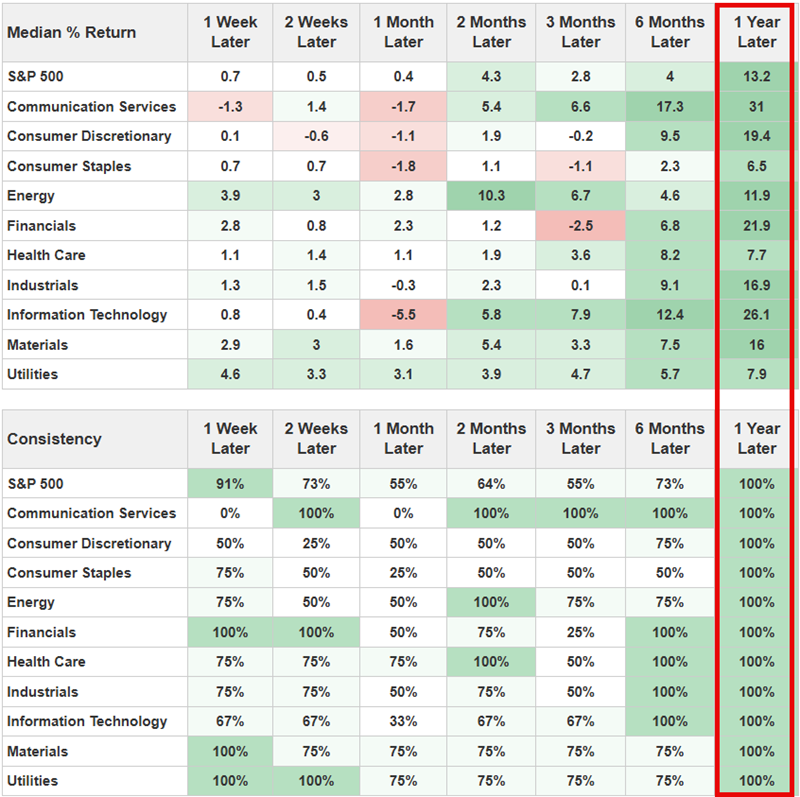
The table below displays SPX performance during the 12 months after each previous buy signal.
While the results above are all based on the S&P 500, another line of attack would be to focus on specific sectors following a buy signal. The most compelling item in the table below is the 100% 1-Year Later Win Rate for all S&P 500 sectors. In terms of overall performance, Technology, Financials, and Consumer Discretionary have been the top performers in the first year after a new buy signal.
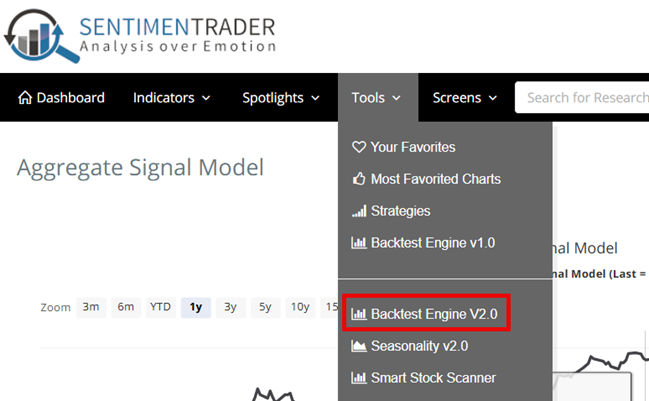
Setting up the test in Backtest Engine 2.0
Please take a look at the screenshots below to see how to create this model in Backtest Engine 2.0. First, select Backtest Engine 2.0.
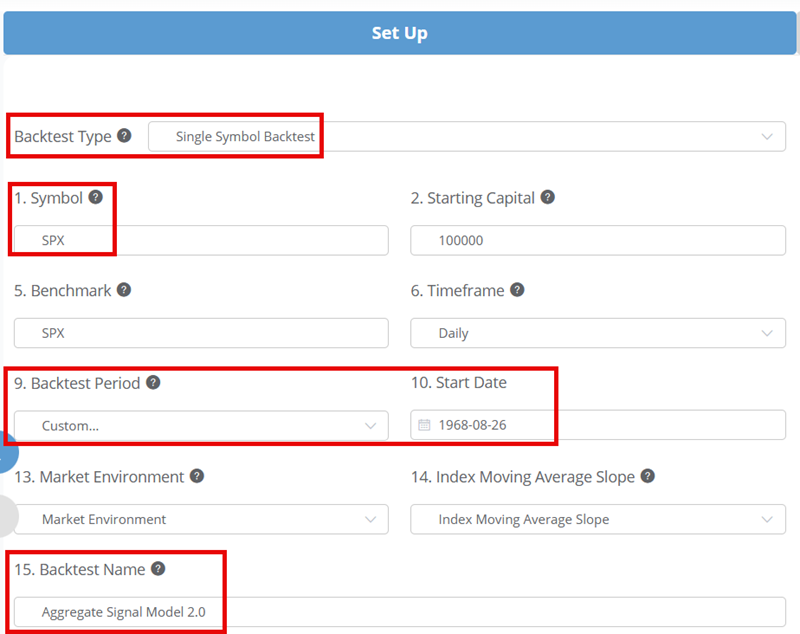
On the setup screen, select:
- Single Symbol Backtest
- Enter a Symbol (SPX is the default)
- Enter Backtest Start Date (we selected Custom and set date to the first date of data for ASM, which is 1968-08-26
- Give the Backtest a Name (you can call it whatever you want)
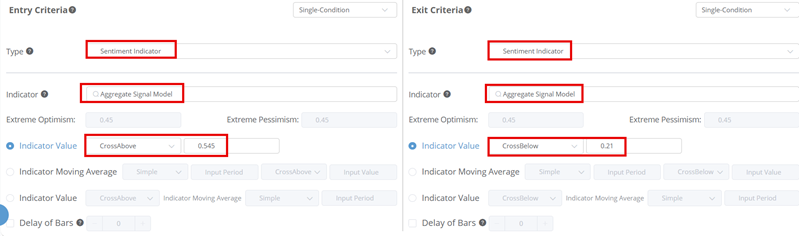
Enter the Entry and Exit criteria, then click "Run Backtest":
What the research tells us…
As with virtually all indicators and models, we view the Aggregate Signal Model as weight of the evidence and not as an automatic trading system. That said, both versions of the Aggregate Signal Model that we have presented have the potential to help investors quantify the current market outlook as favorable or unfavorable