Products
SentimenTrader Trading Tools
‍
Backtest Engine
My Trading Toolkit
Correlation Analysis
Seasonality
Market Prediction
Indicators & Data API
‍
Proprietary Indicators & Charts
Market Data API
Strategies & Scanner
‍
50+ Trading Strategies
Smart Stock Scanner
Smart Option Scanner
Research Reports
‍
Research Solutions
Reports Library
Free Resources
Simple Backtest Calculator
Simple Seasonality Calculator
The Kelly Criterion Calculator
Sentiment Geo Map
Public Research Reports
Education
Sentiment Indicators
Technical Indicators
Pricing
Company
About
In the News
Testimonials
Client Success Stories
Contact
Log inLoginSign up
< BACK TO ALL REPORTS

A Closer Look at December in Post-Election Years

Jay Kaeppel
2025-12-01
How will the stock market perform in December 2025? No one can predict for sure. That said, the historical performance of stocks during December of previous post-election years gives investors reason to be optimistic.

Key Points:

  • December has historically been one of the best-performing months for stocks
  • December of Post-Election years has seen particularly favorable stock market action
  • Below, we examine Dow Jones Industrial performance during December of Post-Election years since 1901

Establishing the baseline

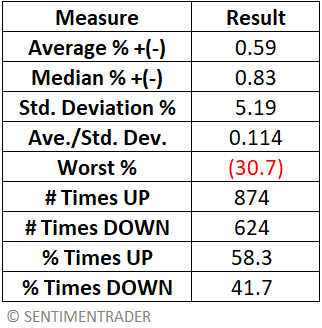
In this piece, we will take a close look at stock market performance during December of Post-Election years in the United States. Let's first establish a baseline of comparison by looking at the performance for "all months" starting in 1901. For testing, we will use the monthly closing price of the Dow Jones Industrial Average from January 1901 through October 2025. The table below displays a monthly performance summary for all 1,498 months included in the test period.

Now, let's see if there is any appreciable difference in market performance during December of Post-Election years versus the "average" month performance highlighted above.

Dow performance during December of Post-Election Years

For our test, we are using month-end price data for the Dow Jones Industrial Average, as we have data available dating back to 1900. We will examine Dow performance from December 1901, 1905, 1909, and every subsequent fourth year through 2021. December of 2025 is the next year in this sequence.

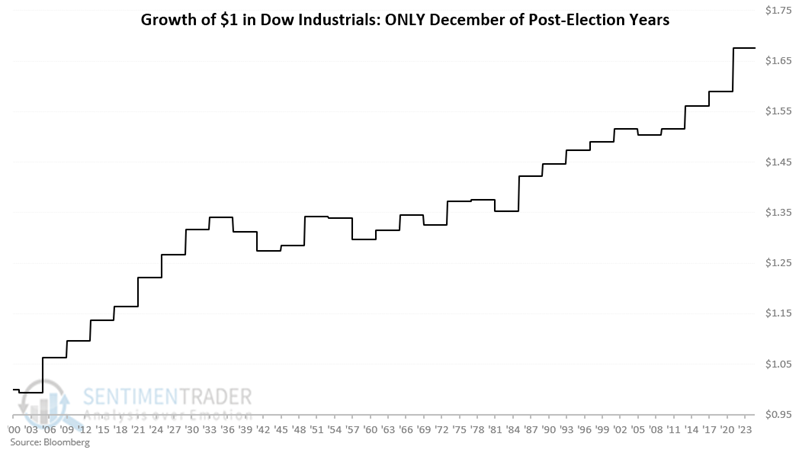
 The chart below displays the growth of $1 invested in the Dow only during December of each post-election year starting in 1901.

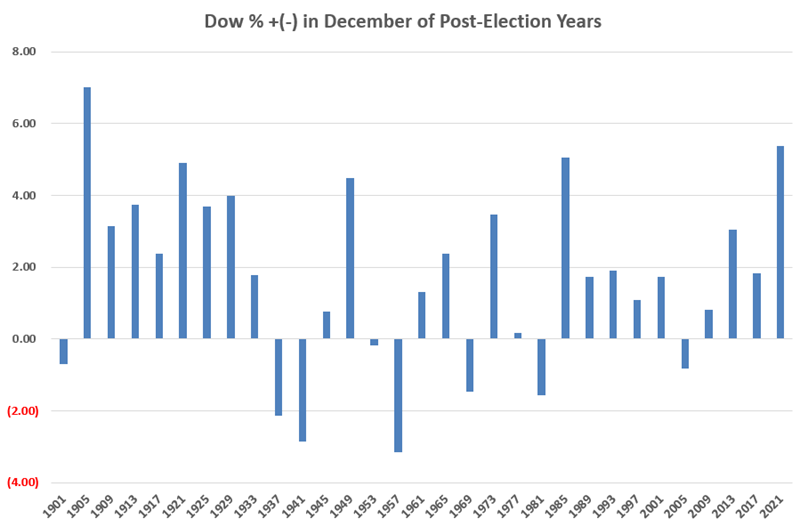
The chart below displays the performance of December of each post-election year since 1901.

The table below displays a summary of monthly performance for all 30 post-election Decembers since 1901 compared to the baseline results for all months starting in 1901.

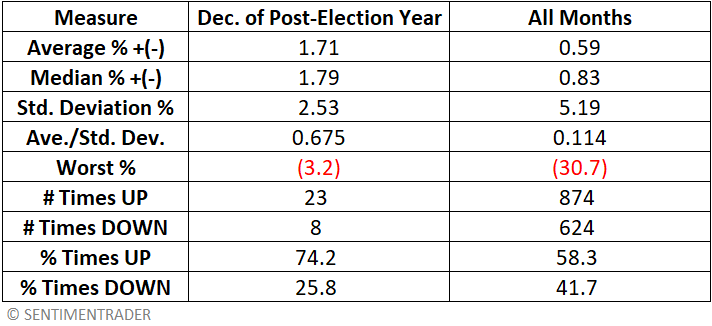
Things to note regarding December of post-election years versus all months since 1901:

  • A higher Win Rate (74.2% versus 58.3%)
  • Average and Median monthly returns are over two times greater than the average of All Months
  • A lower standard deviation and significantly higher risk-adjusted returns (Ave./Std. Dev.)
  • A "worst" monthly loss of just -3.2%

What the research tells us…

December of the post-election year has a solid history. That said, a 74% Win Rate - while well above average - is by no means a "sure thing." Essentially, once every sixteen years  (i.e., one out of every four post-election years), December will show a loss during a post-election year. The good news is that the worst previous loss during a post-election December was a manageable -3.2%. The bad news is that there is no reason this amount couldn't be exceeded in the future. All in all, the historical results suggest that investors and traders give the bullish case for stocks the benefit of the doubt during December 2025.

PRODUCTS
SentimenTrader
Trading Tools
Indicators & Data API
‍
Strategies & Scanner
‍
Research Reports
FREE
RESOUrCES
Simple Backtest
Calculator
Simple Seasonality
Calculator
The Kelly Criterion
Calculator
Sentiment Geo Map
‍
Public Research Reports
‍
Education
Sentiment Indicators
‍
Technical Indicators
‍
Pricing
Bundle pricing
‍
FAQ
‍
Announcements
‍
COMPANY
‍
About
‍
In the News
‍
Testimonials
‍
Client Success Stories
CONTACT
‍
General Inquiries
‍
Media Inquiries
‍
Financial Professionals Inquiries
‍
© 2026 Sundial Capital Research Inc. All rights reserved.
Setsail Marketing
TermsPrivacyAffiliate Program
Risk Disclosure: The information and tools provided are for research and analytical purposes only and are not intended as investment advice. Market analysis involves uncertainty, and outcomes may differ from expectations. Users should conduct their own due diligence and consider their individual circumstances before making any financial decisions. Past performance is not necessarily indicative of future results.

Hypothetical Performance Disclosure: Hypothetical performance results have many inherent limitations, some of which are described below. No representation is being made that any account will or is likely to achieve profits or losses similar to those shown; in fact, there are frequently sharp differences between hypothetical performance results and the actual results subsequently achieved by any particular trading program. One of the limitations of hypothetical performance results is that they are generally prepared with the benefit of hindsight. In addition, hypothetical trading does not involve financial risk, and no hypothetical trading record can completely account for the impact of financial risk of actual trading. for example, the ability to withstand losses or to adhere to a particular trading program in spite of trading losses are material points which can also adversely affect actual trading results. There are numerous other factors related to the markets in general or to the implementation of any specific trading program which cannot be fully accounted for in the preparation of hypothetical performance results and all which can adversely affect trading results.

Testimonial Disclosure: Testimonials appearing on this website may not be representative of other clients or customers and is not a guarantee of future performance or success.