
A challenging global investment landscape

Key points:
- The percentage of country ETFs with a positive relative trend score versus the S&P 500 fell to a multi-year low
- Similar relative trend conditions suggest a cautious outlook for the MSCI World ex USA Index
- The S&P 500 tended to outperform the MSCI World ex USA Index, but returns were lackluster
It's the S&P 500 and not much else
Last week, I highlighted a historic breadth thrust alert for the Nikkei 225, which displayed bullish implications for the Japanese bellwether index. While the price action in Japanese stocks looks constructive, one can't make the same case for most country indexes around the globe compared to the S&P 500.
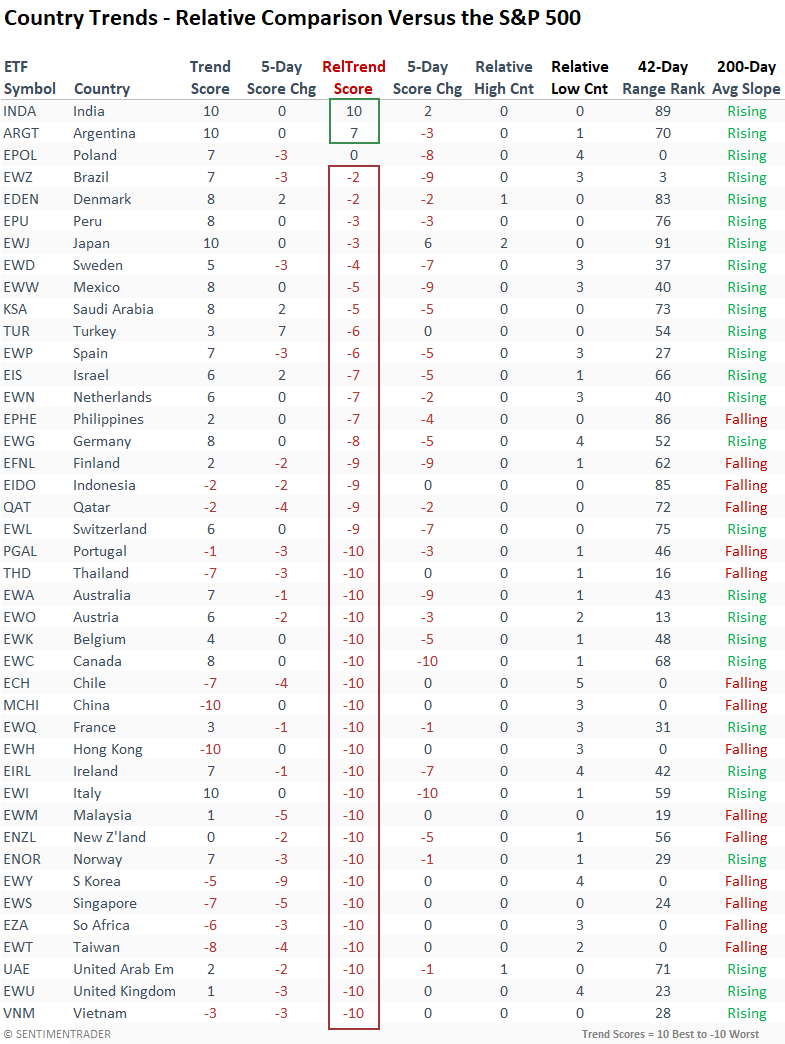
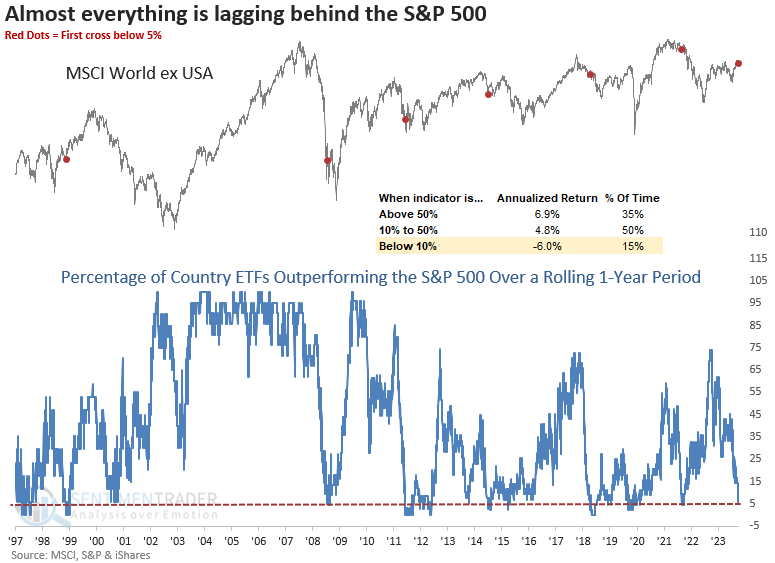
On Tuesday, the percentage of global indexes with a positive relative trend score versus the S&P 500 fell to fewer than 5% of country ETFs, reaching the lowest value since December 2021.
India and Argentina remain the only ETFs with a positive relative trend score compared to the S&P 500. While most countries show downward revisions in relative trend scores, Poland, Brazil, Mexico, Finland, Australia, Canada, and Italy were significant. And one-month relative lows overwhelmingly outnumbered relative highs across the globe.
Global indexes are struggling to keep up with the S&P 500
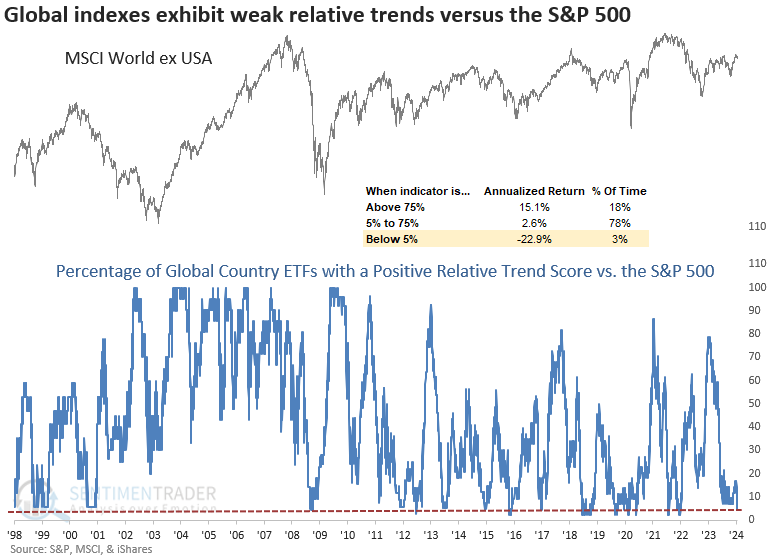
With the percentage of country ETFs maintaining a positive relative trend score falling to one of the lowest levels in history, investors should remember that negative relative trends, like now, can often foreshadow weak absolute performance, as exhibited by the -22.95 annualized return for the MSCI World ex USA Index.
Similar relative trend conditions suggest a negative to muted outlook
When I utilize a cross-below-threshold methodology to assess the outlook for the MSCI World ex USA Index, the analysis suggests a negative near-term outlook followed by muted returns over a median-term horizon. The unfavorable win rate and median return over the following year demonstrate that the signal tends to manifest during prolonged corrections and bear markets. 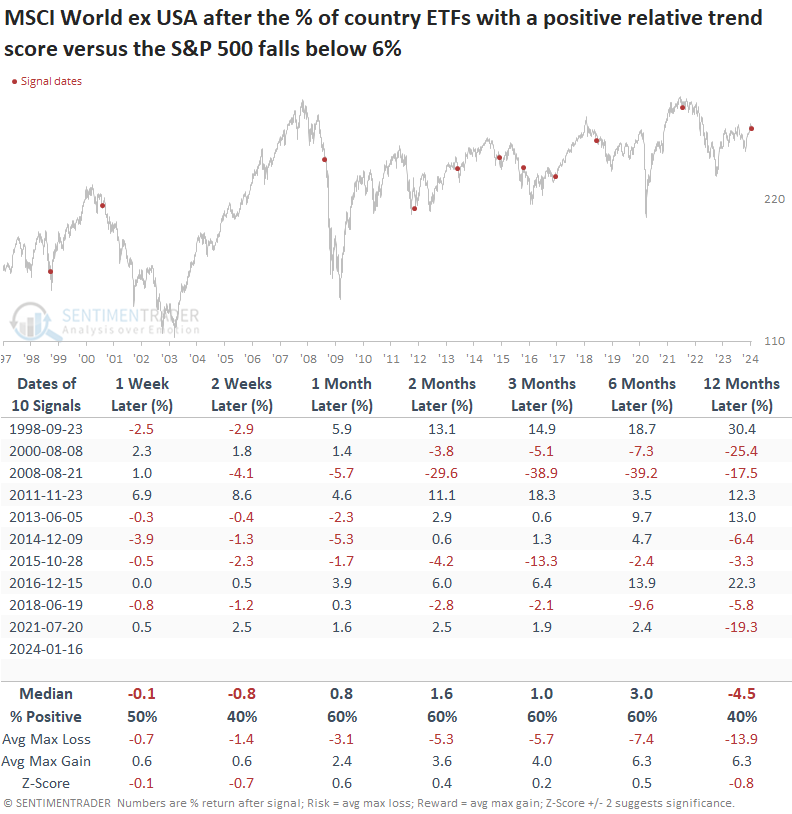
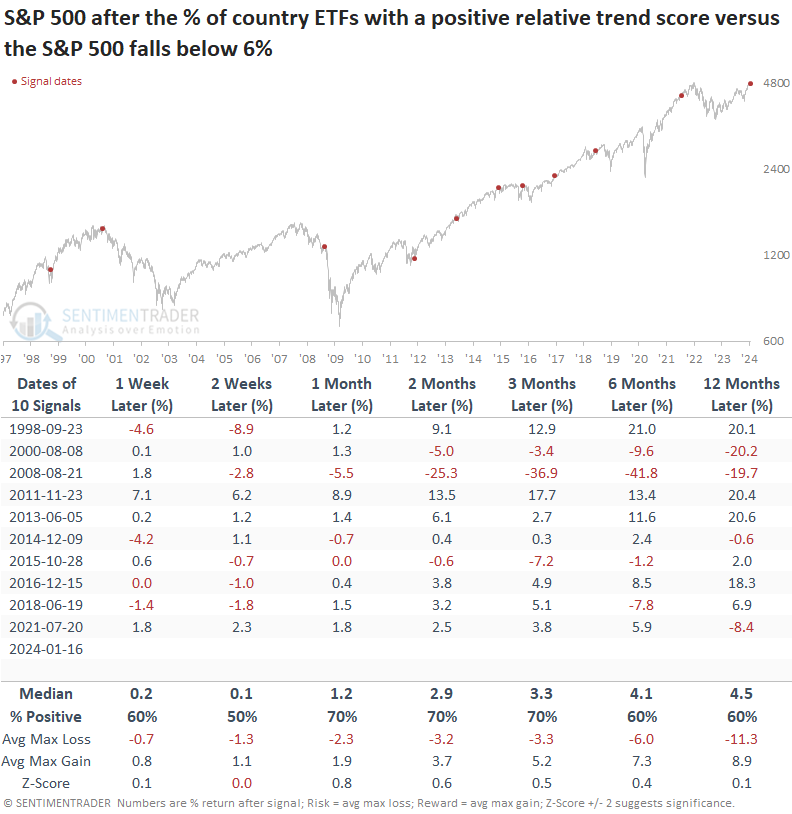
While the S&P 500 shows more favorable returns and win rates than the global benchmark, the z-score reveals lackluster performance compared to any random time. So, we must be mindful that when relative trends around the globe deteriorate, like now, passive investors could experience muted returns.
The percentage of country ETFs outperforming the S&P 500 over a rolling one-year period recently declined below 10%, indicating the dominance of the world's most benchmarked index compared to everything else. Similar conditions produced negative annualized returns for the MSCI World ex USA Index.
Do domestic relative trends confirm the global message?
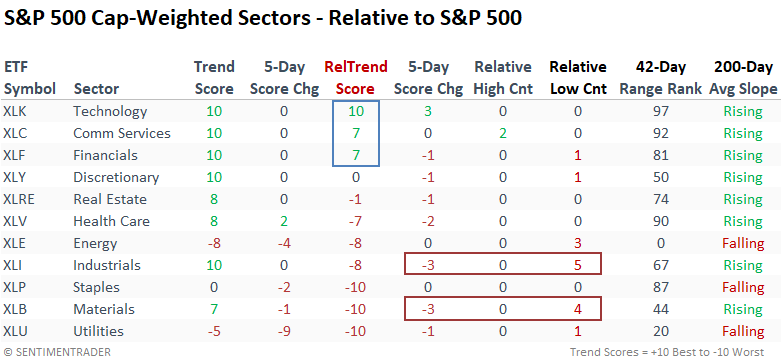
Because country ETF weightings heavily favor value-oriented stocks, let's review sector and industry trends to see if the deterioration in the global landscape is being confirmed domestically.
While Financials remain healthy, relative trend scores for Industrials and Materials have recently fallen, with both groups registering an abundance of relative lows over the past week.
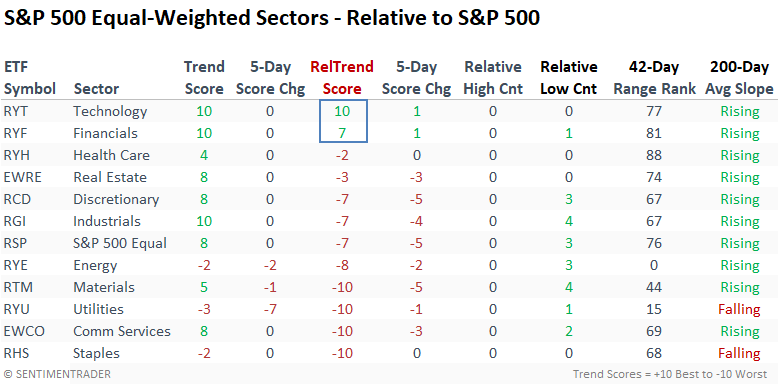
Similar to the cap-weighted trends, Financials are the only value-based group to maintain a positive relative trend score compared to the S&P 500. The noticeable downshift in relative scores for equal-weighted sectors is a concern, as the significant market surge in Q4 2023 suggested a broadening in participation.
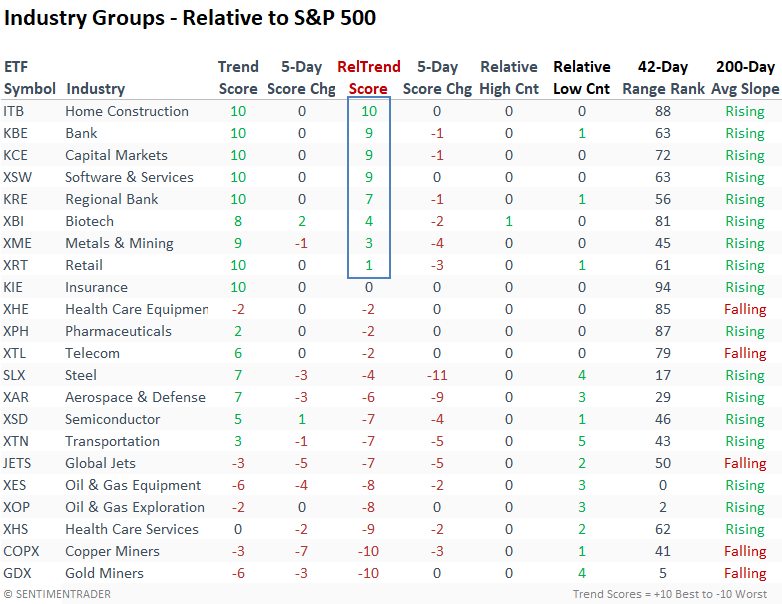
Industry rankings provide a similar message; outside of growth, it's predominantly Financials and Home Construction exhibiting positive relative trends.
What the research tells us...
The percentage of country ETFs with a positive relative trend score has fallen to a multi-year low, indicating broad underperformance by global indexes compared to the S&P 500. Similar relative trend conditions often foreshadow an unfavorable outlook for the MSCI World ex USA Index. When the world catches a cold, it tends to impact the S&P 500, with the world's most benchmarked index displaying lackluster returns. With global indexes in the penalty box, value-oriented sectors could struggle.