
A case for lower gas prices

Key Points
- Inflation and/or geopolitics/war may keep gasoline prices elevated
- But gasoline prices have demonstrated a clear tendency to rise during the first part of the year and to decline during the second half
- Crude oil term structure also gave an important signal that most traders are not aware of
The price of gas
The chart below displays retail gas prices since 1991 as reported by the U.S. Retail Automotive Gasoline Total Regular Average spot price, sourced from the U.S. Department of Energy. The recent surge to all-time highs is plain to see.
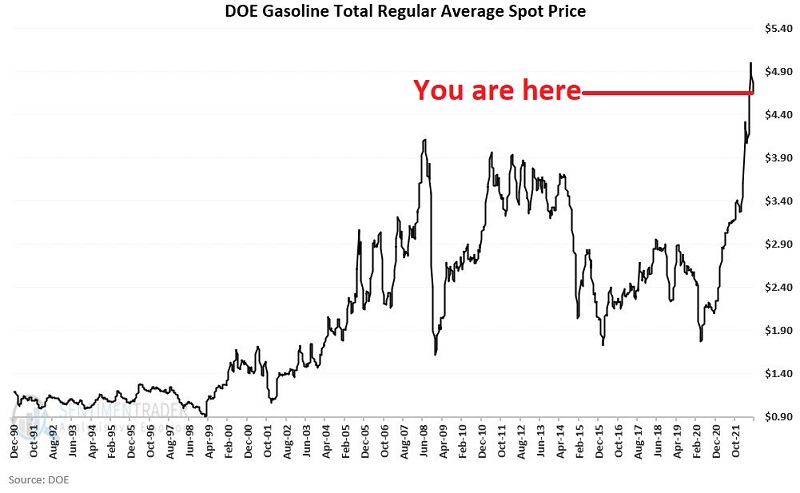
At first blush, price movement appears to be pretty random. However, if we dig a little deeper, it turns out there is a great deal of cyclicality.
Unleaded gas futures seasonality
The chart below displays the annual seasonal trend for Unleaded Gas futures.
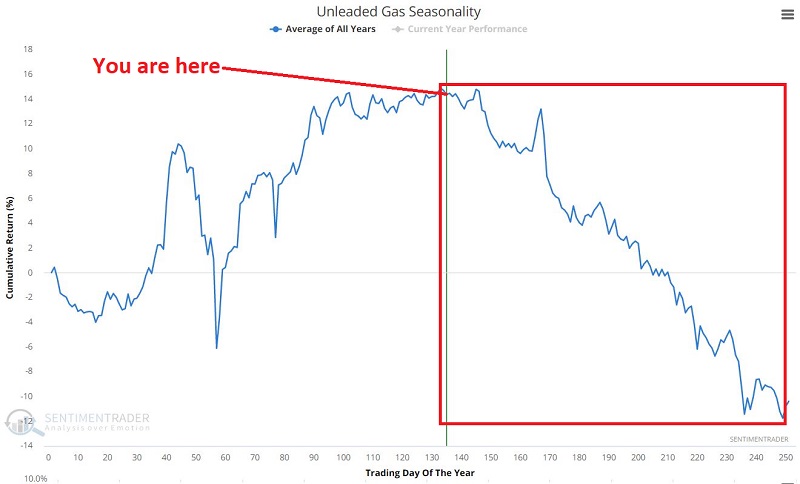
Does anything jump out at you in the chart above? If your vision is even remotely functional, you likely picked up on the significant weakness that tends to occur in the year's second half.
This raises an interesting question: "Does this cyclicality in the futures market translate to the price at the pump?" Unsurprisingly, there is a high degree of correlation (roughly 97%) between unleaded gas futures prices and the gas price at the pump.
Seasonal fluctuations in the price of gas
The gas price data series comes out each Monday. So, we will break the calendar year into two periods:
- The bearish period begins on the 2nd Monday of July and extends for 24 weeks
- The bullish period begins where the bearish period ends and extends through the 2nd Monday of July
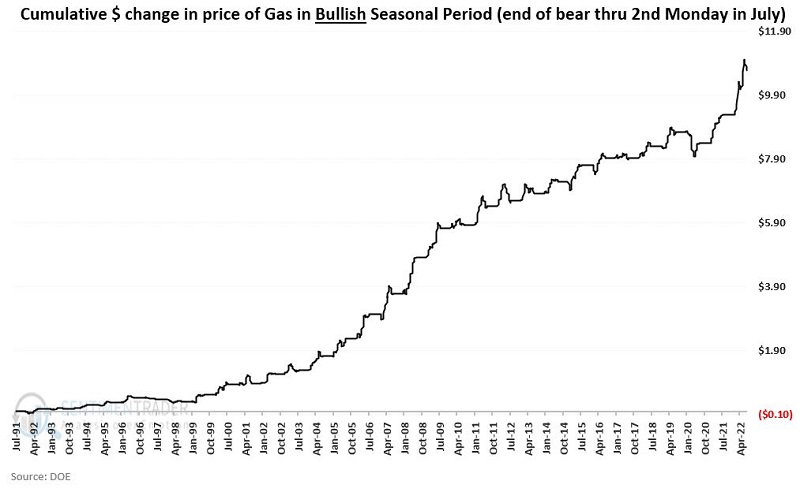
Bullish seasonal period
The bullish period begins where the bearish period ends 24 weeks after the 2nd Monday in July (typically in late December) and extends through the next 2nd Monday of July. The chart below displays the cumulative dollars and cents change in the price of gasoline only during the bullish period starting In July 1991.
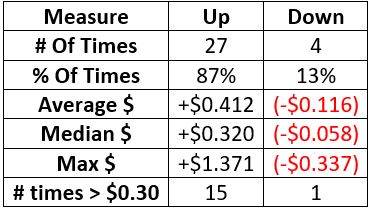
The table below summarizes gasoline price performance during bullish seasonal periods.
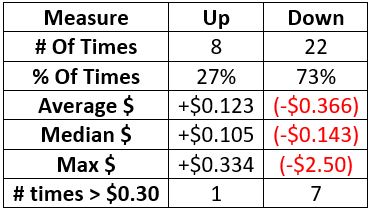
Bearish seasonal period
The bearish period begins after the 2nd Monday of July and lasts 24 weeks. The chart below displays the cumulative dollars and cents change in the price of gasoline only during the bearish period starting In July 1991.
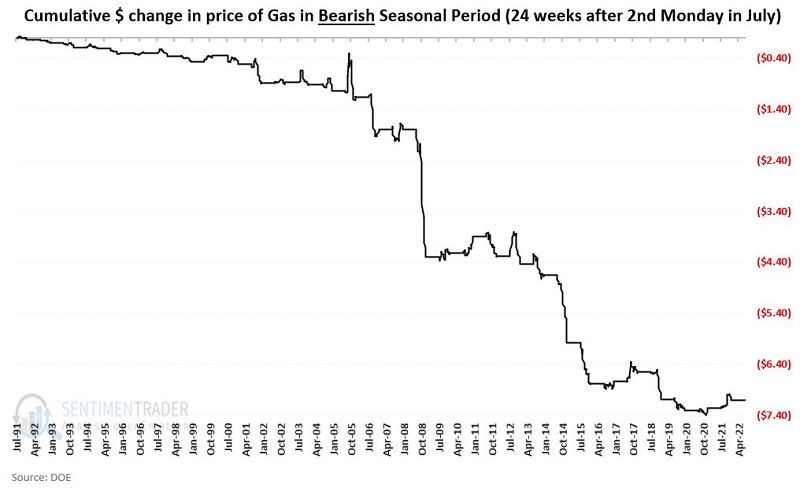
The table below summarizes gasoline price performance during bullish seasonal periods.
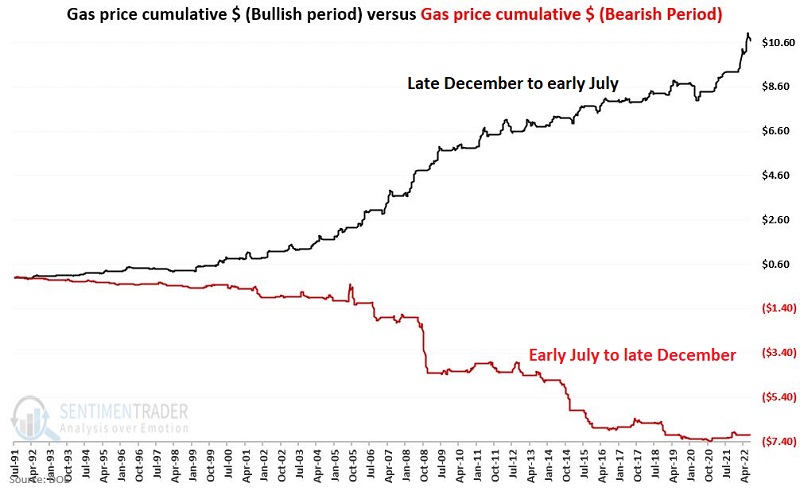
Comparing Bull to Bear
The chart below displays both bullish and bearish lines from above to highlight the stark contrast in performance.
One more factor: Crude Oil Term Structure
The term structure of crude oil futures shows the relationship of the near-term futures contract to a further-out contract. If it is above 1.0, the near-term contract is priced higher than the further-out contract, called backwardation. If below 1.0, then the market is in contango. Readings above 1.2 are rare and typically highlight panic-buying in the near-term crude oil contract - a bearish contrarian signal for the price of a barrel of crude oil.
The chart below shows those times when Crude Oil Term Structure crossed above 1.20. The most recent occurrence was on 3/2/2022.
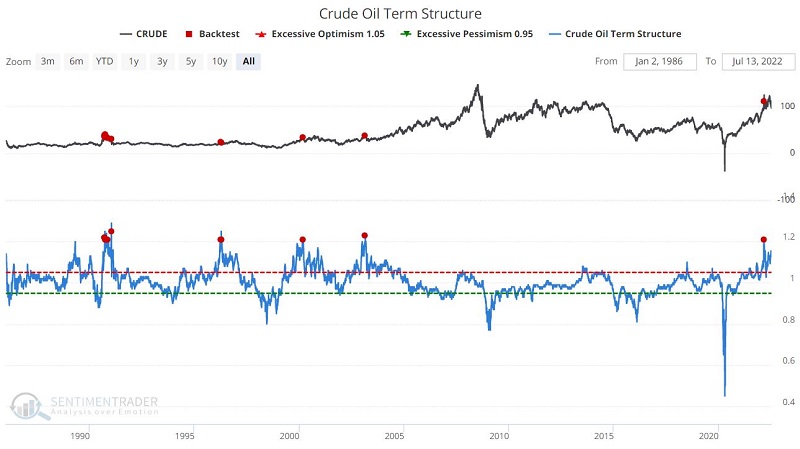
The table below summarizes crude oil price performance following previous crosses above 1.20 for this indicator.
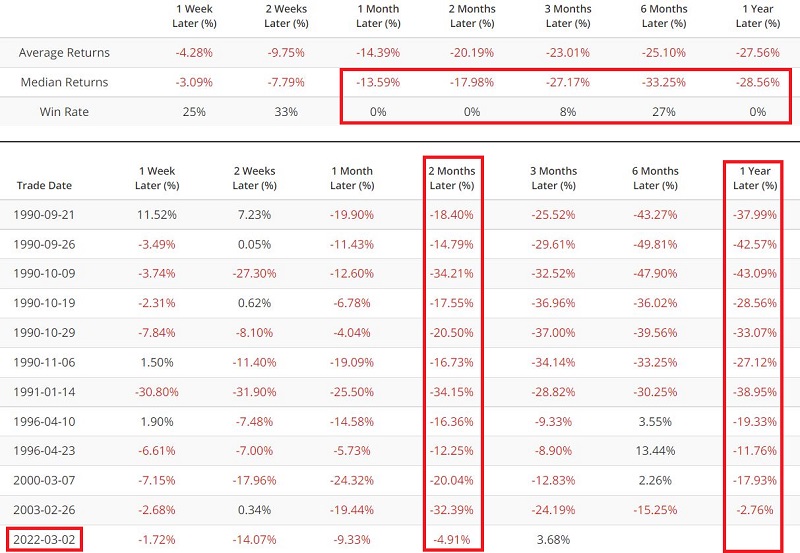
The near uniformly bearish performance for crude oil following previous signals argues for lower crude oil prices in the next three to nine months. A drop in the price of crude oil would likely help to facilitate a decline in gasoline prices.
What the research tells us…
Seasonality is nothing more than another indicator that can help traders and investors to "spot opportunity." Likewise, it is rarely a good idea to rely solely on seasonality when deciding whether or not to take a trade. Given the current inflation rate and geopolitical factors at play, this year could certainly be an exception to the "lower gas prices in 2nd half of the year" tendency.
Given the current state of affairs, few people are likely to give seasonal price weakness for gas a second thought, let alone the benefit of the doubt. Nevertheless, the fact remains that gasoline prices have demonstrated a strong historical tendency to show weakness in the second half of the year. With unleaded gas futures already well off their highs and crude oil term structure suggesting weakness in crude oil in the months ahead, it is not unreasonable to be hopeful that gasoline prices will decline during the second half of 2022.
Here's hoping...