Data &
Technology
Research
Reports
Report Solutions
Reports Library
Actionable
Strategies
Free
Resources
Simple Backtest Calculator
Simple Seasonality Calculator
The Kelly Criterion Calculator
Sentiment Geo Map
Public Research Reports
Free Webinar
Pricing
Company
About
Meet Our Team
In the News
Testimonials
Client Success Stories
Contact
Log inLoginSign up
< BACK TO ALL REPORTS

A Buy Signal That Has Never Failed

Jason Goepfert
2021-07-22
The NYSE Up Volume Ratio cycled from extreme selling pressure to extreme buying pressure in back-to-back sessions.

Some selling pressure to start the week made sense. There were ample and increasing signs of deterioration under the surface of the indexes, and it finally caught up to them.

In yet another concerted effort to buy every dip, though, that weakness lasted all of about one day. The buying stampede on Tuesday was remarkable, and it more than reversed the selling pressure from the day before.

The Up Volume Ratio cycled from below 15% to above 85% in back-to-back sessions on the NYSE.

NYSE Up Volume Ratio

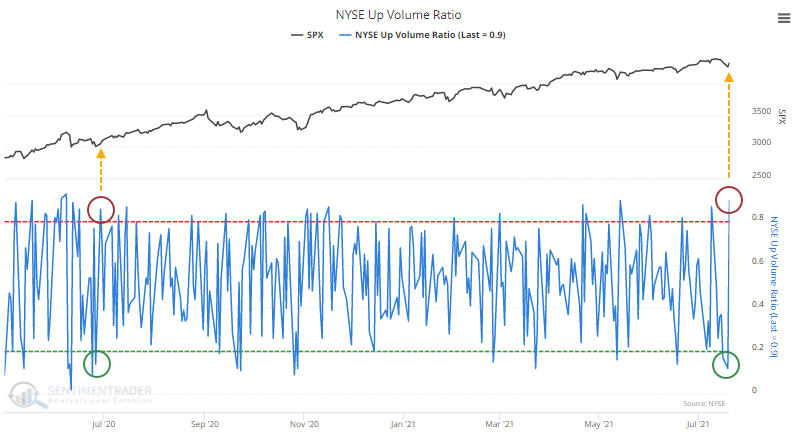
This triggered last June, and it marked the end of that little pullback, kicking off an impressive run over the next few months. That was much more the rule than the exception after a back-to-back reversal in Up Volume while the S&P 500 was within 10% of a 52-week high. 

Since 1962, the S&P 500 never showed a loss in the month following similar signals. These mostly occurred during momentum markets, and buyers followed through to avoid missing out on the next bull run. A few of them did end up leading to blow-off peaks, but not until month(s) later.


What else we're looking at

  • Full returns in the S&P 500 after back-to-back Up Volume reversals
  • What happens after reversals in bear markets
  • Sector and factor returns after Up Volume Reversals
  • An options trade idea on the Nasdaq 100 Trust, QQQ
  • A reversal concept with the McClellan Oscillator for the Energy sector

Stat box

On Wednesday, more than 80% of volume on the NYSE flowed into advancing securities, the 2nd day in a row. These are the first back-to-back sessions with more than 80% up volume in 8 months.

Etcetera

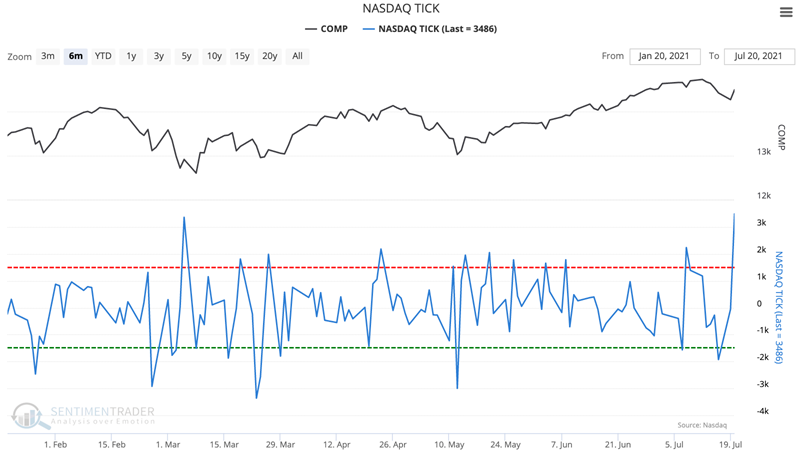
Reversal. NASDAQ Tick went from a two-month low to an eight-month high, showing concentrated selling pressure, then the exact opposite.

nasdaq tick

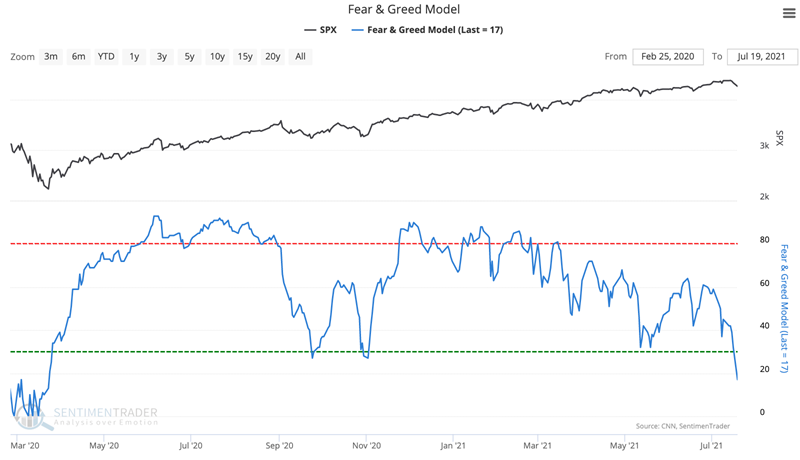
Despondency. The Fear & Greed Model has dipped to its lowest point since March 2020, showing Fear in the market.

fear & greed model

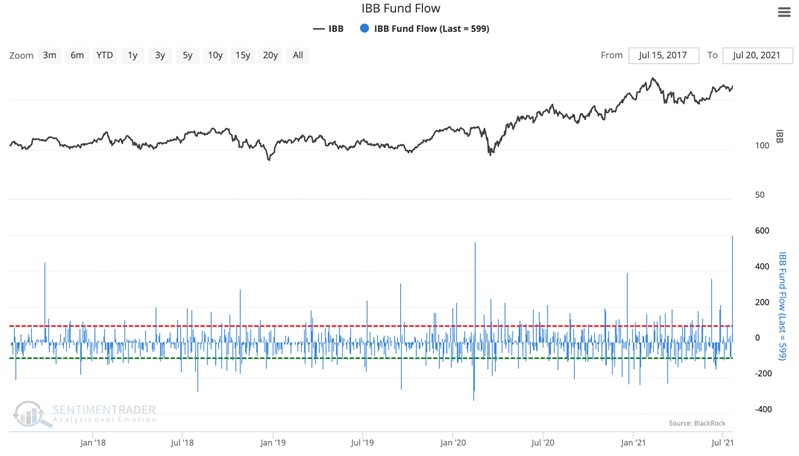
Cash flow. The IBB Biotech Fund saw a single day inflow of almost $600 million, its largest intake of cash in 5 years.

ibb biotech fund flow

DATA &
TECHnologies
IndicatorEdge
‍
BackTestEdge
‍
Other Tools
‍
DataEdge API
RESEARCH
reports
Research Solution
‍
Reports Library
‍
actionable
Strategies
Trading Strategies
‍
Smart Stock Scanner
‍
FREE
RESOUrCES
Simple Backtest
Calculator
Simple Seasonality
Calculator
The Kelly Criterion
Calculator
Sentiment Geo Map
‍
Public Research Reports
‍
Free Webinar
COMPANY
‍
About
‍
Meet our Team
‍
In the News
‍
Testimonials
‍
Client Success Stories
Pricing
Bundle pricing
‍
Announcements
‍
FAQ
© 2024 Sundial Capital Research Inc. All rights reserved.
Setsail Marketing
TermsPrivacyAffiliate Program
Risk Disclosure: Futures and forex trading contains substantial risk and is not for every investor. An investor could potentially lose all or more than the initial investment. Risk capital is money that can be lost without jeopardizing ones’ financial security or life style. Only risk capital should be used for trading and only those with sufficient risk capital should consider trading. Past performance is not necessarily indicative of future results.

Hypothetical Performance Disclosure: Hypothetical performance results have many inherent limitations, some of which are described below. No representation is being made that any account will or is likely to achieve profits or losses similar to those shown; in fact, there are frequently sharp differences between hypothetical performance results and the actual results subsequently achieved by any particular trading program. One of the limitations of hypothetical performance results is that they are generally prepared with the benefit of hindsight. In addition, hypothetical trading does not involve financial risk, and no hypothetical trading record can completely account for the impact of financial risk of actual trading. for example, the ability to withstand losses or to adhere to a particular trading program in spite of trading losses are material points which can also adversely affect actual trading results. There are numerous other factors related to the markets in general or to the implementation of any specific trading program which cannot be fully accounted for in the preparation of hypothetical performance results and all which can adversely affect trading results.

Testimonial Disclosure: Testimonials appearing on this website may not be representative of other clients or customers and is not a guarantee of future performance or success.