Products
SentimenTrader Trading Tools
‍
Backtest Engine
My Trading Toolkit
Correlation Analysis
Seasonality
Market Prediction
Indicators & Data API
‍
Proprietary Indicators & Charts
Market Data API
Strategies & Scanner
‍
50+ Trading Strategies
Smart Stock Scanner
Smart Option Scanner
Research Reports
‍
Research Solutions
Reports Library
Free Resources
Simple Backtest Calculator
Simple Seasonality Calculator
The Kelly Criterion Calculator
Sentiment Geo Map
Public Research Reports
Education
Sentiment Indicators
Technical Indicators
Pricing
Company
About
In the News
Testimonials
Client Success Stories
Contact
Log inLoginSign up
< BACK TO ALL REPORTS

A bullish win streak for the S&P 500

Dean Christians
2025-07-15
For only the 15th time since 1935, the S&P 500 closed above its 20-day average for 55 consecutive trading sessions. Similar win streaks saw the world's most benchmarked index rally over the following three months in all but one case.

Key points:

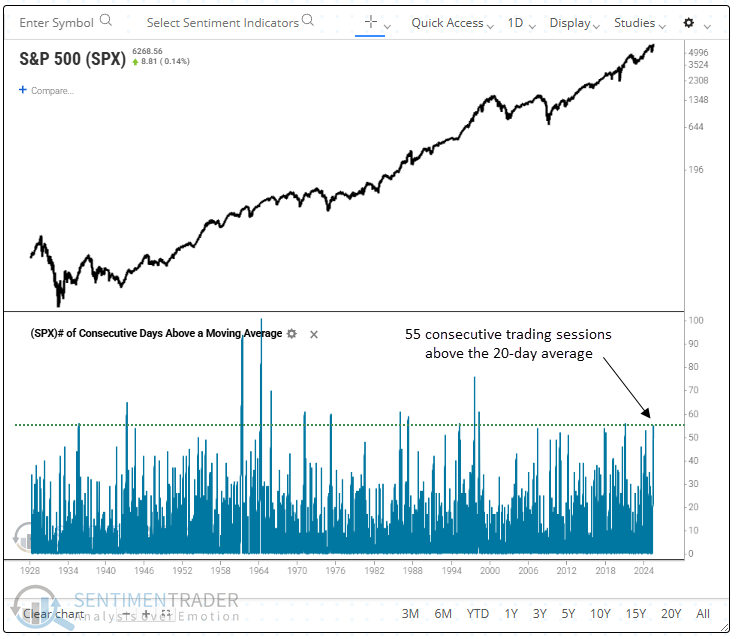
  • The S&P 500 has sustained above its 20-day average for 55 consecutive trading sessions
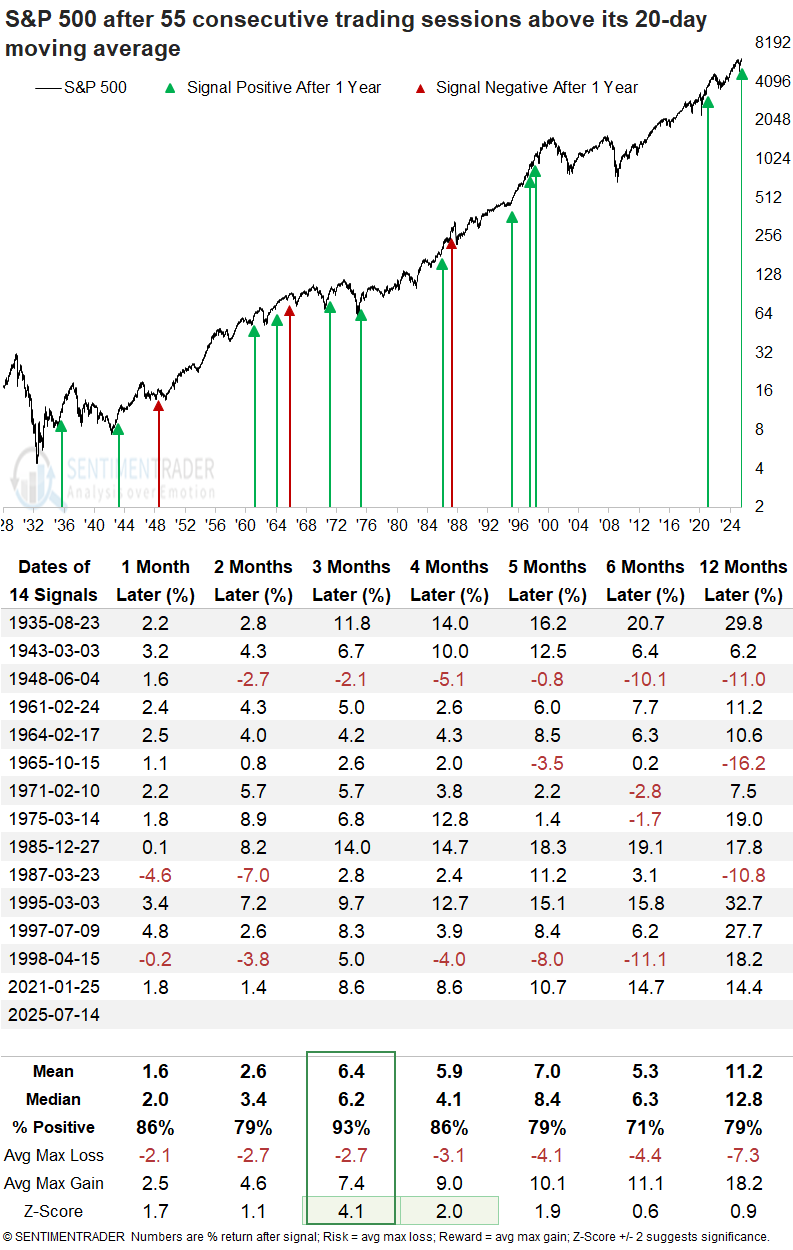
  • Similar win streaks saw the benchmark index rise 93% of the time over the following three months
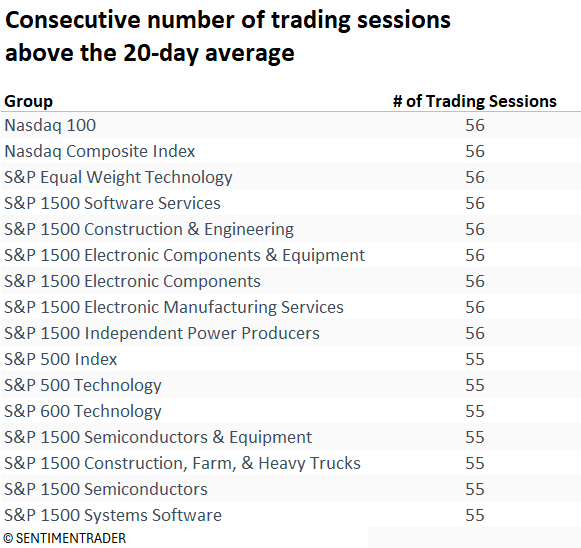
  • Technology and industrials top the list of indexes with a lofty number of days above the 20-day average

Consistent trends are a hallmark of bull market environments

The S&P 500 has now closed above its 20-day moving average for 55 consecutive trading sessions, an impressive streak that reflects the kind of persistent buying pressure typically associated with strong bull market trends, rather than sideways or bearish conditions. 

As you may recall, I highlighted a similar pattern in the Nasdaq Composite in the report "An Impressive Win Streak for the Nasdaq Composite," which used a 10-day average and required 21 consecutive days above trend. I'm a big fan of trend consistency, which is why the 10-day version is a member of the TCTM Composite Confirmation Model. 

Similar win streaks suggest the uptrend in the S&P 500 will persist

Whenever the S&P 500 closed above its 20-day average for 55 consecutive trading sessions, the world's most benchmarked index exhibited a strong bullish bias, advancing in all but one instance over the following three months. Furthermore, returns in this time frame displayed significance relative to random expectations.

It's worth noting that three signals appeared during the Dot-com boom of the 1990s, a period frequently cited as a parallel to today's AI cycle. 

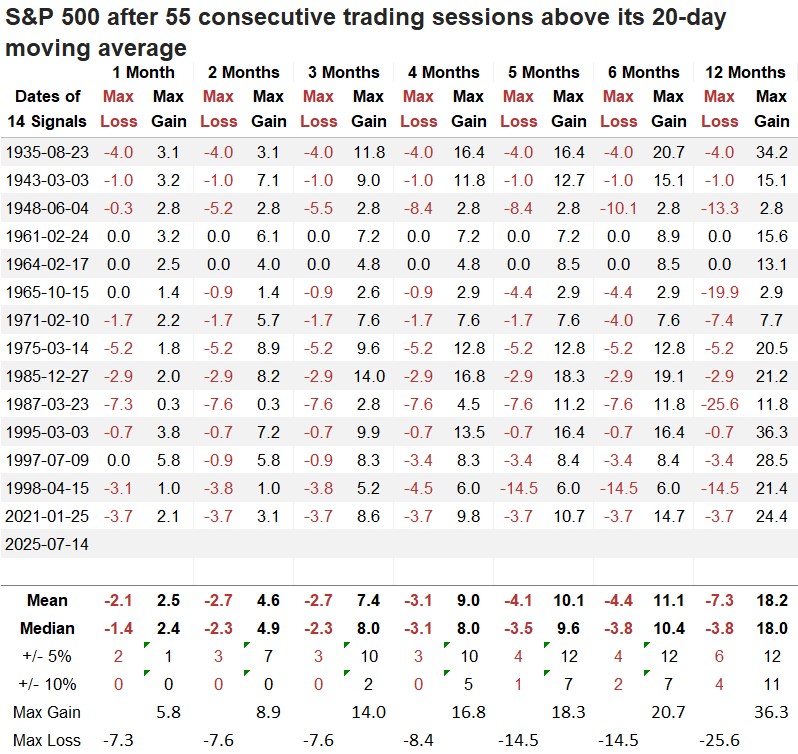
Over the following year, the S&P 500 experienced a decline of more than 10% on four occasions, while it rose by more than 10% in 11 instances, indicating a favorable risk/reward scenario. 

Other groups that have sustained above their 20-day average for an extended period

Indexes tied to technology and industrials have consistently remained above their 20-day averages for an extended period, reflecting the momentum driven by themes such as artificial intelligence and data center expansion. 

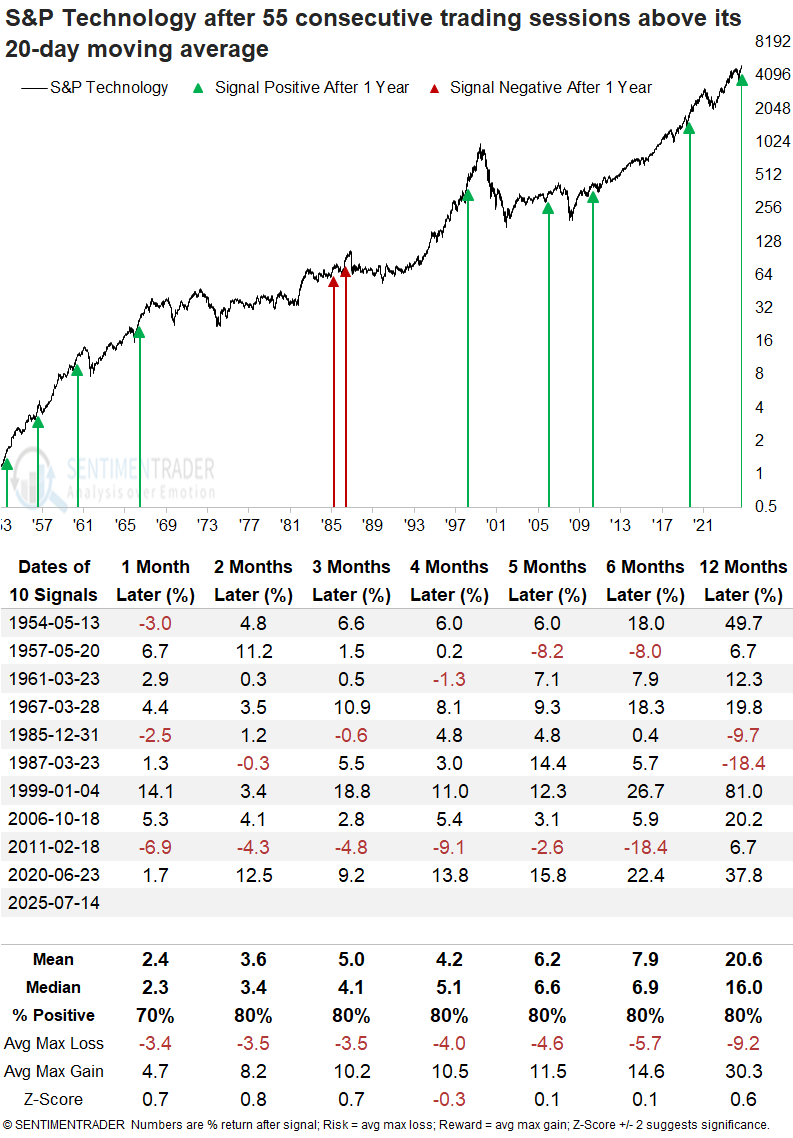
A rare occurrence for technology

For only the 11th time since 1954, the S&P 500 Technology sector persisted above its 20-day average for 55 straight sessions, a remarkable feat for a volatile sector. Similar signals saw the large-cap tech sector steadily rise over the subsequent twelve months.

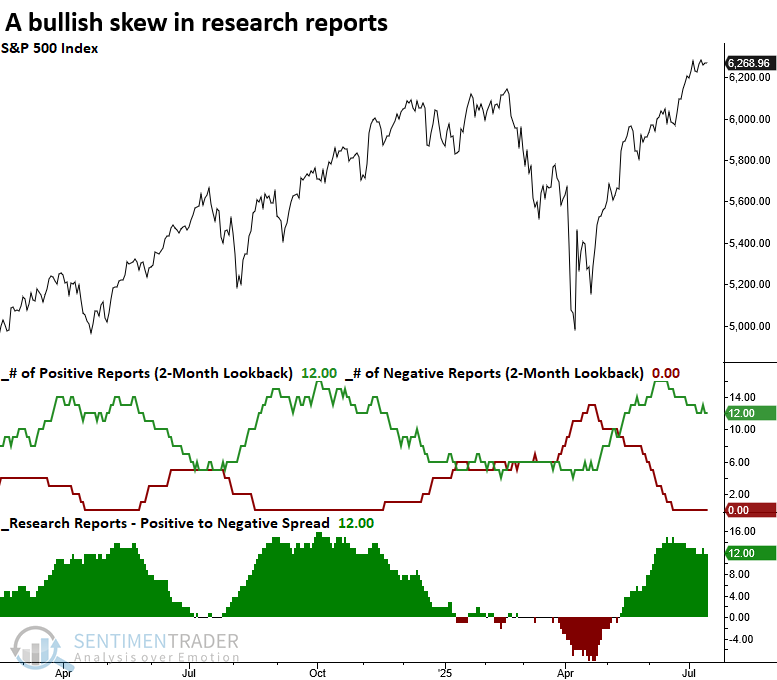
Weight of the evidence 

The weight of the evidence, based on trading signals presented in research reports, continues to lean bullish, supporting a fully invested stance for investors.

What the research tells us...

In recent weeks, we've seen an increasing number of long-term breadth and momentum signals confirm the strength and durability of the current uptrend. Today's note adds to that growing list with yet another favorable signal: the S&P 500 has now closed above its 20-day average for 55 consecutive sessions. This type of persistent buying pressure is almost always associated with advancing markets rather than sideways or bearish phases; historically, when this scenario has occurred, the world's most benchmarked index has posted a positive return over the next three months 93% of the time, reinforcing the view that we remain in a healthy, sustained uptrend.

PRODUCTS
SentimenTrader
Trading Tools
Indicators & Data API
‍
Strategies & Scanner
‍
Research Reports
FREE
RESOUrCES
Simple Backtest
Calculator
Simple Seasonality
Calculator
The Kelly Criterion
Calculator
Sentiment Geo Map
‍
Public Research Reports
‍
Education
Sentiment Indicators
‍
Technical Indicators
‍
Pricing
Bundle pricing
‍
FAQ
‍
Announcements
‍
COMPANY
‍
About
‍
In the News
‍
Testimonials
‍
Client Success Stories
CONTACT
‍
General Inquiries
‍
Media Inquiries
‍
Financial Professionals Inquiries
‍
© 2026 Sundial Capital Research Inc. All rights reserved.
Setsail Marketing
TermsPrivacyAffiliate Program
Risk Disclosure: The information and tools provided are for research and analytical purposes only and are not intended as investment advice. Market analysis involves uncertainty, and outcomes may differ from expectations. Users should conduct their own due diligence and consider their individual circumstances before making any financial decisions. Past performance is not necessarily indicative of future results.

Hypothetical Performance Disclosure: Hypothetical performance results have many inherent limitations, some of which are described below. No representation is being made that any account will or is likely to achieve profits or losses similar to those shown; in fact, there are frequently sharp differences between hypothetical performance results and the actual results subsequently achieved by any particular trading program. One of the limitations of hypothetical performance results is that they are generally prepared with the benefit of hindsight. In addition, hypothetical trading does not involve financial risk, and no hypothetical trading record can completely account for the impact of financial risk of actual trading. for example, the ability to withstand losses or to adhere to a particular trading program in spite of trading losses are material points which can also adversely affect actual trading results. There are numerous other factors related to the markets in general or to the implementation of any specific trading program which cannot be fully accounted for in the preparation of hypothetical performance results and all which can adversely affect trading results.

Testimonial Disclosure: Testimonials appearing on this website may not be representative of other clients or customers and is not a guarantee of future performance or success.