
A bullish upswing in price momentum

Key points:
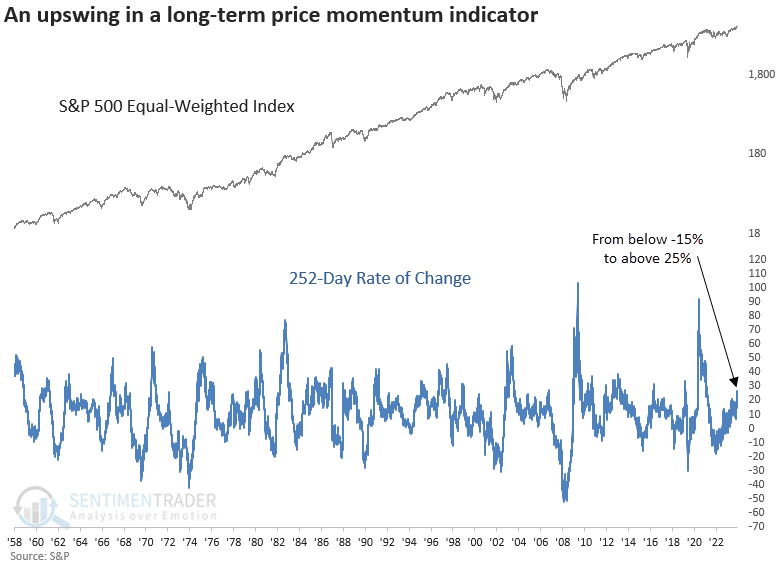
- The 252-day rate of change for the equal-weighted S&P 500 cycled from below -15% to above 25%
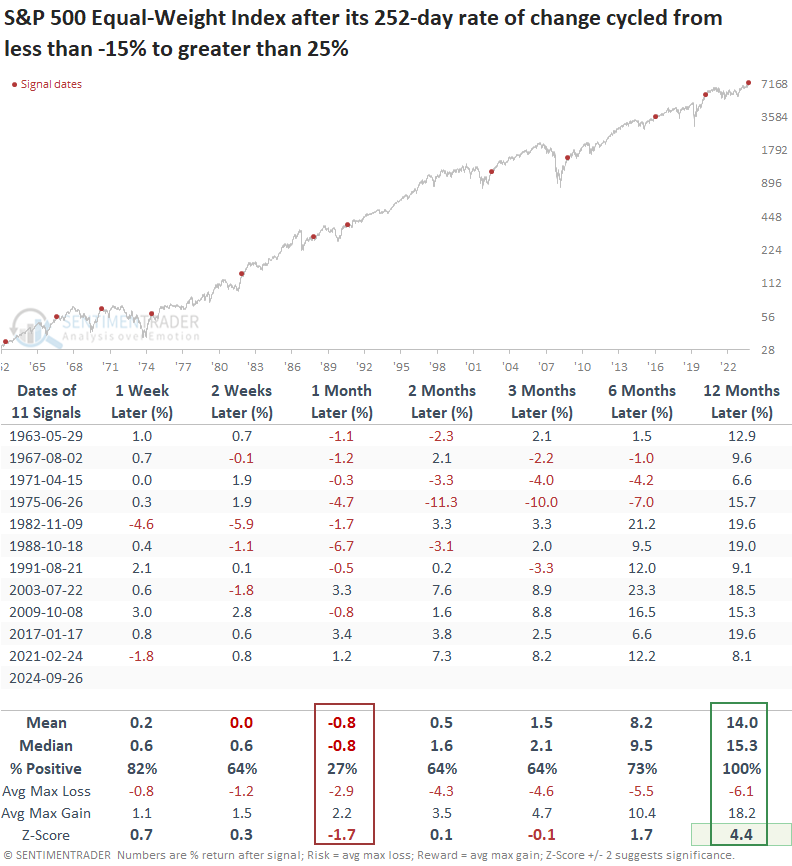
- Similar price momentum upswings produced a 100% win rate for the equal-weighted index over the next year
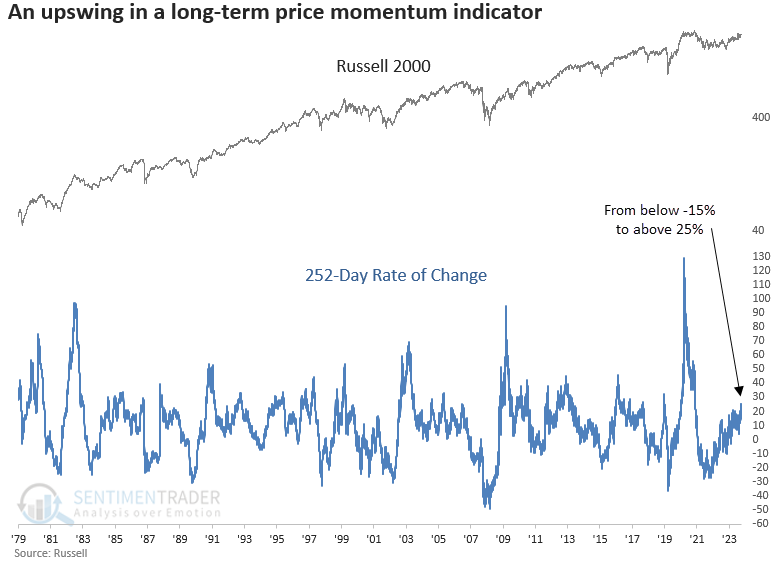
- The 252-day rate of change for the Russell 2000 cycled from below -15% to above 25%
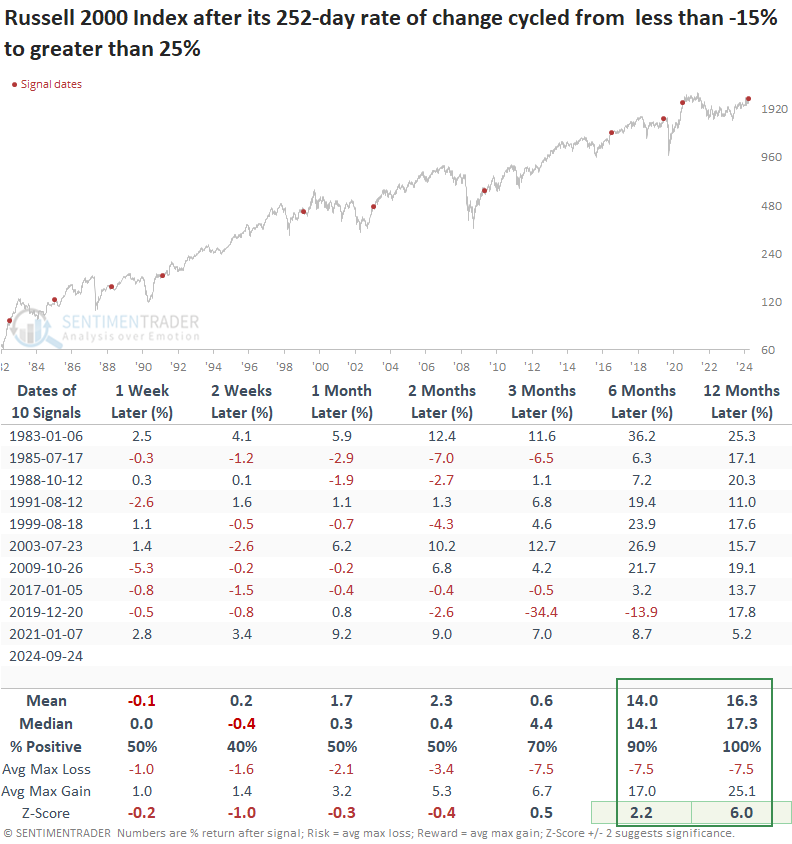
- Comparable price momentum upswings achieved a 100% win rate for the Russell 2000 over the next year
Positive price momentum begets more positive price momentum
Stock market momentum often persists, making it a reliable indicator for trend-following strategies. Positive price momentum suggests that a stock or index is experiencing sustained buying pressure, signaling a continued upward trend. Conversely, negative price momentum reflects ongoing selling pressure, indicative of a downtrend.
Two indexes that typically demonstrate strong price momentum early in bull markets but lagged during the 2022-23 shift from bear to bull have triggered positive long-term price momentum signals.
Those indices, the equal-weighted S&P 500 and the Russell 2000, saw their respective 252-day rate of changes cycle from below -15% to above 25%, indicating positive price momentum typically associated with sustainable long-term uptrends.
Similar price momentum produced outstanding returns a year later
Whenever the 252-day rate of change for the equal-weighted S&P 500 index cycled from below -15% to above 25%, the index that weights each stock equally rose over the following year every time, indicating that positive price momentum tends to persist. However, the outlook a month later serves as a reminder that market movements are rarely linear.
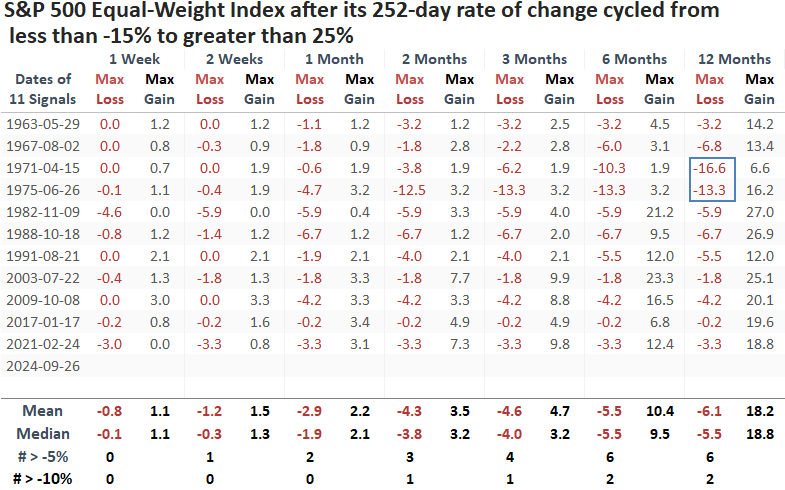
Following similar precedents, the equal-weighted S&P 500 index experienced only two maximum losses exceeding -10 %, both in the 1970s.
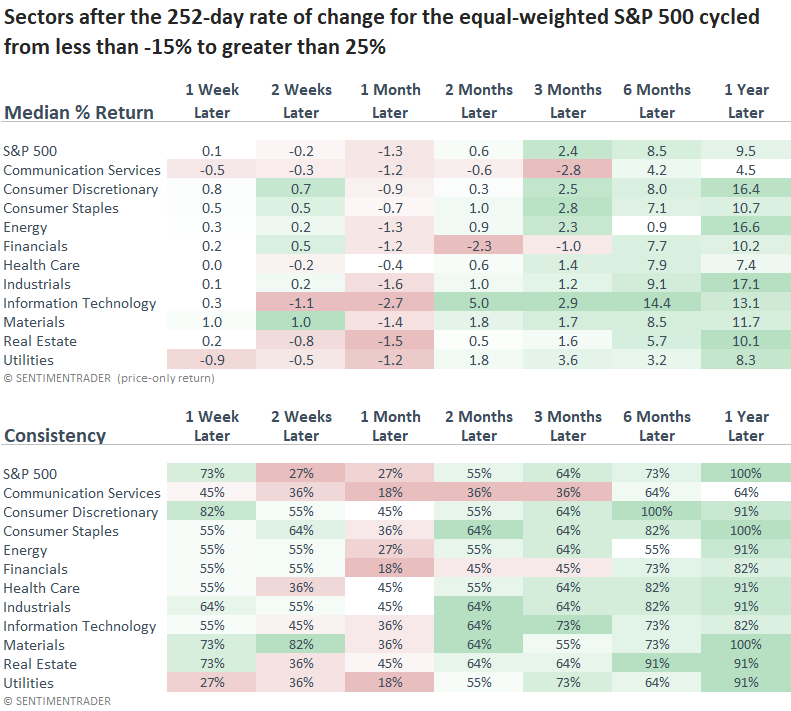
The sector outlook table further illustrates how stocks tend to consolidate/correct from buyer's exhaustion in the near term, even when long-term price momentum suggests a favorable environment. I would also note that the cap-weighted S&P 500 rose 100% of the time over the following year.
Small-cap stocks exhibit positive long-term price momentum
For only the 11th time since 1979, the Russell 2000, a popular small-cap stock index, saw its 252-day rate of change transition from below -15% to above 25%.
The Russell 2000, much like the equal-weighted S&P 500, saw a muted near-term outlook following bullish long-term price momentum signals, yet it advanced 90% and 100% of the time over the next six and twelve months.
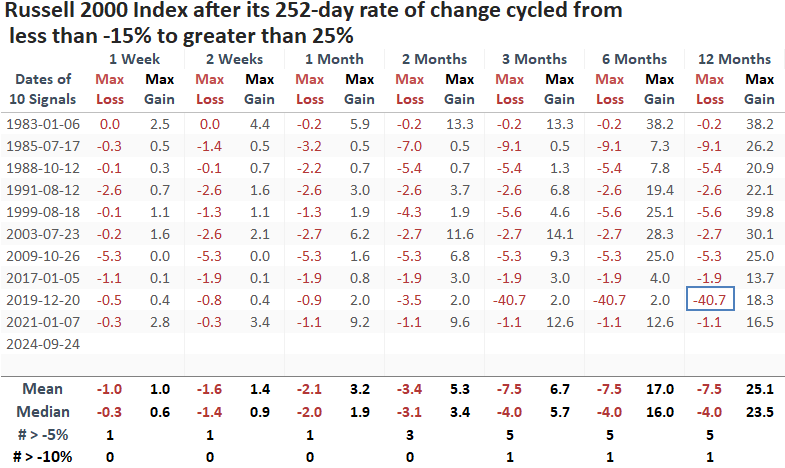
The only time the maximum loss exceeded -10% over the following year was in 2019, which was triggered just before the pandemic crash when the government shut down the economy, a highly unusual event.
What the research tells us...
The equal-weighted S&P 500 and the Russell 2000 triggered bullish long-term price momentum signals. Following similar precedents, the indexes rose 100% of the time over the ensuing year. Although these signals may not be actionable on their own, they offer meaningful confirmation that the broader market environment remains supportive, strengthening the case for a sustained stock market uptrend. Therefore, if stocks consolidate or pull back ahead of the election, investors should consider seizing the opportunity to buy the dip.