Products
SentimenTrader Trading Tools
‍
Backtest Engine
My Trading Toolkit
Correlation Analysis
Seasonality
Market Prediction
Indicators & Data API
‍
Proprietary Indicators & Charts
Market Data API
Strategies & Scanner
‍
50+ Trading Strategies
Smart Stock Scanner
Smart Option Scanner
Research Reports
‍
Research Solutions
Reports Library
Free Resources
Simple Backtest Calculator
Simple Seasonality Calculator
The Kelly Criterion Calculator
Sentiment Geo Map
Public Research Reports
Education
Sentiment Indicators
Technical Indicators
Pricing
Company
About
In the News
Testimonials
Client Success Stories
Contact
Log inLoginSign up
< BACK TO ALL REPORTS

A bullish-to-bearish reversal in uptrends for global indexes

Dean Christians
2024-06-18
The percentage of country indexes trading above their respective 50-day averages cycled from above 70% to below 25% in only three sessions. Comparable swift reversals tended to result in negative returns and unfavorable win rates for global indexes and the S&P 500 over a medium-term horizon.

Key points:

  • Global indexes saw medium-term uptrends decline sharply in just a few days
  • Similar breadth-based reversals suggest a global index could struggle over the next three months
  • The MSCI World Index ex USA and S&P 500 followed a similar path, struggling over a medium-term basis

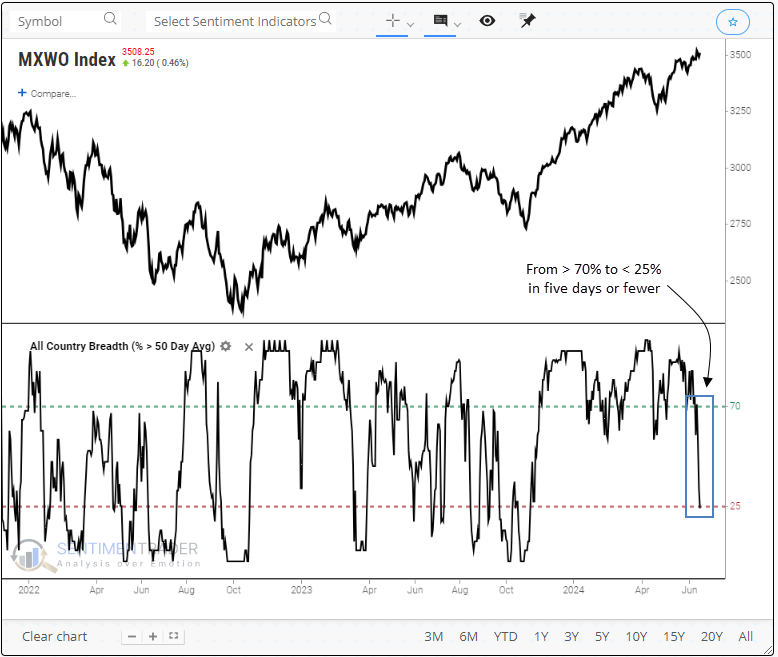
The participation problem spreads around the globe

Over the last few weeks, we've highlighted the deteriorating market breadth environment under the surface of domestic indexes, indicating that fewer and fewer stocks exhibit positive price trend characteristics. 

This participation problem has now spread globally, with the percentage of all country indexes trading above their respective 50-day average, cycling from above 70% to below 25% in only three sessions.

The previous instance occurred in August 2023, when global and domestic indexes were in the early stages of a 10% or greater correction. 

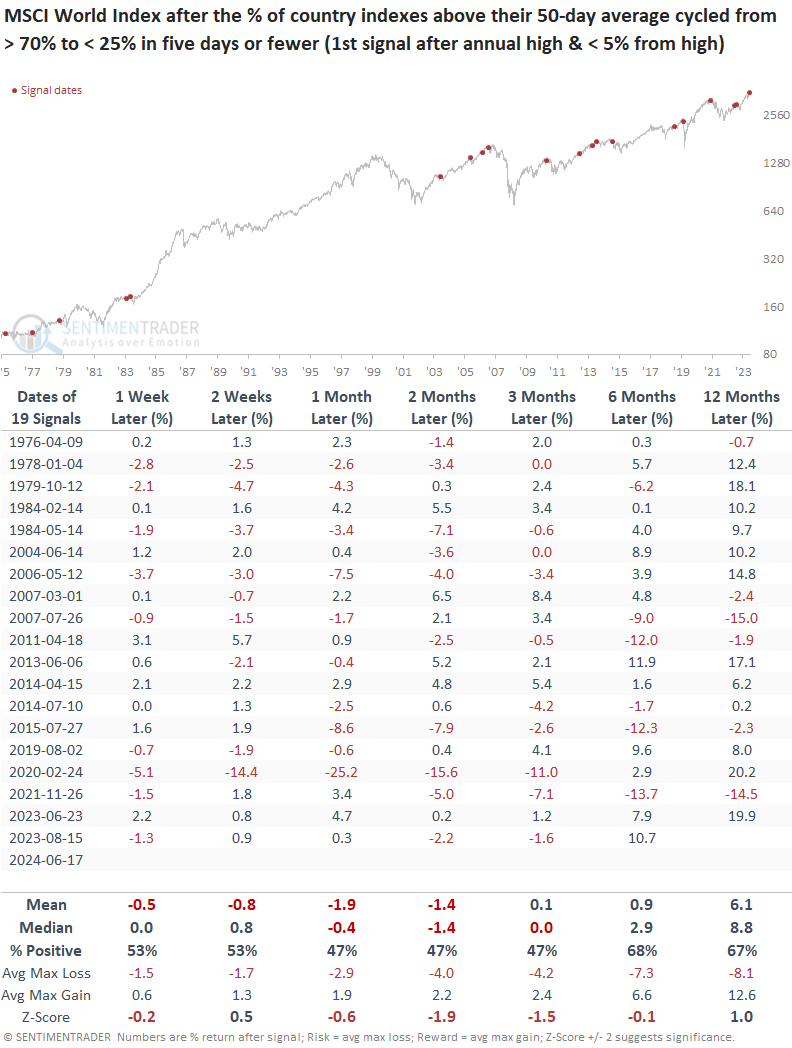
Similar breadth-based reversals suggest a broad global index could struggle

Whenever the percentage of country indexes above their 50-day average cycled from above 70% to under 25% in five days or fewer, the MSCI World Index struggled over the following three months. At some point over that same time frame, the global benchmark displayed a loss in 16 out of 19 instances.

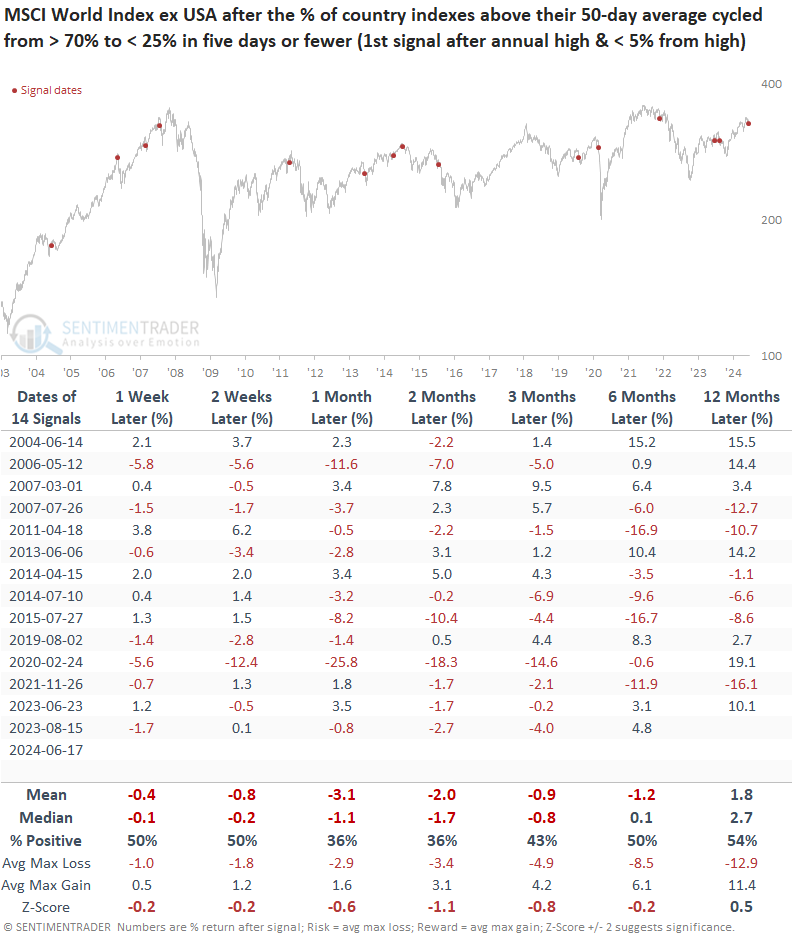
Despite the reduced number of signals caused by data limitations, I thought it worthwhile to analyze the outlook for a global index that excludes the United States, given the USA's superior performance relative to international equities over the last 16 years.

Given that most signals occurred during a period when technology-driven growth stocks outperformed, it's unsurprising that this index, which excludes the USA, has struggled over various time frames following similar breadth reversals.

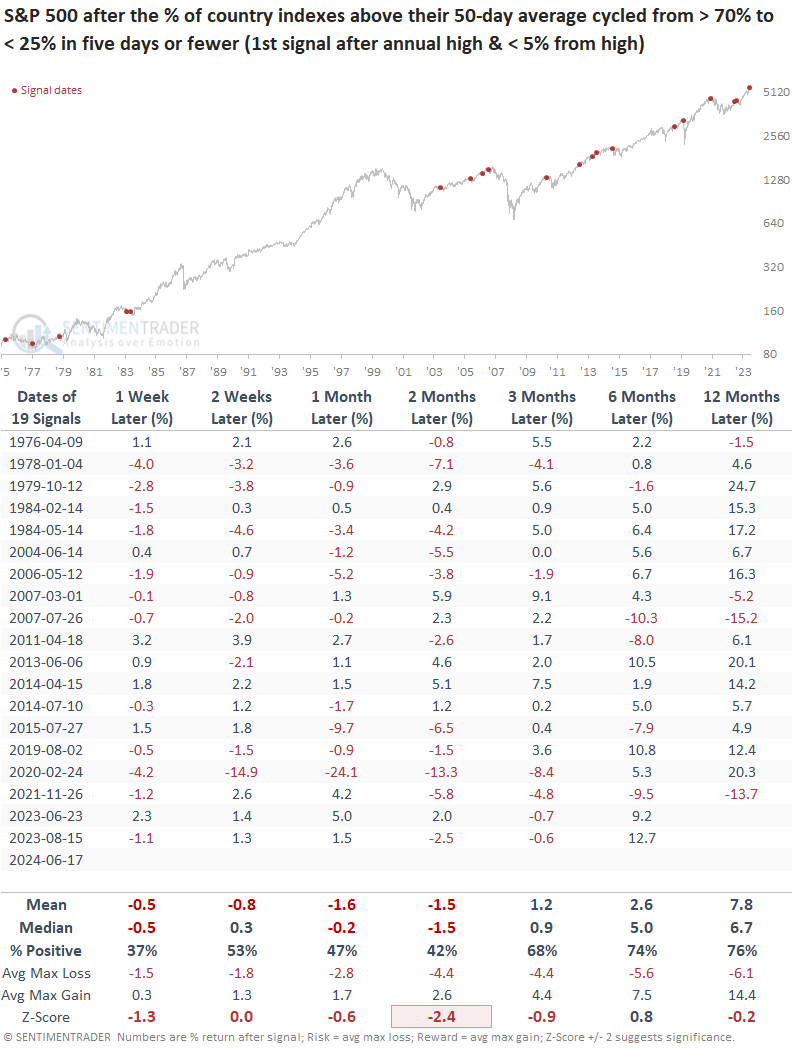
When global indexes experienced a participation problem, the S&P 500's returns and win rates tended to be lackluster in the following few months. This observation mirrors recent trends we've noted in domestic indexes. 

What the research tells us...

The participation problem we've been highlighting over the last few weeks for domestic indexes has spread around the globe, with fewer and fewer international indexes holding above their respective 50-day averages. Similar breadth-based reversals tended to produce negative returns and unfavorable win rates for broad-based global indexes and the S&P 500 over a medium-term horizon. While these historical tendencies usually lead to a consolidation/pullback, it's hard to make a case for something more significant, with 90% of global indexes trading above their respective 200-day averages.

PRODUCTS
SentimenTrader
Trading Tools
Indicators & Data API
‍
Strategies & Scanner
‍
Research Reports
FREE
RESOUrCES
Simple Backtest
Calculator
Simple Seasonality
Calculator
The Kelly Criterion
Calculator
Sentiment Geo Map
‍
Public Research Reports
‍
Education
Sentiment Indicators
‍
Technical Indicators
‍
Pricing
Bundle pricing
‍
FAQ
‍
Announcements
‍
COMPANY
‍
About
‍
In the News
‍
Testimonials
‍
Client Success Stories
CONTACT
‍
General Inquiries
‍
Media Inquiries
‍
Financial Professionals Inquiries
‍
© 2026 Sundial Capital Research Inc. All rights reserved.
Setsail Marketing
TermsPrivacyAffiliate Program
Risk Disclosure: The information and tools provided are for research and analytical purposes only and are not intended as investment advice. Market analysis involves uncertainty, and outcomes may differ from expectations. Users should conduct their own due diligence and consider their individual circumstances before making any financial decisions. Past performance is not necessarily indicative of future results.

Hypothetical Performance Disclosure: Hypothetical performance results have many inherent limitations, some of which are described below. No representation is being made that any account will or is likely to achieve profits or losses similar to those shown; in fact, there are frequently sharp differences between hypothetical performance results and the actual results subsequently achieved by any particular trading program. One of the limitations of hypothetical performance results is that they are generally prepared with the benefit of hindsight. In addition, hypothetical trading does not involve financial risk, and no hypothetical trading record can completely account for the impact of financial risk of actual trading. for example, the ability to withstand losses or to adhere to a particular trading program in spite of trading losses are material points which can also adversely affect actual trading results. There are numerous other factors related to the markets in general or to the implementation of any specific trading program which cannot be fully accounted for in the preparation of hypothetical performance results and all which can adversely affect trading results.

Testimonial Disclosure: Testimonials appearing on this website may not be representative of other clients or customers and is not a guarantee of future performance or success.