
A bullish surge for stocks in India

Key points:
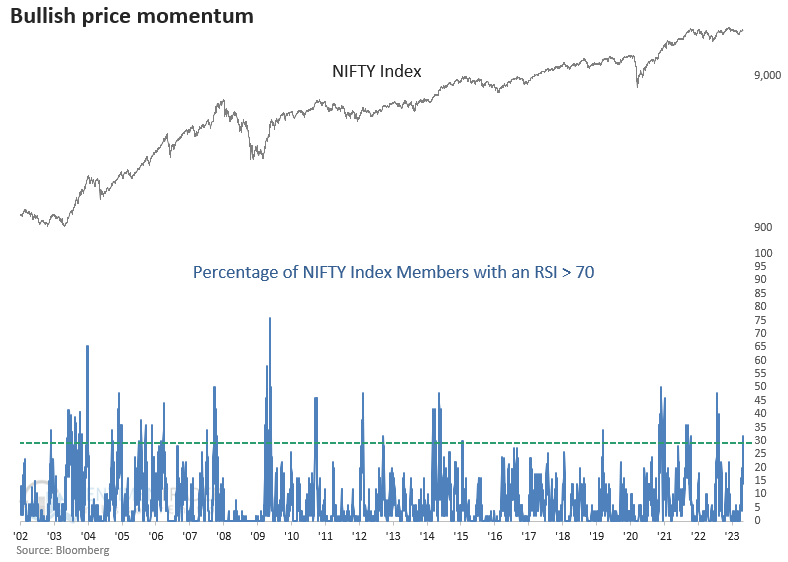
- The percentage of NIFTY Index members with an RSI > 70 surged above 30%
- Similar momentum surges preceded excellent returns and win rates for the local currency NIFTY Index
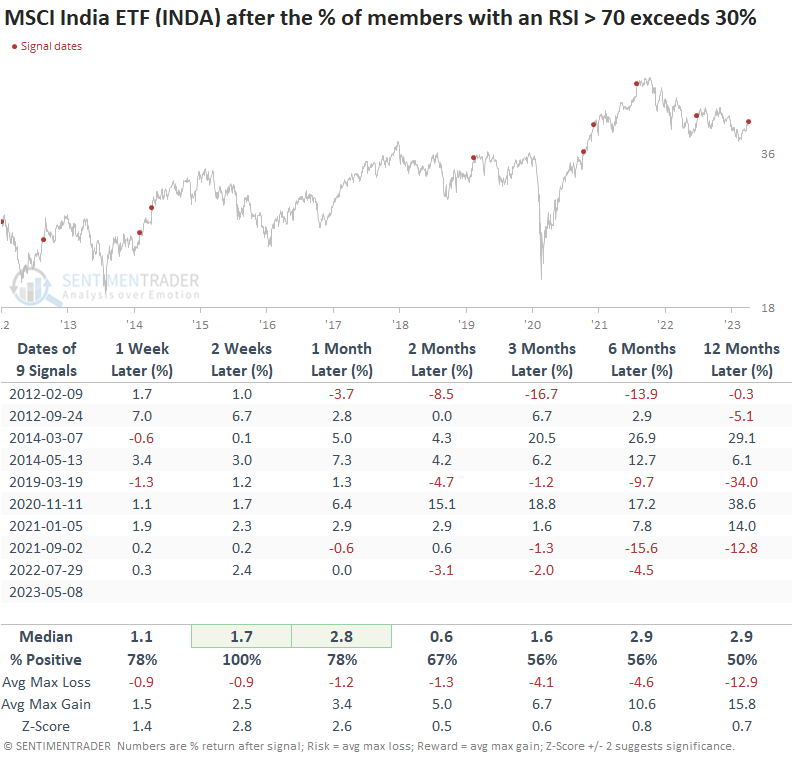
- While the sample size is smaller, a USD-based India ETF showed strong results over the next few weeks
A bullish overbought condition
The Relative Strength Index (RSI), developed by J. Welles Wilder Jr., measures price momentum for stocks, indexes, and other assets. The common mistake traders make is associating a reading above 70 with a bearish overbought condition. In actuality, it's more bullish than bearish. Some market practitioners call this a bullish overbought condition, which I embrace.
On the SentimenTrader website, we maintain a breadth-based series that measures the percentage of members in an index with an RSI > 70 for several domestic and international indexes.
On Monday, the percentage of NIFTY Index members with an RSI > 70 surged above 30%, triggering a buy signal for the India-based Index.
Similar bursts in price momentum preceded positive returns
When the percentage of NIFTY Index members with an RSI > 70 exceeds 30%, the India-based Index shows extremely bullish results over the next month. Two weeks later, the alert had only one loss over a 20-year period.
Please keep in mind that the NIFTY Index is priced in local currency, not USD.
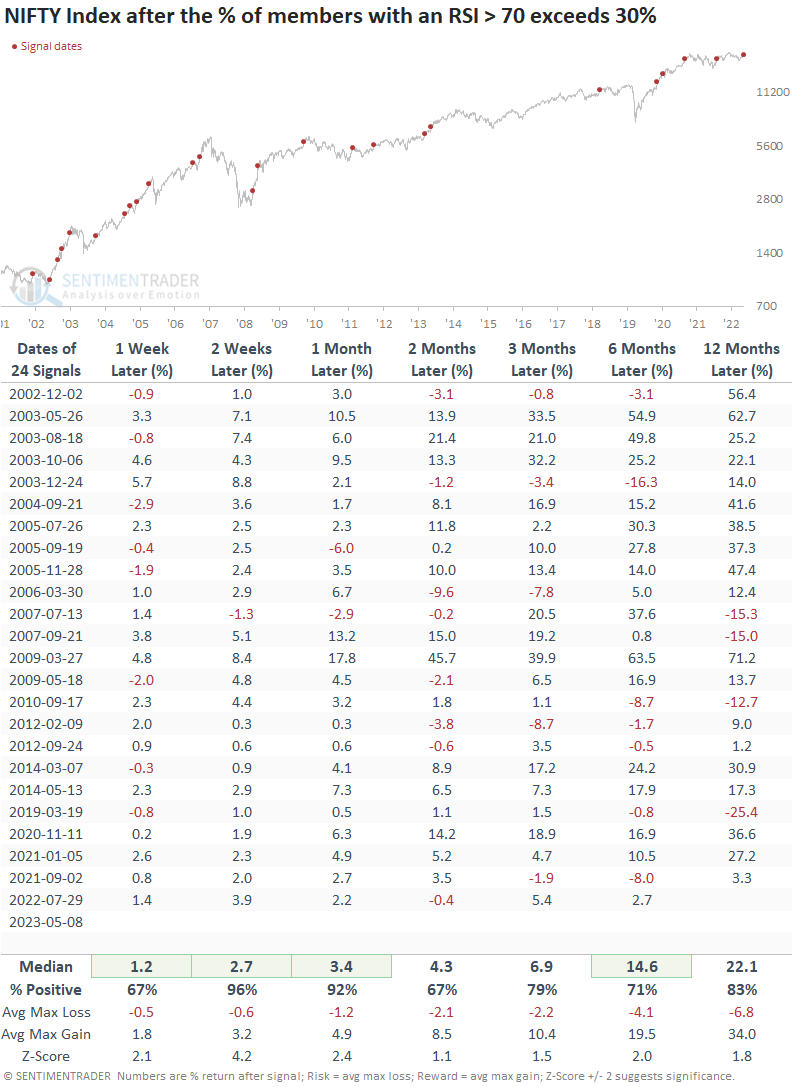
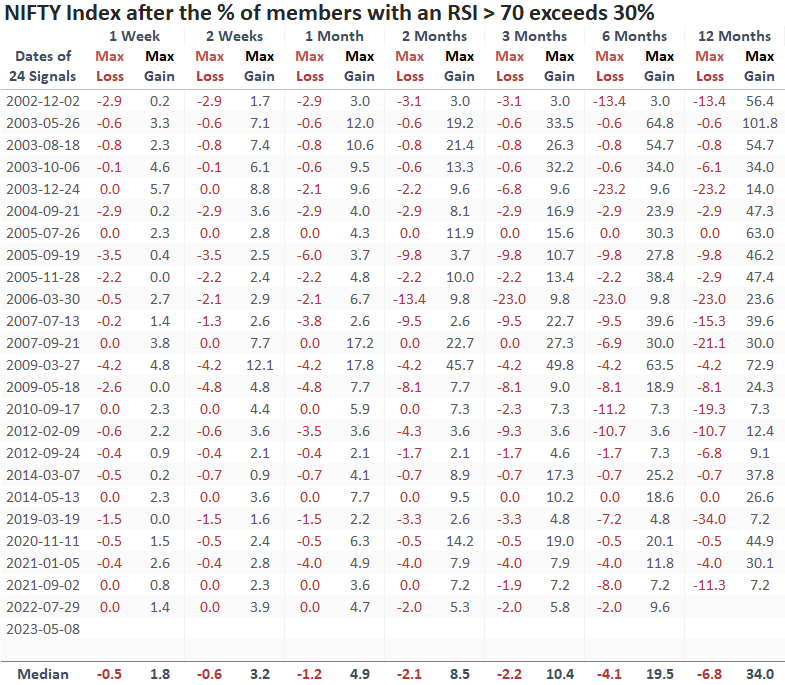
Over the next month, the signal had only one loss greater than -5%. And across all time frames, the median max gain was significantly better than the median max loss.
Suppose I apply the signals to an India ETF. Given the limited history of all domestic India ETFs, the sample size is significantly smaller in that case. However, the two-week horizon remains robust.
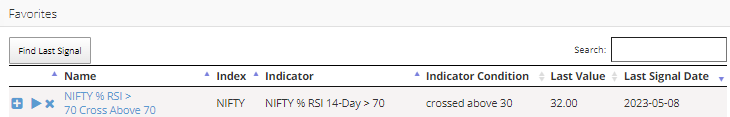
Backtest Engine
Website subscribers can create and save RSI signals like this one using the SentimenTrader Backtest Engine.
What the research tells us...
The Asia-Pacific region, which includes India, has been a relative underperformer for some time. However, with price momentum in India looking bullish of late, now is an excellent time to investigate further. The percentage of NIFTY Index members with an RSI > 70 surged above 30%, triggering a buy signal with excellent results. While the sample size is smaller, the domestic USD-based ETF (INDA) could show similar results over the next few weeks.