
A bullish strategy on the cheap

Key points
- A calendar spread can allow a trader to profit from a bullish move while limiting downside risk at a fraction of the cost of buying shares
- The strategy can be beneficial with high-price stocks that a trader might otherwise avoid
- Low implied option volatility is a key to improving the odds of success
Microsoft on the cusp… or doomed to fail?
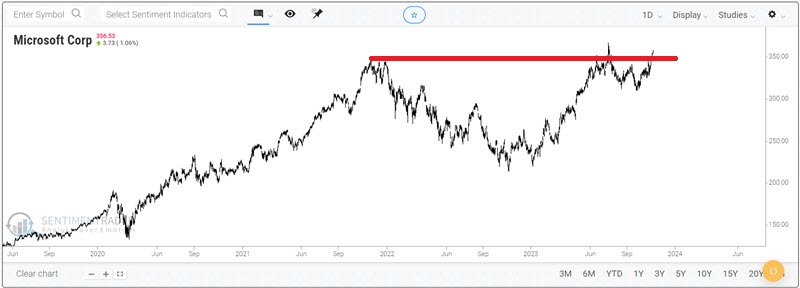
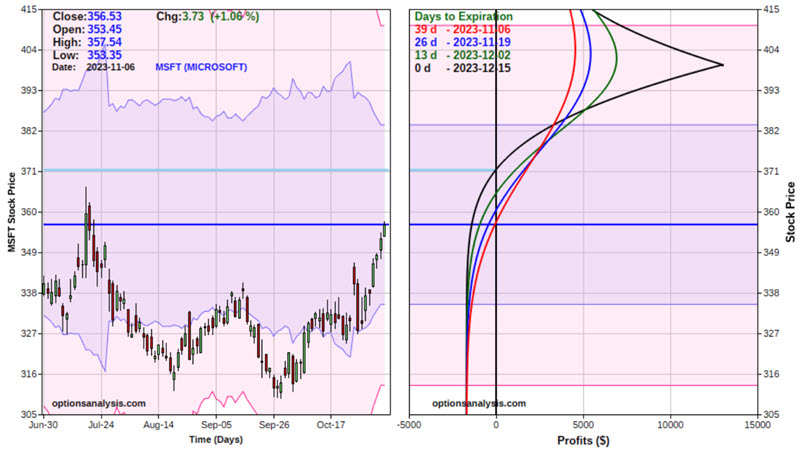
In the chart below, we can see that Microsoft (MSFT) is threatening to break out to a new high. At the same time, there is also a chance that MSFT will try and fail to break out and then reverse sharply to the downside.
For a trader expecting an upside breakout and another run to the upside, the most straightforward play would be to buy 100 shares of MSFT. The particulars for this trade - and the expected $ P/L based on movements in the price of MSFT shares - appear in the figure below (all charts below are courtesy of www.Optionsanalysis.com).
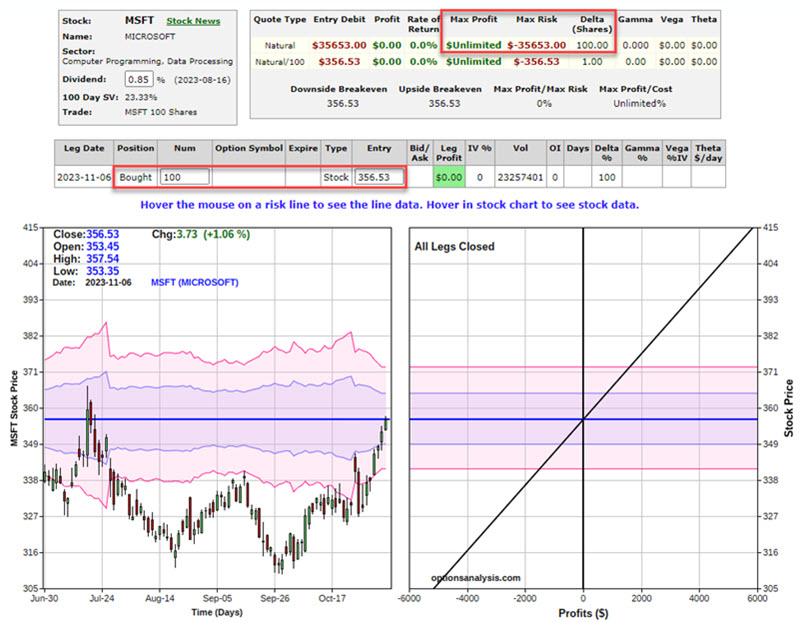
A position of long 100 shares has a "delta" of 100. This tells us that for each $1 movement in the price of MSFT shares, the position will gain or lose $100. The most important thing to note is that with MSFT trading at $356.53 a share, the trader must commit $35,653 to buy 100 shares. For a trader "hoping for a run" but concerned about the downside risk associated with a failed breakout, a $35K price tag may be a bridge too far.
A calendar spread as a lower-cost alternative
A bull call calendar spread is an option position that buys an out-of-the-money call option in a further out calendar month and simultaneously sells another put option at the same strike price in a closer calendar month. Before looking at an example trade, note in the chart below that implied option volatility for MSFT options (the black line in the chart below) is near the low end of its historical range.
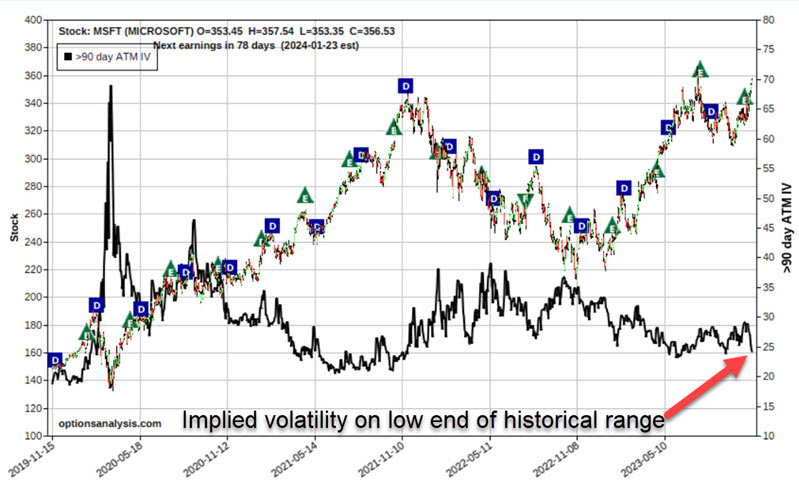
Out-of-the-money options are comprised solely of time premium - which will evaporate by options expiration. Implied options volatility tells us whether the amount of time premium built into the options for a given stock is presently on the high or low end of the historical range - or somewhere in between. If IV is on the low end of the historical range, then options are considered "cheap," and if IV is on the high end of the historical range, then options are considered "expensive."
When buying a calendar spread, it is advantageous to enter the trade when implied volatility is low. This serves two purposes:
- It limits the amount of time premium paid to enter the trade
- Affords the potential for the position to gain value if IV rises after the trade is entered (if IV rises, the options will gain time premium; also, longer-term options have higher Vega values than shorter-term options. Thus, the longer-term option we bought will gain more time premium than the shorter-term option we sold, thus inflating the value of the net position.
For our example trade, we will:
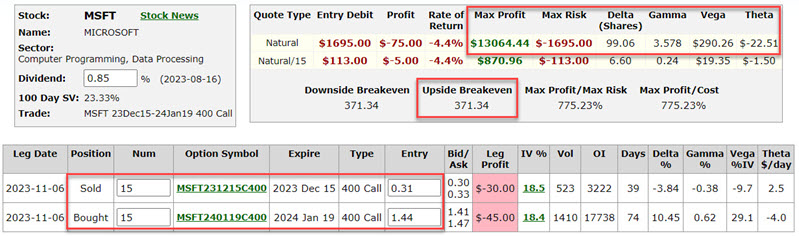
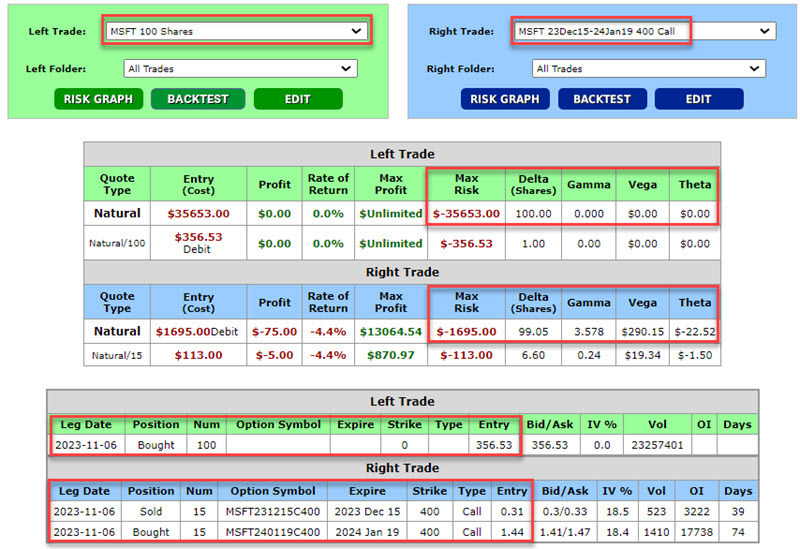
- Buy 15 MSFT Jan19 2024 400 strike price calls @ $1.47
- Sell 15 MSFT Dec15 2023 400 strike price calls @ $0.31
The particulars and risk curves appear in the figures below.
Key things to note:
- The cost to enter this trade is $1,695 (compared to $35,653 to buy 100 shares of MSFT stocks)
- $1,695 is also the maximum risk on the trade
- This position has a "delta" of 99.06. This means that for now, this position will behave like a position holding 99 shares of MSFT stock
- The position has a "gamma" of 3.578, which means it will gain (or lose) that many deltas for each $1 movement up (or down) in the price of MSFT shares
- The position has a "Vega" of $290.26. This means the position will gain roughly $290 in value if implied volatility for MSFT options rises one full percentage point (although it could also lose $290 in value if implied volatility declines instead).
- The position has a "theta" value of -$22.51. This means that with MSFT shares at their current price, the position will lose $22.51 of time premium due solely to the passage of one day (this is referred to as "time decay").
As you can see in the chart above, the position will continue to gain value as long as MSFT shares keep rising - up to the strike price of $400 a share. Then, the risk curves would roll over and begin to decrease. If MSFT shares fail to rise or decline in value, the option position could expire worthless and result in a loss of the total amount paid to enter the price ($1,695).
Comparing bull call spread to long shares
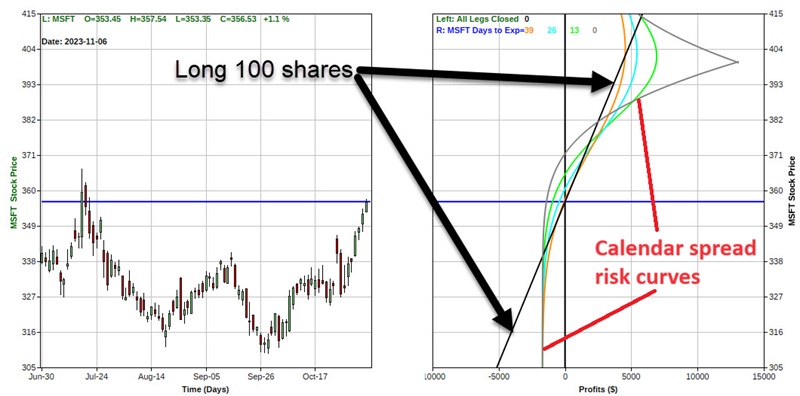
The figure below displays the particulars of holding long 100 shares of MSFT compared to the bull calendar spread.
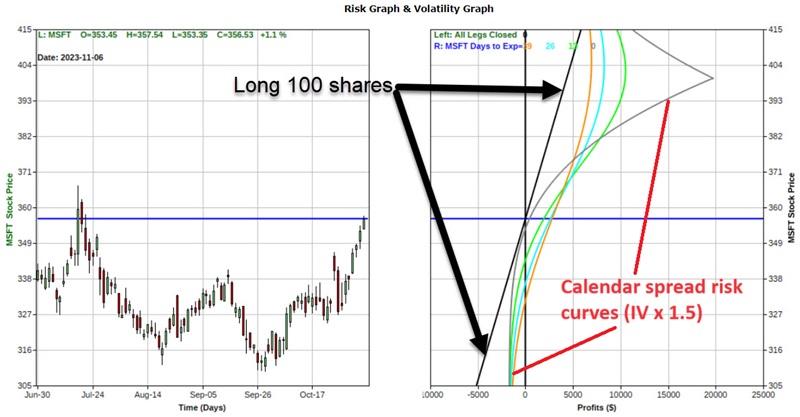
The chart below overlays the risk curves for the two positions (bull calendar spread vs. long 100 shares of MSFT). The solid black line displays the expected P/L for the long 100 share position. The colored lines represent the expected P/L for the bull calendar spread as of four different dates leading up to the December option expiration on December 15th.
If MSFT shares:
- Rally to roughly $378 to $415 a share, the calendar spread will generate a larger profit
- Trade between roughly $340 and $378 a share, the calendar spread will register either a loss or a smaller gain than the long 100 shares position
- Fall below roughly $340 a share, the long 100 shares position will continue to lose another $100 for each $1 MSFT shares decline in price. The calendar spread can lose no more than -$1,695
If implied option volatility rises...
One hope for the calendar spread would be an increase in implied options volatility during the life of the trade. If IV were to rise 50% during the life of the option trade, the long call would gain much more time premium than the short call.
The chart below assumes that IV rises 50%. According to the option model, the calendar spread position would gain roughly $2,798 in net time premium based solely on the increase in volatility and time premium. 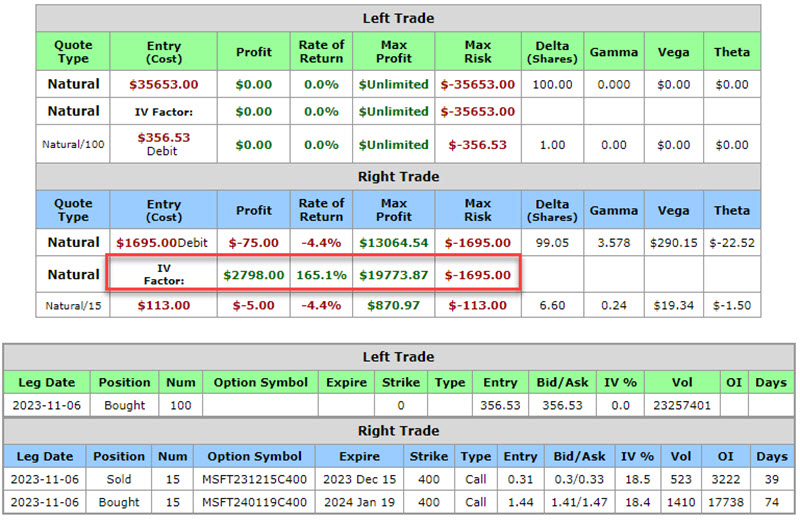
This would shift the risk curves for the calendar spread into much more profitable territory - as shown in the chart below. The solid black line (the P/L for long 100 shares of MSFT) does not change. However, the four colored lines shift further into profitable territory.
Managing a bullish calendar spread
A bullish calendar spread is not a "set it and forget it" type of trade. A plan is essential. However, there is no such thing as one best way to manage a calendar spread. As food for thought, here are some ideas:
- If MSFT declines in price, the trader must make a decision - cut a loss and try to salvage some premium, or let it ride and risk the total $1,695 committed to the trade
- If MSFT begins to rise, a trader might set a particular percentage gain which - if reached - they would either take the profit or adjust the trade to lock in a profit and position for further potential gains
- If MSFT does happen to approach $400 a share, a trader should be prepared to either take a profit or adjust the trade (because whether the stock rises or falls from $400, the expected profit declines)
What the research tells us…
No prediction is being made that MSFT shares will, in fact, rally sharply between now and December options expiration. The example above is intended merely to point out one alternative to buying shares of stock. The example options trade costs a fraction of the long 100 shares position - $1,695 versus $35,653, or 4.8% as much. In addition, the calendar spread enjoys the potential for an even greater profit than the long 100 shares position (up to a specific price for the underlying stock OR if implied volatility rises during the life of the trade). Likewise, the calendar spread enjoys limited risk. The caveat is that the short option expires in 39 calendar days, so MSFT must stage an upside breakout rally sooner rather than later for the calendar spread to become profitable.